Quantitation of Underivatized Omega-3 and Omega-6 Fatty ... - Dionex
Quantitation of Underivatized Omega-3 and Omega-6 Fatty ... - Dionex
Quantitation of Underivatized Omega-3 and Omega-6 Fatty ... - Dionex

You also want an ePaper? Increase the reach of your titles
YUMPU automatically turns print PDFs into web optimized ePapers that Google loves.
Table 1. LOD <strong>and</strong> LOQ Values for<br />
<strong>Omega</strong>-Free <strong>Fatty</strong> Acids by HPLC<br />
Analyte LOD (ng o.c.) LOQ (ng o.c.)<br />
SDA 9.7 32.5<br />
EPA 11.5 38.5<br />
ALA 13.2 43.9<br />
GLA 13.4 44.6<br />
DHA* 15.0 45.0<br />
Arach. 21.4 71.4<br />
LLA 10.4 34.7<br />
DPA 8.4 28.1<br />
CLA 10.6 35.2<br />
ETA 5.5 18.2<br />
Adrenic 10.1 33.8<br />
Oleic 4.9 16.3<br />
EDA 11.7 39.1<br />
Erucic 7.9 26.3<br />
* Many <strong>of</strong> the LOD <strong>and</strong> LOQ values found in Table 1 may actually be<br />
lower than reported, due to st<strong>and</strong>ard degradation. Typical LOD values<br />
for charged aerosol detection are 1–10 ng on column.<br />
Several oils <strong>and</strong> fats were processed <strong>and</strong> analyzed.<br />
In the initial oil hydrolyzation experiments, a solution<br />
<strong>of</strong> ethanol/water (3:2) was used. It was found that the<br />
oils did not hydrolyze well in this solution. With an<br />
exchange <strong>of</strong> isopropanol for the ethanol, it was identified<br />
that the isopropanol provided a greater yield <strong>of</strong> free fatty<br />
acids, <strong>and</strong> this solution was used for the hydrolyzation <strong>of</strong><br />
the samples.<br />
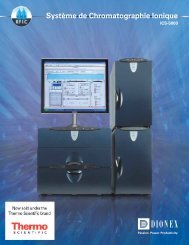
A chromatogram <strong>of</strong> hydrolyzed mustard oil is shown<br />
in Figure 5. This oil sample was found to contain a<br />
composition that is consistent with literature values8,9 shown in brackets: 51% erucic [41–50%], 11% oleic<br />
[8–15%], 21% linoleic [13–20%], <strong>and</strong> 13%<br />
a-linolenic acids.<br />
FIGURE 5. HPLC chromatogram <strong>of</strong> hydrolyzed mustard oil<br />
using a C30 150 × 4.5 mm, 5 µm column..<br />
148<br />
pA<br />
Peaks: 1. α-Linolenic acid<br />
5. Linoleic acid<br />
6. Eicosatrienoic acid<br />
8. Adrenic acid<br />
9. Oleic acid<br />
10. Eicosadienoic acid<br />
15. Erucic acid<br />
Other peaks are unidentified<br />
1<br />
23 4<br />
5<br />
6 7<br />
0<br />
12.9 14 15 16 17 18 19 20 21 22 23 24.1<br />
Minutes<br />
28111<br />
8<br />
9<br />
10 11<br />
12 13<br />
14 16<br />
4 <strong>Quantitation</strong> <strong>of</strong> <strong>Underivatized</strong> <strong>Omega</strong>-3 <strong>and</strong> <strong>Omega</strong>-6 <strong>Fatty</strong> Acids in Foods<br />
15<br />
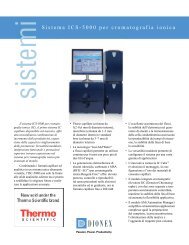
A hydrolyzed fish oil-based, commercially available supplement<br />
is shown in Figure 6. A large number <strong>of</strong> other<br />
free fatty acids may also be present with 24 unidentified<br />
peaks, in addition to the 14 evaluated in this study.<br />
FIGURE 6. HPLC chromatogram <strong>of</strong> 20 µL hydrolyzed fish<br />
oil with addition <strong>of</strong> 200 µL isopropanol to aid in solubility. A<br />
total <strong>of</strong> 38 peaks were detected including all 14 st<strong>and</strong>ards.<br />
Peaks:<br />
4. Stearadonic Acid<br />
8. Eicosapentanoic acid<br />
9. α-Linolenic acid<br />
10. γ-Linoleic acid<br />
14. Docosahexanoic acid<br />
100<br />
15. Arachidonic acid<br />
17. Linoleic acid<br />
18. Docosapentanoic acid<br />
19. 9E, 14Z- conjugated<br />
linoleic acid<br />
22. Eicosatrienoic acid<br />
15. Adrenic acid<br />
27. Oleic acid<br />
30. Eicosadienoic acid<br />
36. Erucic acid<br />
pA<br />
8<br />
1 2 3<br />
6<br />
4<br />
5 7<br />
26<br />
14<br />
9<br />
25 27<br />
11<br />
32<br />
16 19<br />
29<br />
13<br />
23<br />
1718<br />
30 33<br />
10 12 15<br />
20 22 28<br />
31<br />
35<br />
21 24 34<br />
37<br />
36 38<br />
-5<br />
6.0 7.5 8.8 10.0 11.3 12.5 13.8 15.0 16.3 17.5 18.8 20.0 21.3 23.0<br />
Minutes<br />
28112-01<br />
Twelve additional samples were hydrolyzed in a similar<br />
manner <strong>and</strong> the results are shown in Table 2 <strong>and</strong> presented<br />
based on the ratio <strong>of</strong> omega-3 to omega-6 ratio (highest<br />
to lowest). Fish oil had the highest ratio, explaining its<br />
use as an omega-3 oil supplement. Grass-fed beef was<br />
determined to have a ratio <strong>of</strong> approximately 1, close<br />
to literature values 0.3–0.7. 10 Interestingly, pasture-fed<br />
chicken was determined to have a ratio <strong>of</strong> approximately<br />
0.62, significantly different than the commercial chicken<br />
omega fats ratio <strong>of</strong> approximately 0.05. 11