Quantitation of Underivatized Omega-3 and Omega-6 Fatty ... - Dionex
Quantitation of Underivatized Omega-3 and Omega-6 Fatty ... - Dionex
Quantitation of Underivatized Omega-3 and Omega-6 Fatty ... - Dionex

You also want an ePaper? Increase the reach of your titles
YUMPU automatically turns print PDFs into web optimized ePapers that Google loves.
<strong>Quantitation</strong> <strong>of</strong> <strong>Underivatized</strong> <strong>Omega</strong>-3 <strong>and</strong> <strong>Omega</strong>-6 <strong>Fatty</strong> Acids in Foods<br />
by HPLC <strong>and</strong> Charged Aerosol Detection<br />
Ian Acworth, Marc Plante, Bruce Bailey, <strong>and</strong> Christopher Crafts<br />
Thermo Fisher Scientific, Chelmsford, MA, USA<br />
Abstract<br />
The omega fatty acids are a group <strong>of</strong> compounds that<br />
include essential n-3 (omega-3, e.g., a-linolenic acid<br />
[ALA]), n-6 (omega-6, e.g., linoleic <strong>and</strong> arachidonic acids),<br />
<strong>and</strong> nonessential n-9, (omega-9, e.g., oleic<br />
<strong>and</strong> erucic acids) analytes. The omega-3 fatty acids,<br />
which also include eicosapentanoic acid (EPA) <strong>and</strong><br />
docosahexanoic acid (DHA), are required for normal<br />
growth. Their consumption is purported to have a<br />
number <strong>of</strong> health benefits: e.g., cancer prevention,<br />
cardiovascular disease prevention, <strong>and</strong> improved immune<br />
function. Although both omega-3 <strong>and</strong> -6 fatty acids can<br />
give rise to eicosanoid-signaling molecules<br />
(prostagl<strong>and</strong>ins, prostacyclins, thromboxanes, <strong>and</strong><br />
leukotrienes), the omega-6 eicosanoids are generally<br />
pro-inflammatory <strong>and</strong> may play a role in cardiovascular<br />
disease, high blood pressure, <strong>and</strong> arthritis. It appears<br />
that the amounts <strong>and</strong> balance <strong>of</strong> omega fatty acids in a<br />
person’s diet affect their eicosanoid-controlled functions.<br />
A proper balance <strong>of</strong> omega fatty acids in the diet<br />
is important.<br />
Traditionally, omega fatty acids are measured using<br />
gas chromatography (GC). For foods, analytes are<br />
extracted from the samples prior to hydrolysis to release<br />
the fatty acids from their triglycerides, then converted<br />
to their volatile methyl esters prior to analysis by GC.<br />
This approach is tedious, time-consuming, <strong>and</strong> the<br />
high temperatures can affect polyunsaturated fatty<br />
acid stability. The Thermo Scientific <strong>Dionex</strong> Corona<br />
charged aerosol detector provides a univeral massbased<br />
approach that is sensitive, has a wide dynamic<br />
range, <strong>and</strong> has a major advantage in that all nonvolative<br />
analytes give similar response independent <strong>of</strong><br />
chemical structure. No derivatization is required, <strong>and</strong><br />
unlike UV detection, the analyte does not need to contain<br />
a chromophore. Presented here is a simple <strong>and</strong> direct<br />
high-performance liquid chromatography <strong>and</strong> charged<br />
aerosol detection (HPLC-charged-aerosol-detector)<br />
method that can be used to measure omega-3, -6 <strong>and</strong> -9<br />
fatty acids in traditional <strong>and</strong> commercially produced meat,<br />
fish, <strong>and</strong> oils, as well as over-the-counter supplements.<br />
Introduction<br />
The common determination <strong>of</strong> omega lipids in foods<br />
comprises several steps, including extraction, hydroysis,<br />
<strong>and</strong> derivitization for measurement by GC. GC works<br />
well as a st<strong>and</strong>ard analytical tool for these determinations<br />
but requires alteration <strong>of</strong> the sample, <strong>and</strong> it can also<br />
adversely affect temperature-sensitive functional<br />
groups on specialized lipids. HPLC with ultraviolet<br />
detection requires use <strong>of</strong> low wavelengths, which limits<br />
solvent selection <strong>and</strong> increases the likelihood <strong>of</strong><br />
matrix interference.<br />
Shown here is a reversed-phase HPLC method for the<br />
determination <strong>of</strong> omega fatty acids in oil/food samples<br />
using a dual-gradient method <strong>and</strong> charged aerosol<br />
detection. This combination enables determination <strong>of</strong><br />
many fatty acids in a single analysis, <strong>and</strong> without the<br />
sample derivatization that is required for GC analysis.<br />
Several fatty acids were analyzed, including six omega-3<br />
fatty acids (stearidonic acid [SDA], eicosapentanoic<br />
acid [EPA], a-linolenic acid [ALA], docosahexanoic acid<br />
[DHA], docosapentanoic acid [DPA], eicosatrienoic acid<br />
[ETA]), five omega-6 fatty acids (γ-linolenic acid [GLA],<br />
arachidonic acid [Arach.], linoleic acid [LLA], adrenic<br />
acid, <strong>and</strong> eicosadienioic acid [EDA]), <strong>and</strong> two omega-9<br />
fatty acids (oleic <strong>and</strong> erucic acids). An omega-7 fatty<br />
acid, 9E,14Z-conjugated linoleic acid (CLA), was also<br />
included due to its cited importance as a nutrient. 1,2<br />
Charged aerosol detection is mass sensitive <strong>and</strong> can be<br />
added to HPLC or ultra HPLC (UHPLC) platforms. The<br />
detector provides the most consistent response for all<br />
nonvolatile <strong>and</strong> some semivolatile analytes <strong>of</strong> all HPLC<br />
detection techniques. 3 It works by charging particles as<br />
shown in Figure 1, <strong>and</strong> is not dependent on light<br />
scattering, which has large variability <strong>and</strong> generally<br />
lower sensitivity.<br />
Charged aerosol detection has been successfully used<br />
to characterize lipids <strong>of</strong> all classification, 4 including<br />
phospholipids (reversed phase5 <strong>and</strong> normal phase6,7 ),<br />
acylglycerides, phytosterols, free fatty acids, <strong>and</strong> free fatty<br />
alcohols. This method complements the free fatty acids<br />
method, using higher specificity for these analytes <strong>and</strong> a<br />
Thermo Scientific Acclaim C30 reversed-phase column.
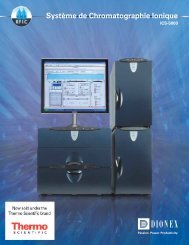
FIGURE 1. Schematic <strong>of</strong> the Corona charged aerosol<br />
detector flow paths.<br />
Method<br />
Experimental Conditions<br />
HPLC System: Thermo Scientific <strong>Dionex</strong><br />
UltiMate 3000 RSLC Dual Gradient<br />
Mobile Phase A: Water/formic acid/mobile phase B<br />
(900:3.6:100)<br />
Mobile Phase B: Acetone/acetonitrile/tetrahydr<strong>of</strong>uran/<br />
formic acid (675:225:100:4)<br />
Column: Acclaim C30, 250 × 3 mm, 3 µm<br />
Column Temp.: 30 °C<br />
Flow Rate, Eluent<br />
Gradient Pump: 1 mL/min<br />
1<br />
2<br />
4<br />
Flow Rate, Inverse<br />
Gradient Pump: 1 mL/min<br />
Eluent Gradient Pump Inverse Gradient Pump<br />
Time (min) % B Time (min) % B<br />
0.00 0.0 0.00 100.0<br />
1.00 60.0 1.10 100.0<br />
13.00 70.0 2.10 40.0<br />
22.00 95.0 14.10 30.0<br />
24.00 95.0 23.10 5.0<br />
24.00 0.0 25.10 5.0<br />
29.00 0.0 25.10 100.0<br />
30.10 100.0<br />
3<br />
8<br />
6<br />
5<br />
7<br />
1. Liquid eluent enters from the HPLC system<br />
2. Pneumatic nebulization occurs<br />
3. Small droplets enter the drying tube<br />
4. Large drops exit to drain<br />
5. Dried particles enter the mixing chamber<br />
6. Gas stream passes over corona needle<br />
7. Charged gas collides with particles <strong>and</strong> transfers charge<br />
8. High mobility species are removed<br />
9. Remaining charged particles measured with a very sensitive electrometer<br />
10. Signal is transferred to chromatographic data s<strong>of</strong>tware<br />
10<br />
9<br />
Injection Volume: 2.00 µL<br />
Detector: Corona ultra RS charged<br />
aerosol detector<br />
Corona Filter: High<br />
Corona Nebulizer Temp.: 15 °C<br />
Total Run Time: 30.1 min<br />
The system is configured so that the analytical pump<br />
provides the eluent through the column, <strong>and</strong> the second<br />
pump adds the solvents in a manner that is inverse <strong>of</strong><br />
the column gradient. In this manner, the composition <strong>of</strong><br />
the eluent entering the charged aerosol detector is<br />
maintained at a constant percent organic to minimize<br />
changes between relative response factors <strong>of</strong> the different<br />
analytes. It was determined that the void time for the<br />
analytical stream was 1.10 minutes greater than that for<br />
the inverse-gradient stream, <strong>and</strong> this time was added<br />
to the inverse-gradient pump program, as shown in the<br />
table above. This configuration reduces the relative<br />
response differences between analytes caused by the<br />
changing percent organic in the column eluent.<br />
St<strong>and</strong>ard Preparation<br />
All st<strong>and</strong>ards were dissolved <strong>and</strong> diluted to 2500 µg/mL<br />
in alcohol, <strong>and</strong> diluted serially to a concentration <strong>of</strong><br />
6.25 µg/mL.<br />
Sample Preparation<br />
All solid fat samples (50–100 mg) were extracted in<br />
1.2 mL methanol/chlor<strong>of</strong>orm (1:1) for 15 min using vortex<br />
mixing. Extracts were then centrifuged to remove solids,<br />
<strong>and</strong> 1.0 mL <strong>of</strong> extract was added to 4 mL <strong>of</strong> isopropanol/<br />
water (3:2) <strong>and</strong> 1 mL <strong>of</strong> 5 M KOH.<br />
All liquid oil samples (50 µL aliquot) were dissolved/<br />
dispersed in 5 mL isopropanol/water (3:2) <strong>and</strong> 1 mL <strong>of</strong><br />
5 M KOH.<br />
All samples were heated in an 80 °C water bath for 1 h<br />
with occasional stirring. After samples were cooled, a<br />
500 µL aliquot was removed <strong>and</strong> 25 µL <strong>of</strong> formic acid<br />
was added to neutralize the sample.<br />
Results <strong>and</strong> Discussion<br />
A chromatogram <strong>of</strong> the 14 st<strong>and</strong>ards (2500 ng on<br />
column [o.c.]) is shown in Figure 2.<br />
2 <strong>Quantitation</strong> <strong>of</strong> <strong>Underivatized</strong> <strong>Omega</strong>-3 <strong>and</strong> <strong>Omega</strong>-6 <strong>Fatty</strong> Acids in Foods<br />
26802
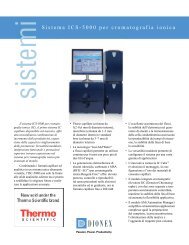
FIGURE 2. HPLC chromatogram <strong>of</strong> 14 omega-free<br />
fatty acids.<br />
50<br />
pA<br />
Peaks: 1. Stearadonic Acid 8. Docosapentanoic acid<br />
2. Eicosapentanoic acid 9. 9E, 14Z- conjugated linoleic acid<br />
3. α-Linolenic acid 10. Eicosatrienoic acid<br />
4. γ-Linoleic acid 11. Adrenic acid<br />
5. Docosahexanoic acid 12. Oleic acid<br />
6. Arachidonic acid 13. Eicosadienoic acid<br />
7. Linoleic acid 14. Erucic acid<br />
1<br />
2<br />
3<br />
4<br />
5<br />
8<br />
6 7<br />
-5<br />
6.0 7.5 8.8 10.0 11.3 12.5 13.8 15.0 16.3 17.5 18.8 20.0 21.3 23.0<br />
Peak retention times in min were found to be: SDA 11.8,<br />
EPA 13.7, ALA 14.0, GLA 14.4, DHA 15.8, Arach. 16.4,<br />
LLA 16.7, DPA 17.0, CLA 17.2, ETA 17.9, adrenic 18.9,<br />
oleic 19.2, EDA 19.7, <strong>and</strong> erucic 23.1 minutes.<br />
Use <strong>of</strong> the inverse gradient improved the consistency<br />
<strong>of</strong> response across the analytes. The relative spread<br />
<strong>of</strong> responses between the inverse-gradient method,<br />
<strong>and</strong> the gradient-only method decreased by 42%,<br />
calculated by ([inverse-gradient max–min] – [gradient-only<br />
max–min]/[gradient-only max–min]). This indicates that the<br />
use <strong>of</strong> the inverse gradient can provide a benefit to<br />
quantitation when unknown peaks are present in a<br />
sample chromatogram, providing for improved<br />
quantitation estimates.<br />
It was later discovered that a few <strong>of</strong> the omega fatty acid<br />
st<strong>and</strong>ard materials had degraded during the course <strong>of</strong><br />
developing this method. This is the likely cause <strong>of</strong> the<br />
wide range <strong>of</strong> responses seen in the calibration curves,<br />
shown in Figures 3 <strong>and</strong> 4. In using a fresh st<strong>and</strong>ard for<br />
DHA, the response was found to be similar to that <strong>of</strong> ALA.<br />
The use <strong>of</strong> 10 mg/L <strong>of</strong> butylated hydroxyanisole (BHA)<br />
in the st<strong>and</strong>ard <strong>and</strong> sample solutions may preserve the<br />
dissolved analytes for a longer period <strong>of</strong> time without<br />
affecting the chromatography.<br />
Calibration curves, using the inverse gradient conditions<br />
data, were fit using inverted second-order polynomials<br />
resulting in correlation coefficients, r2 >0.9995. Triplicate<br />
analyses provided peak area reproducibility with an RSD<br />
Table 1. LOD <strong>and</strong> LOQ Values for<br />
<strong>Omega</strong>-Free <strong>Fatty</strong> Acids by HPLC<br />
Analyte LOD (ng o.c.) LOQ (ng o.c.)<br />
SDA 9.7 32.5<br />
EPA 11.5 38.5<br />
ALA 13.2 43.9<br />
GLA 13.4 44.6<br />
DHA* 15.0 45.0<br />
Arach. 21.4 71.4<br />
LLA 10.4 34.7<br />
DPA 8.4 28.1<br />
CLA 10.6 35.2<br />
ETA 5.5 18.2<br />
Adrenic 10.1 33.8<br />
Oleic 4.9 16.3<br />
EDA 11.7 39.1<br />
Erucic 7.9 26.3<br />
* Many <strong>of</strong> the LOD <strong>and</strong> LOQ values found in Table 1 may actually be<br />
lower than reported, due to st<strong>and</strong>ard degradation. Typical LOD values<br />
for charged aerosol detection are 1–10 ng on column.<br />
Several oils <strong>and</strong> fats were processed <strong>and</strong> analyzed.<br />
In the initial oil hydrolyzation experiments, a solution<br />
<strong>of</strong> ethanol/water (3:2) was used. It was found that the<br />
oils did not hydrolyze well in this solution. With an<br />
exchange <strong>of</strong> isopropanol for the ethanol, it was identified<br />
that the isopropanol provided a greater yield <strong>of</strong> free fatty<br />
acids, <strong>and</strong> this solution was used for the hydrolyzation <strong>of</strong><br />
the samples.<br />
A chromatogram <strong>of</strong> hydrolyzed mustard oil is shown<br />
in Figure 5. This oil sample was found to contain a<br />
composition that is consistent with literature values8,9 shown in brackets: 51% erucic [41–50%], 11% oleic<br />
[8–15%], 21% linoleic [13–20%], <strong>and</strong> 13%<br />
a-linolenic acids.<br />
FIGURE 5. HPLC chromatogram <strong>of</strong> hydrolyzed mustard oil<br />
using a C30 150 × 4.5 mm, 5 µm column..<br />
148<br />
pA<br />
Peaks: 1. α-Linolenic acid<br />
5. Linoleic acid<br />
6. Eicosatrienoic acid<br />
8. Adrenic acid<br />
9. Oleic acid<br />
10. Eicosadienoic acid<br />
15. Erucic acid<br />
Other peaks are unidentified<br />
1<br />
23 4<br />
5<br />
6 7<br />
0<br />
12.9 14 15 16 17 18 19 20 21 22 23 24.1<br />
Minutes<br />
28111<br />
8<br />
9<br />
10 11<br />
12 13<br />
14 16<br />
4 <strong>Quantitation</strong> <strong>of</strong> <strong>Underivatized</strong> <strong>Omega</strong>-3 <strong>and</strong> <strong>Omega</strong>-6 <strong>Fatty</strong> Acids in Foods<br />
15<br />
A hydrolyzed fish oil-based, commercially available supplement<br />
is shown in Figure 6. A large number <strong>of</strong> other<br />
free fatty acids may also be present with 24 unidentified<br />
peaks, in addition to the 14 evaluated in this study.<br />
FIGURE 6. HPLC chromatogram <strong>of</strong> 20 µL hydrolyzed fish<br />
oil with addition <strong>of</strong> 200 µL isopropanol to aid in solubility. A<br />
total <strong>of</strong> 38 peaks were detected including all 14 st<strong>and</strong>ards.<br />
Peaks:<br />
4. Stearadonic Acid<br />
8. Eicosapentanoic acid<br />
9. α-Linolenic acid<br />
10. γ-Linoleic acid<br />
14. Docosahexanoic acid<br />
100<br />
15. Arachidonic acid<br />
17. Linoleic acid<br />
18. Docosapentanoic acid<br />
19. 9E, 14Z- conjugated<br />
linoleic acid<br />
22. Eicosatrienoic acid<br />
15. Adrenic acid<br />
27. Oleic acid<br />
30. Eicosadienoic acid<br />
36. Erucic acid<br />
pA<br />
8<br />
1 2 3<br />
6<br />
4<br />
5 7<br />
26<br />
14<br />
9<br />
25 27<br />
11<br />
32<br />
16 19<br />
29<br />
13<br />
23<br />
1718<br />
30 33<br />
10 12 15<br />
20 22 28<br />
31<br />
35<br />
21 24 34<br />
37<br />
36 38<br />
-5<br />
6.0 7.5 8.8 10.0 11.3 12.5 13.8 15.0 16.3 17.5 18.8 20.0 21.3 23.0<br />
Minutes<br />
28112-01<br />
Twelve additional samples were hydrolyzed in a similar<br />
manner <strong>and</strong> the results are shown in Table 2 <strong>and</strong> presented<br />
based on the ratio <strong>of</strong> omega-3 to omega-6 ratio (highest<br />
to lowest). Fish oil had the highest ratio, explaining its<br />
use as an omega-3 oil supplement. Grass-fed beef was<br />
determined to have a ratio <strong>of</strong> approximately 1, close<br />
to literature values 0.3–0.7. 10 Interestingly, pasture-fed<br />
chicken was determined to have a ratio <strong>of</strong> approximately<br />
0.62, significantly different than the commercial chicken<br />
omega fats ratio <strong>of</strong> approximately 0.05. 11
Table 2. Percent Compositions <strong>of</strong> HPLC<br />
Analysis <strong>of</strong> Hydrolyzed Samples<br />
Sample<br />
<strong>Omega</strong>-3<br />
(%)<br />
<strong>Omega</strong>-6<br />
(%)<br />
<strong>Omega</strong>-9<br />
(%)<br />
3:6<br />
Ratio<br />
Fish Oil 92.0 3.2 4.5 29.0<br />
Fish, Flax,<br />
Borage<br />
Supplement<br />
81.0 13.0 5.9 6.1<br />
Flax Oil 59.0 22.0 19.0 2.7<br />
Beef, Grass-fed 23.0 24.0 52.0 0.95<br />
Avocado Oil 15.0 22.0 64.0 0.68<br />
Chicken, Pastured<br />
25.0 40.0 35.0 0.62<br />
Mustard Oil 14.0 23.0 63.0 0.62<br />
Canola Oil 13.2 33.2 53.6 0.39<br />
Olive Oil 4.8 13.0 82.0 0.37<br />
Walnut Oil 12.0 75.0 13.0 0.16<br />
Castor Oil 4.2 62.0 34.0 0.067<br />
Safflower Oil 0.71 17.0 82.0 0.041<br />
Sesame Oil 1.5 61.0 38.0 0.024<br />
Corn Oil 1.6 72.0 26.0 0.022<br />
Castor oil was tested to evaluate the method’s performance<br />
with other oils. A chromatogram for hydrolyzed castor oil<br />
is shown in Figure 7. Here, a single fatty acid, ricinoleate,<br />
was found to have 83 area percent (uncalibrated) <strong>of</strong><br />
the fatty acids, which is similar to the reference value <strong>of</strong><br />
90%. 12 Ricinoleate, which contains a unique 12-hydroxy<br />
group, elutes earlier than the other free fatty acids<br />
quantified in this method.<br />
FIGURE 7. HPLC chromatogram <strong>of</strong> hydrolyzed castor oil<br />
with ricinoleate-free fatty acid at 8.545 min.<br />
160<br />
pA<br />
1 2<br />
-20<br />
6 7 8 9 10 11 12 13 14 15 16 17 18 19 20 21 22 23<br />
Minutes<br />
28113<br />
Conclusions<br />
3<br />
Peaks: 3. Rincinoleic acid<br />
7. Linolenic acid<br />
8. Linoleic acid<br />
9. Adrenic acid<br />
10. Oleic acid<br />
11. Eicosadienoic acid<br />
Other peaks are unidentified<br />
4 5 6 7<br />
8<br />
9 10 11 1213 14<br />
Using this method, it is possible to obtain quantitative<br />
analyses <strong>of</strong> different omega-free fatty acids, including<br />
omega-3, -6, -7, <strong>and</strong> -9. Samples were hydrolyzed to<br />
separate the fatty acids from their glycerol backbone<br />
<strong>and</strong> analyzed directly using HPLC with charged aerosol<br />
detection. A wide variety <strong>of</strong> samples were analyzed,<br />
including animal- <strong>and</strong> plant-based oils, over-the-counter<br />
supplements, <strong>and</strong> meat fats. The mobile phase used<br />
here is compatible with mass spectrometry, which allows<br />
for the possibility <strong>of</strong> identifying unknown free fatty acids<br />
that may exist in a sample.<br />
5
References<br />
1. Blankson, H.; Stakkestad, J.A.; Fagertun, H.; Thom,<br />
E.; Wadstein, J.; Gudmundsen, O. J. <strong>of</strong> Nutr. 2000,<br />
130, 2943–2948.<br />
2. Kritchevsky D. Br. J. Nutr. 2000, 83 (5), 459–465.<br />
3. Dependence <strong>of</strong> Response on Chemical Structure,<br />
ESA—A <strong>Dionex</strong> Company, Application Brief<br />
70-8913 Rev B.<br />
4. Plante, M.; Bailey, B.; Acworth, I. The Use <strong>of</strong><br />
Charged Aerosol Detection with HPLC for the<br />
Measurement <strong>of</strong> Lipids, Methods in Molecular<br />
Biology, Donald Armstrong (ed.), 1, Volume 579,<br />
Lipidomics, Part 2, 469–482.<br />
5. Ramos, R.G.; Libong, D.; Rakotomanga, M;<br />
Gaudin, K; Loiseau, P.M.; Chaminade, P.<br />
J. Chromatogr A, 1209, 2008, 88–94.<br />
6. Cascone, A.; Eerola, S.; Ritieni, A.; Rizzo, A.<br />
J. Chromatogr A. 2006, 1120 (1-2) 211–220.<br />
©2011 Thermo Fisher Scientific, Inc.<br />
All trademarks are the property <strong>of</strong> Thermo Fisher Scientific Inc. <strong>and</strong> its subsidiaries.<br />
This information is not intended to encourage use <strong>of</strong> these products in any manners that might infringe the intellectual property rights <strong>of</strong> others.<br />
<strong>Dionex</strong> Products: 1228 Titan Way, PO Box 3603, Sunnyvale, CA 94088-3603, (408) 737-0700<br />
North America: U.S./Canada (847) 295-7500<br />
South America: Brazil (55) 11 3731 5140<br />
Europe: Austria (43) 616 51 25, Benelux (31) 20 683 9768 (32) 3 353 4294<br />
Denmark (45) 36 36 90 90, France (33) 1 39 30 01 10, Germany (49) 61125 991 0<br />
Irel<strong>and</strong> (353) 644 0064, Italy (39) 02 51 62 1267, Sweden (46) 8 473 3380,<br />
Switzerl<strong>and</strong> (41) 62 205 9966, United Kingdom (44) 1276 691722<br />
Asia Pacific: Australia (61) 2 9420 5233, China (852) 2428 3282, India (91) 22 2764 2735,<br />
Japan (81) 6885 1213, Korea (82) 2 2653 2580, Singapore (65) 6289 1190,<br />
Taiwan (886) 2 875 6655<br />
www.thermoscientific.com/dionex<br />
LPN 2931-02 01/12<br />
7. Sensitive, Single-Peak Phospholipid <strong>Quantitation</strong><br />
by NP-HPLC-CAD, ESA—A <strong>Dionex</strong> Company<br />
Application Note #70-9094.<br />
8. Banga, S.K. Breeding for Oil <strong>and</strong> Meal Quality.<br />
In Chopra V.L., Prakash S. (Eds). Oilseed <strong>and</strong><br />
Vegetable Brassicas: Indian Perspective, 1996,<br />
Chapter 11, 234–249.<br />
9. Prakash, S.; Kumar, P.R.; Sethi, M.; Singh, C.;<br />
T<strong>and</strong>on, R.K. Mustard Oil: The Ultimate Edible Oil.<br />
The Botanica 2000, 50, 94–101.<br />
10. Daley, C.A.; Abbott, A.; Doyle, P.S.; Nader, G.A;<br />
Larson, S. Nutrition Journal 2010, 9 (10), 1–12.<br />
11. Based on data from USDA National Nutrient<br />
Database for St<strong>and</strong>ard Reference, Release 20,<br />
http://jmyarlott.com/Food/health/<strong>Omega</strong>3/<br />
Default.asp (last accessed 07 Jan 2011).<br />
12. McKeon, T.A.; Lin J.T.; Stafford, A.E.; Adv. Exp. Med.<br />
Biol. 1999, 464, 37–47.