Folie
Folie
Folie

Create successful ePaper yourself
Turn your PDF publications into a flip-book with our unique Google optimized e-Paper software.
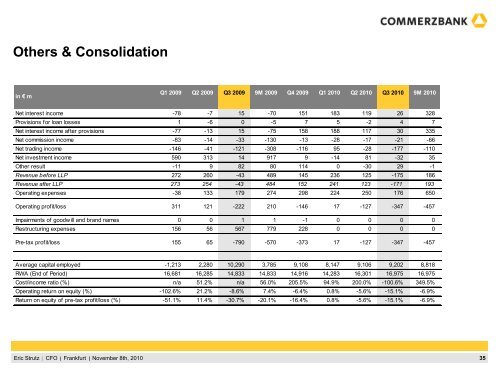
Others & Consolidation<br />
in € m<br />
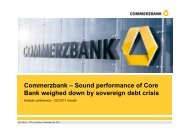
Eric Strutz CFO <br />
Frankfurt <br />
November 8th, 2010<br />
Q1 2009 Q2 2009 Q3 2009 9M 2009 Q4 2009 Q1 2010 Q2 2010 Q3 2010 9M 2010<br />
Net interest income -78 -7 15 -70 151 183 119 26 328<br />
Provisions for loan losses 1 -6 0 -5 7 5 -2 4 7<br />
Net interest income after provisions -77 -13 15 -75 158 188 117 30 335<br />
Net commission income -83 -14 -33 -130 -13 -28 -17 -21 -66<br />
Net trading income -146 -41 -121 -308 -116 95 -28 -177 -110<br />
Net investment income 590 313 14 917 9 -14 81 -32 35<br />
Other result -11 9 82 80 114 0 -30 29 -1<br />
Revenue before LLP 272 260 -43 489 145 236 125 -175 186<br />
Revenue after LLP 273 254 -43 484 152 241 123 -171 193<br />
Operating expenses -38 133 179 274 298 224 250 176 650<br />
Operating profit/loss 311 121 -222 210 -146 17 -127 -347 -457<br />
Impairments of goodw ill and brand names 0 0 1 1 -1 0 0 0 0<br />
Restructuring expenses 156 56 567 779 228 0 0 0 0<br />
Pre-tax profit/loss 155 65 -790 -570 -373 17 -127 -347 -457<br />
Average capital employed -1,213 2,280 10,290 3,785 9,108 8,147 9,106 9,202 8,818<br />
RWA (End of Period) 16,681 16,285 14,833 14,833 14,916 14,283 16,301 16,975 16,975<br />
Cost/income ratio (%) n/a 51.2% n/a 56.0% 205.5% 94.9% 200.0% -100.6% 349.5%<br />
Operating return on equity (%) -102.6% 21.2% -8.6% 7.4% -6.4% 0.8% -5.6% -15.1% -6.9%<br />
Return on equity of pre-tax profit/loss (%) -51.1% 11.4% -30.7% -20.1% -16.4% 0.8% -5.6% -15.1% -6.9%<br />
35