Folie
Folie
Folie

You also want an ePaper? Increase the reach of your titles
YUMPU automatically turns print PDFs into web optimized ePapers that Google loves.
Central and Eastern Europe<br />
in € m<br />
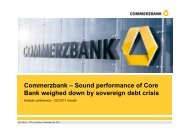
Eric Strutz CFO <br />
Frankfurt <br />
November 8th, 2010<br />
Q1 2009 Q2 2009 Q3 2009 9M 2009 Q4 2009 Q1 2010 Q2 2010 Q3 2010 9M 2010<br />
Net interest income 164 163 160 487 178 159 161 164 484<br />
Provisions for loan losses -173 -202 -141 -516 -296 -94 -92 -127 -313<br />
Net interest income after provisions -9 -39 19 -29 -118 65 69 37 171<br />
Net commission income 31 46 46 123 47 47 53 53 153<br />
Net trading income 29 19 15 63 16 18 20 19 57<br />
Net investment income -5 -1 -3 -9 -5 -1 4 4 7<br />
Other result 7 3 2 12 -7 3 9 9 21<br />
Revenue before LLP 226 230 220 676 229 226 247 249 722<br />
Revenue after LLP 53 28 79 160 -67 132 155 122 409<br />
Operating expenses 115 116 120 351 135 127 147 153 427<br />
Operating profit/loss -62 -88 -41 -191 -202 5 8 -31 -18<br />
Impairments of goodw ill and brand names 0 0 0 0 0 0 0 0 0<br />
Restructuring expenses 0 0 0 0 5 0 0 0 0<br />
Pre-tax profit/loss -62 -88 -41 -191 -207 5 8 -31 -18<br />
Average capital employed 1,653 1,597 1,619 1,623 1,551 1,598 1,597 1,675 1,623<br />
RWA (End of Period) 19,213 18,626 19,066 19,066 18,356 18,727 19,701 18,990 18,990<br />
Cost/income ratio (%) 50.9% 50.4% 54.5% 51.9% 59.0% 56.2% 59.5% 61.4% 59.1%<br />
Operating return on equity (%) -15.0% -22.0% -10.1% -15.7% -52.1% 1.3% 2.0% -7.4% -1.5%<br />
Return on equity of pre-tax profit/loss (%) -15.0% -22.0% -10.1% -15.7% -53.4% 1.3% 2.0% -7.4% -1.5%<br />
31