Folie
Folie
Folie

You also want an ePaper? Increase the reach of your titles
YUMPU automatically turns print PDFs into web optimized ePapers that Google loves.
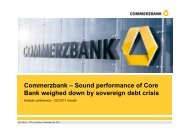
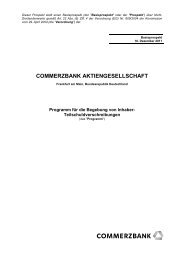
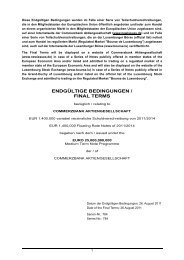
MSB delivered its best quarterly result ever<br />
Operating profit<br />
in € m<br />
320<br />
Ø Q3 equity<br />
allocation within<br />
Group<br />
*annualized<br />
126<br />
60<br />
78<br />
305<br />
Eric Strutz CFO <br />
Frankfurt <br />
November 8th, 2010<br />
386 456<br />
Q1 Q2 Q3 Q4 Q1 Q2 Q3<br />
2009 2010<br />
Q3`09 Q2`10 Q3`10 9M`09 9M`10<br />
Ø equity (€ m) 5,257 5,446 5,666 5,446 5,528<br />
Op. RoE* (%) 4.6 28.4 32.2 12.4 27.7<br />
CIR (%) 46.5 42.0 49.1 46.5 44.7<br />
18.1%<br />
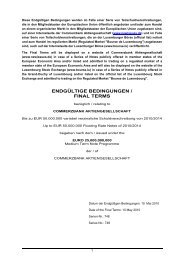
Main P&L items<br />
** Restatement in prior year and previous quarters 2010 due to change in reporting structure<br />
in € m Q3`09** Q2`10** Q3`10 9M`09** 9M`10**<br />
Net interest income 503 554 496 1,592 1,568<br />
Risk provisions -330 -94 78 -656 -177<br />
Commission income 223 219 241 686 728<br />
Net trading income -62 50 -14 -108 32<br />
Net investment income 1 15 29 0 41<br />
Operating expenses 339 347 365 1,011 1,070<br />
Operating profit 60 386 456 506 1,147<br />
› NII decreased by 10% q-o-q mainly due to FX effects and close-out of<br />
hedge positions<br />
› Write-backs in LLP<br />
›<br />
Net trading income affected by spread tightening in CDS markets<br />
(Credit Portfolio Management)<br />
› Operating expenses up due to allocated costs<br />
All operating segments on a full period base, Q1/09-12-day-effect adjusted in O&C<br />
16