Paul Bullock - Agricultural Drought
Paul Bullock - Agricultural Drought
Paul Bullock - Agricultural Drought

You also want an ePaper? Increase the reach of your titles
YUMPU automatically turns print PDFs into web optimized ePapers that Google loves.
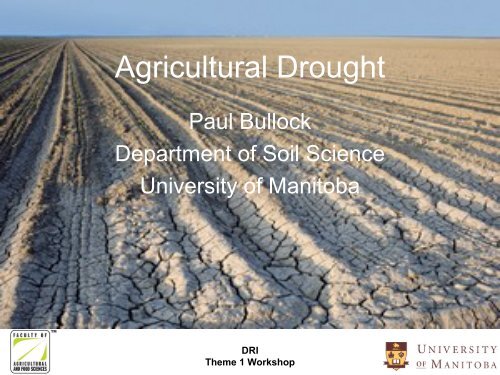
<strong>Agricultural</strong> <strong>Drought</strong><br />
<strong>Paul</strong> <strong>Bullock</strong><br />
Department of Soil Science<br />
University of Manitoba<br />
DRI<br />
Theme 1 Workshop
Common <strong>Drought</strong> Indices in Use<br />
Water Supply Indices<br />
• % Normal Precipitation<br />
• SPI<br />
• Deciles<br />
• Surface Water Supply<br />
Index<br />
Soil Moisture Indices<br />
• Palmer <strong>Drought</strong><br />
Severity Index<br />
• Crop Moisture Index<br />
Vegetation Indices<br />
• NDVI and others<br />
DRI<br />
Theme 1 Workshop
<strong>Agricultural</strong> <strong>Drought</strong><br />
• How accurately are<br />
agricultural outcomes<br />
(e.g. grain yield, quality<br />
characteristics)<br />
reflected by drought<br />
indices<br />
DRI<br />
Theme 1 Workshop
<strong>Agricultural</strong> <strong>Drought</strong><br />
Correlation of drought indices with winter wheat yield -<br />
Concho County, Colorado River basin<br />
(Narasimhan and Srinivasan 2005 Ag & For Met 133:69)<br />
Month PDSI SPI-1 SPI-3 SPI-6 SPI-9<br />
1 0.61 0.21 0.79 0.42 0.47<br />
2 0.61 0.46 0.65 0.43 0.42<br />
3 0.66 0.66 0.55 0.63 0.47<br />
4 0.65 0.47 0.60 0.78 0.53<br />
5 0.62 0.16 0.53 0.66 0.51<br />
DRI<br />
Theme 1 Workshop
Air temperature<br />
Humidity<br />
Wind speed<br />
Solar radiation<br />
Precipitation<br />
Soil moisture content<br />
2003 - 2006<br />
DRI Evaporation Workshop<br />
Saskatoon 17 May 2007
<strong>Drought</strong> Indices Calculated<br />
Water Supply Indices<br />
Accumulated Precipitation<br />
Percentage of Normal Precipitation<br />
Standardized Precipitation Index<br />
Water Demand Indices<br />
Reference evapotranspiration as per Hargreaves et al. (1985)<br />
Reference evapotranspiration as per Allen et al. (1998)<br />
Standard evapotranspiration as per Hargreaves et al. (1985)<br />
Standard evapotranspiration as per Allen et al. (1998)<br />
Potential evapotranspiraion as per Raddatz (1993)<br />
Actual evapotranspiration as per Raddatz (1993)<br />
Water Balance Indices<br />
Moisture deficit (Soil moisture at planting + Precip – HarETc)<br />
Moisture deficit (Soil moisture at planting + Precip – PMETc)<br />
Modeled crop water use (using HarETc)<br />
Modeled crop water use (using PMETc)<br />
Moisture deficit (Soil moisture at planting + Precip – PamETp)<br />
Abbreviation<br />
Precip<br />
%Norm<br />
SPI<br />
HarETo<br />
PMETo<br />
HarETc<br />
PMETc<br />
PamETp<br />
PamETa<br />
HarDef<br />
PMDef<br />
HarWU<br />
PMWU<br />
PamDef
Time Periods Considered<br />
• Monthly Periods of Index Accumulation<br />
• May May<br />
• June Jun<br />
• July Jul<br />
• August Aug<br />
• May through June MayJun<br />
• June through July JunJul<br />
• July through August JulAug<br />
• May through July MayJul<br />
• June through August JunAug<br />
• May through August MayAug<br />
• Growing Season Periods of Index Accumulation (for all but %Norm and SPI)<br />
• Vegetative Period (from date of planting to date of anthesis) PlAnth<br />
• Reproductive Period (from date of anthesis to date of maturity) AnthMat<br />
• Growing season PlMat
<strong>Drought</strong> indices with the highest r for wheat yield and quality (AC Barrie)<br />
Grain Parameter Index Time Period r<br />
Grain Yield PamETa AnthMat 0.87*<br />
PamETp Jul -0.77*<br />
Grain Protein PMETo PlMat 0.89**<br />
Concentration PMETo PlAnth 0.87*<br />
1000 kernel weight PamETa May 0.78*<br />
PamETa AnthMat 0.78*<br />
Flour Protein PMETc JulAug 0.92**<br />
Concentration PMETo PlMat 0.91**<br />
Flour Pentosan PamETa Jun 0.91**<br />
Content PamETa MayJun 0.80*<br />
Farinograph PMETc MayJun 0.89**<br />
Absorption PMWU MayJun 0.89**<br />
Farinograph Dough PMETc PlAnth 0.95**<br />
Development Time HarETc JunAug 0.90**<br />
Farinograph Stability PamETp PlAnth 0.88**<br />
PamETp JunJul 0.87*<br />
Loaf Volume HarETo PlAnth 0.93**<br />
HarETc JulAug 0.89**<br />
* , ** - significant at 5% and 1%, respectively
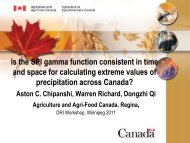
18<br />
16<br />
Barrie Flour Protein = 0.030 (Jul-Aug PMETc) + 6.74<br />
r 2 = 0.84**<br />
Flour Protein (%)<br />
14<br />
12<br />
10<br />
8<br />
Superb Flour Protein = 0.033 (Jul-Aug PMETc) + 5.62<br />
r 2 = 0.89**<br />
100 150 200 250 300 350 400<br />
Jul-Aug Penman-Monteith Potential ETc (mm)<br />
Jul-Aug PMETc
<strong>Drought</strong> Index Performance<br />
AC Barrie Superb<br />
• Water Supply Indices 0 1<br />
• Accumulated Precipitation - -<br />
• Percentage of Normal Precipitation - -<br />
• Standardized Precipitation Index - 1<br />
• Water Demand Indices 25 21<br />
• Reference evapotranspiration as per Hargreaves et al. (1985) 1 3<br />
• Reference evapotranspiration as per Allen et al. (1998) 4 2<br />
• Standard evapotranspiration as per Hargreaves et al. (1985) 2 2<br />
• Standard evapotranspiration as per Allen et al. (1998) 8 8<br />
• Potential evapotranspiraion as per Raddatz (1993) 4 2<br />
• Actual evapotranspiration as per Raddatz (1993) 6 4<br />
• Water Balance Indices 2 5<br />
• Moisture deficit (Soil moisture at planting + Precip – HarETc) - -<br />
• Moisture deficit (Soil moisture at planting + Precip – PMETc) - -<br />
• Modeled crop water use (using HarETc) 1 1<br />
• Modeled crop water use (using PMETc) 1 4<br />
• Moisture deficit (Soil moisture at planting + Precip – PamETp) - -
Time Periods Considered<br />
• AC Barrie Superb<br />
• Monthly Periods of Index Accumulation 16 16<br />
• May 2 5<br />
• June 2 -<br />
• July 1 2<br />
• August - 1<br />
• May through June 4 3<br />
• June through July 1 -<br />
• July through August 3 3<br />
• May through July 1 -<br />
• June through August 1 2<br />
• May through August 1 -<br />
• Growing Season Periods of Index Accumulation (for all but %Norm and SPI) 11 11<br />
• Vegetative Period (from date of planting to date of anthesis) 7 4<br />
• Reproductive Period (from date of anthesis to date of maturity) 2 5<br />
• Growing season 2 2
<strong>Agricultural</strong> <strong>Drought</strong><br />
• In the later stages of grain filling,<br />
there is extensive remobilisation<br />
of carbohydrate from storage in<br />
stems and leaves to grains<br />
through the phloem pathway<br />
(Porter and Hay 2006 The<br />
Physiology of Crop Yield).<br />
• Atmospheric moisture demand<br />
dictates water potential in the<br />
plant heads and this may control<br />
the amount of assimilate flow<br />
through the plant at this stage.<br />
photosynthesis<br />
grain growth<br />
Stoy 1980 Physiol. Aspects of Crop Productivity<br />
DRI<br />
Theme 1 Workshop
<strong>Agricultural</strong> <strong>Drought</strong><br />
• Would drought indices<br />
based on ET through key<br />
growth stages quantify<br />
agricultural effects of<br />
drought better than other<br />
indices currently in use<br />
DRI<br />
Theme 1 Workshop
Next Steps<br />
1. Add the 2005 and 2006 results to the drought index<br />
correlation analysis.<br />
3. Estimate 1999-2003 spring wheat yield and grain protein<br />
concentration at each weather station in western Canada<br />
using various indices including ET-based.<br />
5. Assess the yield estimates with small area crop statistics<br />
from Statistics Canada.<br />
7. Assess the grain protein concentration estimates with<br />
Canadian Grain Commission harvest survey data.<br />
DRI<br />
Theme 1 Workshop
Other Potential Information for<br />
the Paper<br />
1. Maps of Statistics Canada crop yield by crop division or<br />
census district across western Canada for 1999-2003.<br />
3. CCAP maps and statistics by census division of NDVI<br />
during peak growth periods for 1999-2003.<br />
DRI<br />
Theme 1 Workshop