DG8SAQ VNWA 3 & 3E - Vector Network Analyzer - SDR-Kits
DG8SAQ VNWA 3 & 3E - Vector Network Analyzer - SDR-Kits
DG8SAQ VNWA 3 & 3E - Vector Network Analyzer - SDR-Kits

Create successful ePaper yourself
Turn your PDF publications into a flip-book with our unique Google optimized e-Paper software.
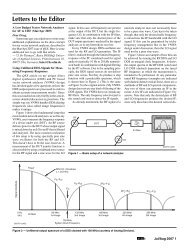
5.2 <strong>VNWA</strong> Transmission Measurements (2 Port Measurement)<br />
Filter Attenuation measurement is an example of <strong>VNWA</strong> "Two Port Measurements"<br />
The measurements of attenuation (S21 dB) and input impedance (S11 Z) of a 400 MHz Surface<br />
Acoustic Wave (SAW filter)<br />
Method: (assume <strong>VNWA</strong> has been calibrated before)<br />
Connect Device Under Test (DUT) input to <strong>VNWA</strong> TX port and Device output to <strong>VNWA</strong> RX port<br />
1. Set Start and Stop frequency<br />
2 Select measurements to be displayed (S21, dB), (S11, Real Z), (S11, ImagZ)<br />
Press "Single Sweep" Results should be displayed<br />
3 You can change the measurement scale if required to improve graph appearance<br />
4 Add Marker (Right Mouse Click and select "Normal Marker") and place on point of<br />
interest<br />
5 Graph position may be adjusted by placing curser here and dragging graph up or down.<br />
In the example Marker 1 displays: Frequency = 400.09 MHz Attenuation = -12.05dB Input RealZ =<br />
22.28 Ohm and Input imagZ = -5.76 Ohm (capacitive). Note: SAW filter is not matched to 50 Ohm<br />
impedance of <strong>VNWA</strong> TX and RX port.<br />
<strong>SDR</strong>-<strong>Kits</strong> <strong>VNWA</strong> 3 & <strong>3E</strong> "Getting Started" Manual W7 - XP v2.0 - copyright 2013 by <strong>SDR</strong>-<strong>Kits</strong> Page 39 of 47