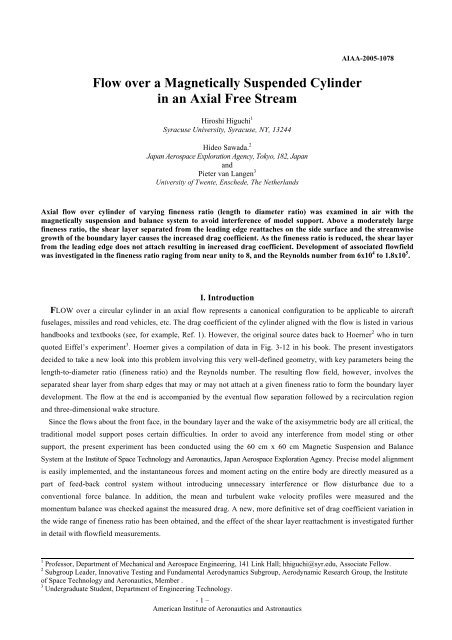
Flow over a Magnetically Suspended Cylinder in an Axial Free Stream
Flow over a Magnetically Suspended Cylinder in an Axial Free Stream
Flow over a Magnetically Suspended Cylinder in an Axial Free Stream

Create successful ePaper yourself
Turn your PDF publications into a flip-book with our unique Google optimized e-Paper software.
<strong>Flow</strong> <strong>over</strong> a <strong>Magnetically</strong> <strong>Suspended</strong> <strong>Cyl<strong>in</strong>der</strong><br />
<strong>in</strong> <strong>an</strong> <strong>Axial</strong> <strong>Free</strong> <strong>Stream</strong><br />
Hiroshi Higuchi 1<br />
Syracuse University, Syracuse, NY, 13244<br />
Hideo Sawada. 2<br />
Jap<strong>an</strong> Aerospace Exploration Agency, Tokyo, 182, Jap<strong>an</strong><br />
<strong>an</strong>d<br />
Pieter v<strong>an</strong> L<strong>an</strong>gen 3<br />
University of Twente, Enschede, The Netherl<strong>an</strong>ds<br />
AIAA-2005-1078<br />
<strong>Axial</strong> flow <strong>over</strong> cyl<strong>in</strong>der of vary<strong>in</strong>g f<strong>in</strong>eness ratio (length to diameter ratio) was exam<strong>in</strong>ed <strong>in</strong> air with the<br />
magnetically suspension <strong>an</strong>d bal<strong>an</strong>ce system to avoid <strong>in</strong>terference of model support. Above a moderately large<br />
f<strong>in</strong>eness ratio, the shear layer separated from the lead<strong>in</strong>g edge reattaches on the side surface <strong>an</strong>d the streamwise<br />
growth of the boundary layer causes the <strong>in</strong>creased drag coefficient. As the f<strong>in</strong>eness ratio is reduced, the shear layer<br />
from the lead<strong>in</strong>g edge does not attach result<strong>in</strong>g <strong>in</strong> <strong>in</strong>creased drag coefficient. Development of associated flowfield<br />
was <strong>in</strong>vestigated <strong>in</strong> the f<strong>in</strong>eness ratio rag<strong>in</strong>g from near unity to 8, <strong>an</strong>d the Reynolds number from 6x10 4 to 1.8x10 5 .<br />
I. Introduction<br />
FLOW <strong>over</strong> a circular cyl<strong>in</strong>der <strong>in</strong> <strong>an</strong> axial flow represents a c<strong>an</strong>onical configuration to be applicable to aircraft<br />
fuselages, missiles <strong>an</strong>d road vehicles, etc. The drag coefficient of the cyl<strong>in</strong>der aligned with the flow is listed <strong>in</strong> various<br />
h<strong>an</strong>dbooks <strong>an</strong>d textbooks (see, for example, Ref. 1). However, the orig<strong>in</strong>al source dates back to Hoerner 2 who <strong>in</strong> turn<br />
quoted Eiffel’s experiment 3 . Hoerner gives a compilation of data <strong>in</strong> Fig. 3-12 <strong>in</strong> his book. The present <strong>in</strong>vestigators<br />
decided to take a new look <strong>in</strong>to this problem <strong>in</strong>volv<strong>in</strong>g this very well-def<strong>in</strong>ed geometry, with key parameters be<strong>in</strong>g the<br />
length-to-diameter ratio (f<strong>in</strong>eness ratio) <strong>an</strong>d the Reynolds number. The result<strong>in</strong>g flow field, however, <strong>in</strong>volves the<br />
separated shear layer from sharp edges that may or may not attach at a given f<strong>in</strong>eness ratio to form the boundary layer<br />
development. The flow at the end is accomp<strong>an</strong>ied by the eventual flow separation followed by a recirculation region<br />
<strong>an</strong>d three-dimensional wake structure.<br />
S<strong>in</strong>ce the flows about the front face, <strong>in</strong> the boundary layer <strong>an</strong>d the wake of the axisymmetric body are all critical, the<br />
traditional model support poses certa<strong>in</strong> difficulties. In order to avoid <strong>an</strong>y <strong>in</strong>terference from model st<strong>in</strong>g or other<br />
support, the present experiment has been conducted us<strong>in</strong>g the 60 cm x 60 cm Magnetic Suspension <strong>an</strong>d Bal<strong>an</strong>ce<br />
System at the Institute of Space Technology <strong>an</strong>d Aeronautics, Jap<strong>an</strong> Aerospace Exploration Agency. Precise model alignment<br />
is easily implemented, <strong>an</strong>d the <strong>in</strong>st<strong>an</strong>t<strong>an</strong>eous forces <strong>an</strong>d moment act<strong>in</strong>g on the entire body are directly measured as a<br />
part of feed-back control system without <strong>in</strong>troduc<strong>in</strong>g unnecessary <strong>in</strong>terference or flow disturb<strong>an</strong>ce due to a<br />
conventional force bal<strong>an</strong>ce. In addition, the me<strong>an</strong> <strong>an</strong>d turbulent wake velocity profiles were measured <strong>an</strong>d the<br />
momentum bal<strong>an</strong>ce was checked aga<strong>in</strong>st the measured drag. A new, more def<strong>in</strong>itive set of drag coefficient variation <strong>in</strong><br />
the wide r<strong>an</strong>ge of f<strong>in</strong>eness ratio has been obta<strong>in</strong>ed, <strong>an</strong>d the effect of the shear layer reattachment is <strong>in</strong>vestigated further<br />
<strong>in</strong> detail with flowfield measurements.<br />
1 Professor, Department of Mech<strong>an</strong>ical <strong>an</strong>d Aerospace Eng<strong>in</strong>eer<strong>in</strong>g, 141 L<strong>in</strong>k Hall; hhiguchi@syr.edu, Associate Fellow.<br />
2 Subgroup Leader, Innovative Test<strong>in</strong>g <strong>an</strong>d Fundamental Aerodynamics Subgroup, Aerodynamic Research Group, the Institute<br />
of Space Technology <strong>an</strong>d Aeronautics, Member .<br />
3 Undergraduate Student, Department of Eng<strong>in</strong>eer<strong>in</strong>g Technology.<br />
- 1 –<br />
Americ<strong>an</strong> Institute of Aeronautics <strong>an</strong>d Astronautics
II. Experimental Set Up<br />
A. Magnetic Model Suspension, Force Bal<strong>an</strong>ce <strong>an</strong>d W<strong>in</strong>d Tunnel<br />
The experiment was conducted us<strong>in</strong>g the Magnetic Suspension <strong>an</strong>d Bal<strong>an</strong>ce System at the Institute of Space<br />
Technology <strong>an</strong>d Aeronautics, Jap<strong>an</strong> Aerospace Exploration Agency (formerly the National Aerospace Laboratory). The system<br />
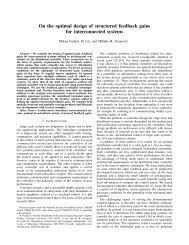
was developed by the second author <strong>an</strong>d is described <strong>in</strong> Ref. 4. Figure 1 shows schematically the coil arr<strong>an</strong>gement used<br />
<strong>in</strong> the system, <strong>an</strong>d specifications of the <strong>in</strong>dividual coils are listed <strong>in</strong> Table 1. The position <strong>an</strong>d attitude of the model<br />
were monitored by two CCD cameras oriented perpendicular to each other. Two colors <strong>an</strong>d filters were used to<br />
separate reflected lights <strong>in</strong> two directions. The position was controlled at a feedback frequency of 248Hz. The magnet<br />
current was calibrated aga<strong>in</strong>st known force applied through pulleys <strong>an</strong>d weights for each model. The calibration was<br />
repeatable with<strong>in</strong> 0.02%. The models were made of alum<strong>in</strong>um alloy <strong>an</strong>d housed a rod-shaped magnet along their<br />
centerl<strong>in</strong>e. The bal<strong>an</strong>ce system was <strong>in</strong>stalled <strong>in</strong> the subsonic w<strong>in</strong>d tunnel with a 60cmx60cm test section. The available<br />
flow speed r<strong>an</strong>ges from 10 to 35 m/s. The free stream turbulence level was less th<strong>an</strong> 0.05%. The measured flow <strong>an</strong>gle<br />
at the center is 0.05 degree <strong>in</strong> downwash <strong>an</strong>d 0.15 degree about z-axis shown <strong>in</strong> Fig. 1. Further detail of the MSBS <strong>an</strong>d<br />
the w<strong>in</strong>d tunnel c<strong>an</strong> be found <strong>in</strong> Ref. 4.<br />
model<br />
coil # turn number size purposes<br />
0,9 50 620 x 620 drag<br />
1,3,5,7 97 + 97 200 x 200 lift,<br />
pitch moment<br />
side force ,<br />
yaw<strong>in</strong>g moment,<br />
roll<strong>in</strong>g moment<br />
130V, 120A <strong>in</strong> cont<strong>in</strong>uous mode … 3 units<br />
130V, 60A <strong>in</strong> cont<strong>in</strong>uous mode … 4 units<br />
5 DOF for models with a ma<strong>in</strong> magnet only<br />
6 DOF for special models with pair magnets<br />
2,4,6,8 100 200 x 200<br />
coil drive<br />
units<br />
control<br />
Table 1 Specifications of the 60cm MSBS (Ref. 4)<br />
position sens<strong>in</strong>g camera<br />
Fig. 1 MSBS coil arr<strong>an</strong>gement (not to scale,<br />
only one camera is shown)<br />
B. Test Models<br />
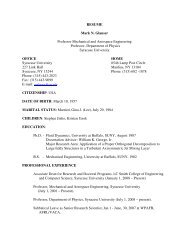
Figures 2 illustrates cyl<strong>in</strong>drical models supported magnetically <strong>in</strong> the test section. In addition to the model edges, the<br />
sens<strong>in</strong>g cameras use a vertical stripe <strong>in</strong> the middle to detect the model position <strong>an</strong>d attitude. Inst<strong>an</strong>t<strong>an</strong>eous model position<br />
was monitored <strong>an</strong>d held with<strong>in</strong> ±0.2mm. In order to provide a wide r<strong>an</strong>ge of the f<strong>in</strong>eness ratio, models with different<br />
diameters were used. One had 45mm diameter <strong>an</strong>d shared the same center section enclos<strong>in</strong>g the magnet. By ch<strong>an</strong>g<strong>in</strong>g the end<br />
caps of different lengths, n<strong>in</strong>e f<strong>in</strong>eness ratios between 4.13 <strong>an</strong>d 8.13 were achieved. Second set of model had a diameter of<br />
85mm <strong>an</strong>d the third 110mm. These larger diameter models provided the f<strong>in</strong>eness ratio down to 1.272. An additional model of<br />
25mm diameter <strong>an</strong>d f<strong>in</strong>eness ratio of 6 was also used. The Reynolds number based on the diameter r<strong>an</strong>ged from 60,000 to<br />
100,000.<br />
- 2 –<br />
Americ<strong>an</strong> Institute of Aeronautics <strong>an</strong>d Astronautics
Fig. 2(a) A magnetically supported 45mm diameter cyl<strong>in</strong>der model<br />
Fig. 2(b) A magnetically supported 85mm diameter cyl<strong>in</strong>der model<br />
III. Results <strong>an</strong>d Discussion<br />
A. Wake beh<strong>in</strong>d magnetically supported cyl<strong>in</strong>der<br />
The me<strong>an</strong> velocity distribution beh<strong>in</strong>d the L/D=5.02 model is presented <strong>in</strong> both vertical (z) <strong>an</strong>d horizontal (y)<br />
directions <strong>in</strong> Fig. 3. The dist<strong>an</strong>ce is measured from the trail<strong>in</strong>g edge of the model. An earlier test employed the PIV<br />
system on lo<strong>an</strong> <strong>an</strong>d the results <strong>in</strong>dicated excellent results <strong>in</strong> the wake while limit<strong>in</strong>g the illum<strong>in</strong>ation away from the<br />
position sens<strong>in</strong>g cameras. Results from <strong>an</strong>other PIV measurement <strong>in</strong> water will be also discussed oater. However, these<br />
velocity measurements relied on a more conventional total head probe as well as a hot-wire probe. Naturally, the<br />
results are limited to regions where these <strong>in</strong>strumentations are applicable. Figure 3 nonetheless demonstrates excellent<br />
flow axisymmetry measured with the total head probe. The results clearly benefited from the absence of the model<br />
support <strong>in</strong> the present system. The symmetry of the flow <strong>an</strong>d the repeatability of the measurements are further<br />
illustrated <strong>in</strong> Fig. 4 by vertical <strong>an</strong>d horizontal probe traverses.<br />
- 3 –<br />
Americ<strong>an</strong> Institute of Aeronautics <strong>an</strong>d Astronautics
80<br />
u/U<br />
65<br />
50<br />
35<br />
20<br />
5<br />
z(mm)<br />
-10<br />
-25<br />
-40<br />
-55<br />
-70<br />
1.00 -1.02<br />
0.98 -1.00<br />
0.96 -0.98<br />
0.94 -0.96<br />
0.92 -0.94<br />
0.90 -0.92<br />
0.88 -0.90<br />
0.86 -0.88<br />
0.84 -0.86<br />
0.82 -0.84<br />
0.80 -0.82<br />
-85<br />
-70<br />
-55<br />
-40<br />
-25<br />
-10<br />
5<br />
20<br />
35<br />
50<br />
65<br />
80<br />
-85<br />
y(mm)<br />
Figure 3 Me<strong>an</strong> axial velocity (u/U) distribution <strong>in</strong> the wake of the 45mm diameter cyl<strong>in</strong>der,<br />
L/D=5.02 at x/D= 6.11 (Re D =100,000)<br />
1.05<br />
1.00<br />
0.95<br />
y traverse<br />
y traverse (mirror image)<br />
z traverse (mirror image)<br />
z traverse<br />
u/U<br />
0.90<br />
0.85<br />
0.80<br />
-2.0 -1.5 -1.0 -0.5 0.0 0.5 1.0 1.5 2.0<br />
y/D or z/D<br />
Figure 4 Me<strong>an</strong> velocity profiles along 2 axes <strong>in</strong> the wake<br />
a 45mm diameter L/D=5.02 axial cyl<strong>in</strong>der at x/D= 6.11<br />
The streamwise variation of the me<strong>an</strong> velocity <strong>in</strong> the wake was measured beh<strong>in</strong>d the 25mm diameter cyl<strong>in</strong>der<br />
with a s<strong>in</strong>gle hot wire probe, <strong>an</strong>d the results are shown <strong>in</strong> Fig. 5. When the virtual orig<strong>in</strong> of the wake was taken to be<br />
1.3D downstream of the trail<strong>in</strong>g edge, the velocity defects shown <strong>in</strong> Figs. 4 <strong>an</strong>d 5 followed the established x^(-1/3)<br />
law for axisymmetric wakes.<br />
1.0<br />
u/Uma<strong>in</strong><br />
0.8<br />
0.6<br />
0.4<br />
z=1mm<br />
x=0.04D<br />
x=2D<br />
x=4D<br />
x=10D<br />
0.2<br />
0.0<br />
-2.0 -1.5 -1.0 -0.5 0.0 0.5 1.0 1.5 2.0<br />
y/D<br />
Figure 5.<br />
Velocity distributions across the wake of 25mm diameter cyl<strong>in</strong>der (L/D=6)<br />
- 4 –<br />
Americ<strong>an</strong> Institute of Aeronautics <strong>an</strong>d Astronautics
(y - D/2)/delta<br />
2.0<br />
1.5<br />
1.0<br />
0.5<br />
L/D=4.13 (45Dia.) delta=32.5mm<br />
L/D=5.02 (45Dia.) delta=32.5mm<br />
L/D=6.00 (25Dia.) delta=19.0mm<br />
L/D=8.13 (45Dia.) delta=41.0mm<br />
0.2<br />
0.0<br />
0 0 0 0 1 1 1 1<br />
u/U<br />
Figure 6. u/U vs.[y-(D/2)]/δ, effect of f<strong>in</strong>eness ratio)<br />
(Re D =50,000 for 25mm dia, 100,000 for 45mm dia.)<br />
2.0<br />
1.5<br />
L/D=4.13 (45Dia.) delta=32.5mm<br />
L/D=5.02 (45Dia.) delta=32.5mm<br />
L/D=6.00 (25Dia.) delta=19.0mm<br />
L/D=8.13 (45Dia.) delta=41.0mm<br />
(y - D/2)/delta<br />
1.0<br />
0.2<br />
0.5<br />
0.0<br />
0 0 0 0<br />
0.8<br />
u rms /U<br />
Figure 7. u rms /U vs. .[y-(D/2)]/δ, effect of f<strong>in</strong>eness ratio<br />
The boundary layer leav<strong>in</strong>g the cyl<strong>in</strong>der at the trail<strong>in</strong>g edge was further <strong>in</strong>vestigated for various f<strong>in</strong>eness ratios.<br />
The me<strong>an</strong> velocity profiles <strong>an</strong>d the turbulence <strong>in</strong>tensity normalizes by the boundary layer thickness are shown <strong>in</strong> Fig.<br />
6 <strong>an</strong>d Fig. 9, respectively. Ota 4 <strong>in</strong>vestigated the boundary layer <strong>over</strong> a st<strong>in</strong>g-mounted sharp-edged cyl<strong>in</strong>der, <strong>an</strong>d his<br />
velocity profiles at x/D=3.1, 5.1, <strong>an</strong>d 7.1 from the lead<strong>in</strong>g edge are very consistent with the present data at the<br />
trail<strong>in</strong>g edge (L/D=4.13-8.13). Ota’s experiment corresponds to Re D =5.62x10 4 <strong>an</strong>d the Reynolds number for the<br />
measurements <strong>in</strong> Figs. 6 <strong>an</strong>d 7 was 5x10 4 for the 25mm cyl<strong>in</strong>der <strong>an</strong>d 1x10 5 for the 45mm cyl<strong>in</strong>der. The oil flow<br />
visualization <strong>an</strong>d Ota’s measurement <strong>in</strong>dicated a separation bubble from the lead<strong>in</strong>g edge end<strong>in</strong>g with flow<br />
reattachment approximately at 1.5-1.6 diameter downstream. The me<strong>an</strong> velocity profiles further downstream of the<br />
reattachment are <strong>in</strong>dicative of a develop<strong>in</strong>g turbulent boundary layer. The turbulent <strong>in</strong>tensity profiles are also <strong>in</strong><br />
general agreement between the two experiments, though the present data are at a somewhat higher level. The power<br />
spectrum density <strong>in</strong> the immediate wake shear layer showed the distribution typical of turbulent boundary layer<br />
devoid of <strong>an</strong>y spectral peak, but at x/D=4, a spectral peak was evident at Strouhal number fD/U=0.185 which was<br />
<strong>in</strong>dicative of a helical mode wake oscillation.<br />
C. Force Measurement<br />
The magnetic bal<strong>an</strong>ce was calibrated aga<strong>in</strong>st the known weight for each model. The uncerta<strong>in</strong>ty of the drag<br />
coefficient measurement at Reynolds number 10 5 , for example, was estimated to be ±0.005.<br />
- 5 –<br />
Americ<strong>an</strong> Institute of Aeronautics <strong>an</strong>d Astronautics
1.00<br />
0.95<br />
L/D = 4.13<br />
L/D = 6.13<br />
L/D = 8.13<br />
CD<br />
0.90<br />
0.85<br />
0.80<br />
0.05 0.06 0.07 0.08 0.09 0.10 0.11 0.12<br />
Reynolds number (million)<br />
Fig. 8<br />
Drag coefficient versus Reynolds number at 3 large f<strong>in</strong>eness ratios.<br />
Figure 8 shows that the measured drag coefficients for 3 f<strong>in</strong>eness ratios are nearly const<strong>an</strong>t <strong>over</strong> the r<strong>an</strong>ge of Reynolds<br />
number between 60,000 <strong>an</strong>d 100,000. On the other h<strong>an</strong>d, the f<strong>in</strong>eness ratio has shown a clear <strong>in</strong>fluence on the drag<br />
coefficient as shown at the top of Fig. 9. In order to estimate the contributions to the total drag from the front face pressure,<br />
the base pressure <strong>an</strong>d the boundary layer drag, Fig. 9 shows the total drag, the momentum loss based on the boundary layer<br />
measurement (see Fig 7), <strong>an</strong>d the estimated sk<strong>in</strong> friction drag. The sk<strong>in</strong> friction drag was simply estimated from the empirical<br />
formula for the flat plate turbulent boundary layer (1/5 th power to the Reynolds number based on the length.) Here, the<br />
separated flow at the front corner is considered to attach at 1.5 diameter downstream, based on the oil flow visualization,<br />
which is consistent with Ota’s observation 5 . The differences among the three l<strong>in</strong>es are, <strong>in</strong> effect, estimates of the front<br />
pressure <strong>an</strong>d the base pressure, respectively, <strong>an</strong>d they are nearly <strong>in</strong>dependent of the f<strong>in</strong>eness ratio.<br />
1.0<br />
total drag (measured)<br />
CD based on momentaum thickness<br />
friction drag<br />
0.8<br />
C D = 0.0182(L/D) + 0.7809<br />
base drag<br />
0.6<br />
C D<br />
0.4<br />
C D = 0.0197(L/D) + 0.4331<br />
forebody pressure drag<br />
0.2<br />
0.0<br />
Fig. 9.<br />
C D = 0.0167 (L/D) - 0.0071<br />
friction drag<br />
0 1 2 3 4 5 6 7 8<br />
L/D<br />
Drag coefficient based on momentum thickness versus f<strong>in</strong>eness ratio<br />
(simple l<strong>in</strong>e fit is also given.)<br />
9<br />
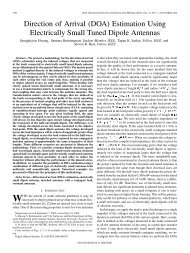
Figure 10 summarizes the present measurements <strong>an</strong>d historical as well as classical data. The first experiment by<br />
Eiffel 5 was conducted by dropp<strong>in</strong>g the test models from the Eiffel tower along a guide cable. The second Eiffel data 3<br />
were collected <strong>in</strong> his w<strong>in</strong>d tunnel with models cable-mounted <strong>in</strong> the test section. Apparently Hoerner used Eiffel’s<br />
second data (not as listed <strong>in</strong> his book) <strong>an</strong>d subtracted the estimated sk<strong>in</strong> friction <strong>an</strong>d presented the data. It is of <strong>in</strong>terest<br />
that these Hoerner’s data have been quoted for m<strong>an</strong>y decades <strong>in</strong> m<strong>an</strong>y articles, reference books <strong>an</strong>d textbooks, not<br />
necessarily after critical evaluation. Robertson et al. 7 carried out new w<strong>in</strong>d tunnel measurements to study the effect of<br />
- 6 –<br />
Americ<strong>an</strong> Institute of Aeronautics <strong>an</strong>d Astronautics
1.2<br />
1.1<br />
1.0<br />
Eiffel 1913 (30cm Dia.)<br />
Eiffel 1913 (15cm Dia.)<br />
Roberson<br />
JAXA/NAL(45Dia)<br />
JAXA(85Dia)<br />
JAXA(110Dia)<br />
Cd<br />
0.9<br />
0.8<br />
0.7<br />
0.6<br />
0 1 2 3 4 5 6 7 8 9<br />
L/D<br />
Fig. 10. Drag coefficient variations with f<strong>in</strong>eness ratio (The present data are all at Re D =1x10 5 )<br />
the free stream turbulence on the flow reattachment <strong>an</strong>d the drag at small f<strong>in</strong>eness ratios. Orig<strong>in</strong>al technical results are<br />
given, for example <strong>in</strong> Ref. 7, but summary of data is listed <strong>in</strong> Roberson <strong>an</strong>d Crowe’s textbook 8 for Re D >10 4 are used <strong>in</strong><br />
this figure. The present series of experiment are expected to provide modern, more def<strong>in</strong>itive results on how the<br />
flowfield <strong>an</strong>d drag vary with the wide r<strong>an</strong>ge of f<strong>in</strong>eness ratio.<br />
D. Discussion of results <strong>an</strong>d additional flowfield measurement <strong>in</strong> water.<br />
The lower drag coefficients obta<strong>in</strong>ed <strong>in</strong> the f<strong>in</strong>eness ratio L/D=1-2 is expected to represent flow reattachment on the<br />
side surface. Oil flow visualization was conducted on the long magnetic suspended model of the 45 mm diameter. The<br />
reattachment l<strong>in</strong>e was located near 1.6-1.7 diameters downstream of the lead<strong>in</strong>g edge. In order to obta<strong>in</strong> better<br />
ascerta<strong>in</strong> the flowfield, <strong>an</strong> additional set of experiment was conducted <strong>in</strong> a Syracuse University water ch<strong>an</strong>nel. In lieu<br />
of the magnetic suspension system, the model was st<strong>in</strong>g-mounted from downstream. The st<strong>in</strong>g diameter was kept small<br />
(635mm) compared to the model diameter of 77mm. The cross-flow strut was also kept sufficiently far downstream.<br />
The velocity vector field was measured us<strong>in</strong>g a DANTEC particle image velocimeter (PIV) system at reduced<br />
Reynolds number between 10,000 <strong>an</strong>d 30,000. Seed<strong>in</strong>g was provided by 20µm PSP particles uniformly mixed <strong>in</strong> the<br />
flow. Figure 11 shows the me<strong>an</strong> velocity vector field together with a short model of the f<strong>in</strong>eness ratio of 0.67. One c<strong>an</strong><br />
clearly see that the separat<strong>in</strong>g shear layer rema<strong>in</strong>s separated form<strong>in</strong>g a large reverse flow region <strong>in</strong> the wake. Figure 12<br />
on the other h<strong>an</strong>d shows the me<strong>an</strong> velocity vector past a long cyl<strong>in</strong>der of L/D=3. The separat<strong>in</strong>g <strong>an</strong>d reattach<strong>in</strong>g shear<br />
layer <strong>an</strong>d the recirculat<strong>in</strong>g flow with<strong>in</strong> the separation bubble are clearly seen <strong>in</strong> the measurement. Even though Ota<br />
used the hot wire <strong>an</strong>emometer on a rear-mounted cyl<strong>in</strong>drical model <strong>an</strong>d its use <strong>in</strong> the vic<strong>in</strong>ity of this type of separat<strong>in</strong>g<br />
flow may be of suspect, the deduced streaml<strong>in</strong>es <strong>an</strong>d the location of the flow reattachment are <strong>in</strong> very good agreement<br />
with the current PIV measurement. The behavior of the boundary layer development subsequent to the flow<br />
reattachment <strong>an</strong>d the drag variation with the f<strong>in</strong>eness ratio are <strong>in</strong> accord<strong>an</strong>ce with the velocity profile measurement <strong>in</strong><br />
Fig. 7 <strong>an</strong>d Fig. 10, respectively. At <strong>an</strong> <strong>in</strong>termediate f<strong>in</strong>eness, L/D=1.5, the time averaged separated shear layer attached<br />
<strong>in</strong> the immediate vic<strong>in</strong>ity of the trail<strong>in</strong>g edge as shown <strong>in</strong> Fig. 13. At higher Reynods number of 20,000 <strong>an</strong>d 30,000, the<br />
shear layer was found to attach slightly upstream, <strong>in</strong>dicat<strong>in</strong>g the higher sensitivity to the Reynolds number. This is<br />
close to the region where the drag coefficient reaches its m<strong>in</strong>imum with respect to the f<strong>in</strong>eness ration as shown <strong>in</strong> Fig.<br />
- 7 –<br />
Americ<strong>an</strong> Institute of Aeronautics <strong>an</strong>d Astronautics
10. Roberson et al 7 applied as high as 10% free stream turbulence <strong>an</strong>d observed the reduction of drag due to earlier<br />
reattachment of separated shear layer at L/D=1. Koenig <strong>an</strong>d Roshko 9 placed a disk ahead of the cyl<strong>in</strong>der to control the<br />
separat<strong>in</strong>g shear layer <strong>an</strong>d reattachment. Prelim<strong>in</strong>ary numerical simulations with the implicit LES method 10 showed<br />
general qualitative agreement with the present experiment but the size of the lead<strong>in</strong>g edge separation bubble was<br />
<strong>over</strong>-predicted.<br />
1000<br />
pix<br />
900<br />
800<br />
70 0<br />
600<br />
50 0<br />
400<br />
300<br />
200<br />
10 0<br />
0<br />
Image size: 1280×1024 (0,0), 8-bits (frame 1)<br />
Burs t#; rec#: 1; 1 (1), Date: 11/3/2004, Tim e: 11:40:11:015AM<br />
Analog <strong>in</strong>puts: -10 000; -10 000; -10 000; -10 000<br />
0 10 0 200 300 400 500 600 700 800 900 1000 110 0 pix 1200<br />
Figure 11. Me<strong>an</strong> velocity field (PIV) <strong>an</strong>d the model (L/D=1.67) at Re D =10,000.<br />
550<br />
500<br />
450<br />
400<br />
350<br />
300<br />
250<br />
200<br />
150<br />
10 0<br />
50<br />
Statistics vector map: Masked vectors, 79×127 vectors (10033)<br />
Size: 1280×1024 (0,0)<br />
A l i t 7 280 7 217 7 236 7 192<br />
0 50 10 0 150 200 250 300 350 400 450 500 550 600 650 70 0 750 800 850 900 950 1000 10 50 110 0 1150 12 0 0 pix 12 50<br />
Figure 12. Me<strong>an</strong> velocity above the L/D=3 cyl<strong>in</strong>der at Re D =10,000<br />
400<br />
pix<br />
350<br />
300<br />
250<br />
200<br />
150<br />
10 0<br />
50<br />
0<br />
Mask: Mask<br />
Size: 1280×1024 (0,0)<br />
Burst#; rec#: 1; 1 (1) Date: 11/5/2004 Time: 12:07:13:375AM<br />
350 400 450 500 550 600 650 700 750 800 850 900 950 pix 1000<br />
Figure 13. Me<strong>an</strong> velocity above the L/D=1.5 cyl<strong>in</strong>der at Re D =10,000<br />
- 8 –<br />
Americ<strong>an</strong> Institute of Aeronautics <strong>an</strong>d Astronautics
0 10 0 200 300 400 500 600 70 0 800 900 10 0 0 110 0 pix 1200<br />
1000<br />
pix<br />
900<br />
800<br />
70 0<br />
600<br />
50 0<br />
400<br />
300<br />
200<br />
10 0<br />
0<br />
Vector map: Masked vectors, 79×63 vectors (4977), 497 rejected, 323 substituted<br />
Burs t#; rec#: 7; 1 (7), Date: 11/3/2004, Tim e: 01:02:16:812PM<br />
Analog <strong>in</strong>puts: 10 000; 10 000; 10 000; 10 000<br />
Figure 14. Inst<strong>an</strong>t<strong>an</strong>eous velocity vector <strong>over</strong> the L/D=3 cyl<strong>in</strong>der model, Re D =10,000<br />
Even though the me<strong>an</strong> velocity profiles of the separat<strong>in</strong>g <strong>an</strong>d reattach<strong>in</strong>g flow looks well-def<strong>in</strong>ed <strong>in</strong> velocity vector<br />
as well as <strong>in</strong> me<strong>an</strong> streaml<strong>in</strong>es (not shown for brevity), it is worthwhile to note the complex flowfield <strong>in</strong>volved. Figure<br />
14 is <strong>an</strong> <strong>in</strong>st<strong>an</strong>t<strong>an</strong>eous velocity vector used to compute the averaged velocity profile <strong>in</strong> Fig. 12, <strong>an</strong>d it shows large-scale,<br />
convoluted eddy motion that will be pert<strong>in</strong>ent <strong>in</strong> <strong>in</strong>vest<strong>in</strong>g the possible control of the shear layer at wide Reynolds<br />
number r<strong>an</strong>ge <strong>an</strong>d turbulence level.<br />
The PIV measurement of the wake beh<strong>in</strong>d the st<strong>in</strong>g-mounted model was also performed <strong>in</strong> water. When the wake<br />
flow was measured with the st<strong>in</strong>g placed upstream, a disturb<strong>an</strong>ce from the upstream was detectable <strong>in</strong> the<br />
<strong>in</strong>st<strong>an</strong>t<strong>an</strong>eous velocity field. The flowfield measurements <strong>in</strong> the wake us<strong>in</strong>g a PIV system beh<strong>in</strong>d a magnetic suspended<br />
model are of critical import<strong>an</strong>ce <strong>an</strong>d are be<strong>in</strong>g scheduled.<br />
IV. Conclusion<br />
The drag coefficient variation of circular cyl<strong>in</strong>der placed <strong>in</strong> <strong>an</strong> axial flow was obta<strong>in</strong>ed <strong>over</strong> a wide r<strong>an</strong>ge of f<strong>in</strong>eness<br />
ratio. In order to avoid flow <strong>in</strong>terference with <strong>an</strong>y model support <strong>an</strong>d to <strong>in</strong>sure axisymmetry of the flow, the<br />
experiment was conducted us<strong>in</strong>g a magnetic suspension <strong>an</strong>d bal<strong>an</strong>ce system. The flow field <strong>in</strong> the wake, boundary<br />
layer as well as the behavior of the separated shear flow from the lead<strong>in</strong>g edge was studied to collaborate the measured<br />
drag variation.<br />
Acknowledgements<br />
The present study was supported by the Jap<strong>an</strong> Society for Promotion of Science, M<strong>in</strong>istry of Education <strong>an</strong>d Culture,<br />
Jap<strong>an</strong>. Authors acknowledge assist<strong>an</strong>ce of Mr. Tetsuya Kunimasu <strong>an</strong>d Dr. Sh<strong>in</strong>ichi Suda dur<strong>in</strong>g the JAXA experiment.<br />
Author PVL performed the water ch<strong>an</strong>nel experiment at Syracuse University with author HH <strong>an</strong>d they th<strong>an</strong>k Prof.<br />
Harry Hoeijmakers at Twente University for his arr<strong>an</strong>gement.<br />
References.<br />
1 Blev<strong>in</strong>s, R.D., Applied Fluid Dynamics H<strong>an</strong>dbook, V<strong>an</strong> Nostr<strong>an</strong>d Re<strong>in</strong>hold Comp<strong>an</strong>y, NY, 1984.<br />
2 Hoerner, S. F., Fluid Dynamic Drag, published by author, 1958, p.3-12.<br />
3 Eiffel, G., “The Resist<strong>an</strong>ce of the Air <strong>an</strong>d Aviation,” (tr<strong>an</strong>slated by J. C. Hunsaker), London: Constable Co., Boston: Houghton,<br />
Miffl<strong>in</strong> & Co. 1913.<br />
- 9 –<br />
Americ<strong>an</strong> Institute of Aeronautics <strong>an</strong>d Astronautics
4 Sawada, H., Kunimasu, T., “Status of MSBS Study at NAL,” 6 th International Symposium on Magnetic Suspension Technology,<br />
Oct. 7-11 2001, Tul<strong>in</strong>, Italy, pp.163-168.<br />
5 Ota, T., ”An Axisymmetric Separated <strong>an</strong>d Reattached <strong>Flow</strong> on a Longitud<strong>in</strong>al Blunt Circular <strong>Cyl<strong>in</strong>der</strong>” Journal of Applied<br />
Mech<strong>an</strong>ics, June 1975, pp. 311-315.<br />
6 Eiffel, G., “Recherches Expérimentales sur la Résist<strong>an</strong>ce de l'Air Exécutées à la Tour Eiffel,” L. Maretheux, Impimeur, 1907<br />
7 Roberson, J. A., L<strong>in</strong>, C. Y., Rutherford, G. S., <strong>an</strong>d St<strong>in</strong>e, M. D., “Turbulence Effects on Drag of Sharp-Edged<br />
Bodies,” Journal of the Hydraulic Division, Proceed<strong>in</strong>gs of ASCE, 1972, pp. 1187-1209.<br />
8 Roberson, J. A. <strong>an</strong>d Crowe, C. T., Eng<strong>in</strong>eer<strong>in</strong>g Fluid Mech<strong>an</strong>ics, 6 th edition, John Wiley & Sons, Inc., 1997.<br />
9 Koe<strong>in</strong>g, K. <strong>an</strong>d A. Roshko, A., ”Study of Geometrical Effects on the Drag <strong>an</strong>d <strong>Flow</strong> Field of Two Bluff Bodies Separated by a<br />
Gap,” J. Fluid Mech. Vol. 156, 1985, pp.167-204.<br />
10 Higuchi, H. , Sawada, H., Suenaga, Y., Dohi, S. , <strong>an</strong>d Kawamura, T. “Drag of Truncated <strong>Cyl<strong>in</strong>der</strong> <strong>in</strong> <strong>Axial</strong> <strong>Flow</strong>,” Bullet<strong>in</strong> of the<br />
Americ<strong>an</strong> Physical Society, Vol. 49, No. 9, Nov. 2004, p.78.<br />
- 10 –<br />
Americ<strong>an</strong> Institute of Aeronautics <strong>an</strong>d Astronautics