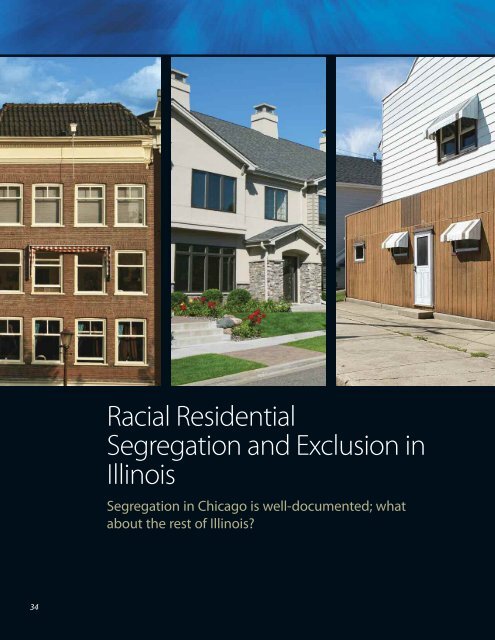
Racial Residential Segregation and Exclusion in Illinois - Institute of ...
Racial Residential Segregation and Exclusion in Illinois - Institute of ...
Racial Residential Segregation and Exclusion in Illinois - Institute of ...

Create successful ePaper yourself
Turn your PDF publications into a flip-book with our unique Google optimized e-Paper software.
34<br />
<strong>Racial</strong> <strong>Residential</strong><br />
<strong>Segregation</strong> <strong>and</strong> <strong>Exclusion</strong> <strong>in</strong><br />
Ill<strong>in</strong>ois
<strong>Racial</strong> <strong>Residential</strong> <strong>Segregation</strong> <strong>and</strong> <strong>Exclusion</strong><br />
<strong>in</strong> Ill<strong>in</strong>ois<br />
By Maria Krysan<br />
Metropolitan Chicago rema<strong>in</strong>s one <strong>of</strong><br />
the most residentially segregated<br />
areas <strong>in</strong> the United States. Accord<strong>in</strong>g to the<br />
2000 census, black-white segregation <strong>in</strong> the<br />
Chicago metropolitan area was the fifth<br />
highest <strong>in</strong> the nation <strong>and</strong> Lat<strong>in</strong>o-white segregation,<br />
although much lower than blackwhite<br />
segregation, was relatively high as<br />
well, rank<strong>in</strong>g 11th.<br />
In the case <strong>of</strong> black-white segregation, the<br />
levels <strong>in</strong> Chicago are what two prom<strong>in</strong>ent<br />
sociologists call “hyper-segregated” <strong>and</strong><br />
<strong>in</strong>dicative <strong>of</strong> an “American Apartheid.” 1<br />
While there is little debate that the levels <strong>of</strong><br />
segregation <strong>in</strong> the Chicago metropolitan<br />
area are high, there is considerable debate<br />
about its causes. And there is virtual silence<br />
about how much segregation there is<br />
<strong>in</strong> Ill<strong>in</strong>ois places outside the Chicago metropolitan<br />
area.<br />
The purpose <strong>of</strong> this chapter is to provide a<br />
portrait <strong>of</strong> racial residential patterns <strong>of</strong><br />
whites, blacks, <strong>and</strong> Lat<strong>in</strong>os, throughout<br />
the state <strong>of</strong> Ill<strong>in</strong>ois. We f<strong>in</strong>d: (1) there are<br />
rather few communities with racially/ethnically<br />
diverse populations that can be<br />
considered <strong>in</strong>tegrated; (2) black-white segregation<br />
levels are more severe than are<br />
Lat<strong>in</strong>o-white levels; <strong>and</strong> (3) there are large<br />
swaths <strong>of</strong> the state <strong>of</strong> Ill<strong>in</strong>ois that lack<br />
racial/ethnic diversity <strong>of</strong> any k<strong>in</strong>d, <strong>in</strong>tegrated<br />
or segregated.<br />
Thus, <strong>in</strong>equality among whites, blacks,<br />
<strong>and</strong> Lat<strong>in</strong>os on the dimension <strong>of</strong> hous<strong>in</strong>g<br />
is not just a problem <strong>in</strong> the city <strong>of</strong> Chicago,<br />
but throughout Ill<strong>in</strong>ois – <strong>in</strong> cities <strong>and</strong> small<br />
towns alike. And hous<strong>in</strong>g <strong>in</strong>equality is<br />
marked not only by a question <strong>of</strong> segregation<br />
with<strong>in</strong> diverse communities, but also<br />
by the near-complete lack <strong>of</strong> diversity <strong>in</strong><br />
many communities. After a discussion <strong>of</strong><br />
the levels <strong>of</strong> segregation <strong>and</strong> exclusion<br />
throughout the state, we take up the question<br />
<strong>of</strong> what causes these patterns, what<br />
some <strong>of</strong> the consequences are <strong>and</strong>, f<strong>in</strong>ally,<br />
what policy steps might be taken to address<br />
them.<br />
Data <strong>and</strong> Methods<br />
To measure the level <strong>of</strong> segregation <strong>in</strong> a<br />
location, researchers <strong>of</strong>ten rely on someth<strong>in</strong>g<br />
called the <strong>in</strong>dex <strong>of</strong> dissimilarity,<br />
which gauges the degree to which two<br />
groups are evenly distributed throughout<br />
an area. Suppose, for example, that a particular<br />
city had an overall population that<br />
was 80 percent white <strong>and</strong> 20 percent<br />
African American. A dissimilarity score <strong>of</strong><br />
75 would mean that 75 percent <strong>of</strong> whites<br />
(or African Americans) would have to<br />
move to a different neighborhood <strong>in</strong> the<br />
city <strong>in</strong> order to have all neighborhoods be<br />
80 percent white <strong>and</strong> 20 percent black.<br />
The dissimilarity <strong>in</strong>dex has a theoretical<br />
range from 0 (no segregation) to 100<br />
(complete segregation). In the follow<strong>in</strong>g<br />
section, we provide the dissimilarity<br />
<strong>in</strong>dex scores for black-white <strong>and</strong> Lat<strong>in</strong>owhite<br />
segregation for three different k<strong>in</strong>ds<br />
<strong>of</strong> Ill<strong>in</strong>ois places: 2 (1) metropolitan places<br />
with<strong>in</strong> the Chicago metropolitan area; (2)<br />
other metropolitan 3 places fall<strong>in</strong>g outside<br />
the Chicago metropolitan area; <strong>and</strong> (3)<br />
non-metropolitan places <strong>in</strong> the state <strong>of</strong><br />
Ill<strong>in</strong>ois. Because it is not possible to calculate<br />
mean<strong>in</strong>gful dissimilarity scores <strong>in</strong><br />
places that lack diversity, we further restrict<br />
our report <strong>of</strong> segregation scores to<br />
<strong>in</strong>clude only those places that, accord<strong>in</strong>g<br />
to the 2000 census, had (1) at least 500 residents;<br />
(2) at least 10 percent white population;<br />
<strong>and</strong> (3) either at least a 10 percent<br />
African American population or at least a<br />
10 percent Lat<strong>in</strong>o population. The calcula-<br />
1<br />
Douglas Massey <strong>and</strong><br />
Nancy Denton.<br />
American Apartheid:<br />
<strong>Segregation</strong> <strong>and</strong> the<br />
Mak<strong>in</strong>g <strong>of</strong> the Underclass<br />
(Cambridge:<br />
Harvard University<br />
Press, 1998).Underclass.<br />
Cambridge:<br />
Harvard University<br />
Press.<br />
2<br />
We use the Census<br />
geographical designation<br />
<strong>of</strong> “place”<br />
throughout this<br />
report. Roughly 86<br />
percent <strong>of</strong> Ill<strong>in</strong>ois<br />
residents live <strong>in</strong> one<br />
<strong>of</strong> the 1,315 “places”<br />
identified by the<br />
2000 Census. Those<br />
not liv<strong>in</strong>g <strong>in</strong> places<br />
are generally characterized<br />
as people<br />
liv<strong>in</strong>g <strong>in</strong>, “small settlements,<br />
<strong>in</strong> the<br />
open countryside, or<br />
<strong>in</strong> the densely settled<br />
fr<strong>in</strong>ge <strong>of</strong> large<br />
cities <strong>in</strong> areas that<br />
were built-up, but<br />
not identifiable as<br />
places.” (U.S. Bureau<br />
<strong>of</strong> the Census, Geographic<br />
Areas Reference<br />
Manual, p. 9-1).<br />
3<br />
We rely on OMB <strong>and</strong><br />
Census designations<br />
to determ<strong>in</strong>e what<br />
constitutes a “metropolitan<br />
statistical<br />
area”<strong>and</strong> note that<br />
its def<strong>in</strong>ition means<br />
that some <strong>in</strong>dividual<br />
communities that<br />
are classified as metropolitan<br />
are quite<br />
small <strong>and</strong> rural. Accord<strong>in</strong>g<br />
to the Office<br />
<strong>of</strong> Management <strong>and</strong><br />
Budget, a Metropolitan<br />
Statistical Area<br />
“ha[s] at least one<br />
urbanized area <strong>of</strong><br />
50,000 or more population,<br />
plus adjacent<br />
territory that<br />
has a high degree <strong>of</strong><br />
social <strong>and</strong> economic<br />
<strong>in</strong>tegration with the<br />
core as measured by<br />
commut<strong>in</strong>g ties.”<br />
(OMB Bullet<strong>in</strong> No.<br />
07-01: Update <strong>of</strong><br />
Statistical Area Def<strong>in</strong>itions<br />
<strong>and</strong> Guidance<br />
on Their Uses).<br />
35
The Ill<strong>in</strong>ois Report 2009<br />
There is virtual<br />
silence about<br />
how much<br />
segregation<br />
there is <strong>in</strong><br />
Ill<strong>in</strong>ois places<br />
outside the<br />
Chicago<br />
metropolitan<br />
area.<br />
4<br />
All <strong>in</strong>dex <strong>of</strong> dissimilarity<br />
calculations<br />
reported <strong>in</strong> this<br />
chapter were graciously<br />
provided to<br />
the author by Pr<strong>of</strong>essor<br />
Domenico<br />
Parisi, Mississippi<br />
State University.<br />
36<br />
Table 1<br />
Chicago Metro Places:<br />
Black-White <strong>Segregation</strong><br />
Place Name<br />
Dissimilarity Index,<br />
2000<br />
Hillside 29.3<br />
Willowbrook 31.1<br />
Berkeley 33.1<br />
Bol<strong>in</strong>gbrook 33.3<br />
Dolton 34.0<br />
Forest Park 38.3<br />
South Holl<strong>and</strong> 38.5<br />
Riverdale 39.1<br />
Preston Heights 41.8<br />
Olympia Fields 42.7<br />
University Park 42.8<br />
Park Forest 42.9<br />
Sauk Village 43.8<br />
Oak Park 45.1<br />
Hazel Crest 46.1<br />
Richton Park 46.2<br />
Burnham 48.2<br />
Zion 48.6<br />
Waukegan 50.2<br />
Glenwood 50.7<br />
Flossmoor 50.9<br />
Country Club Hills 50.9<br />
Aurora 50.9<br />
Broadview 52.1<br />
Lynwood 52.4<br />
Homewood 53.4<br />
Crete 55.7<br />
Calumet City 56.2<br />
North Chicago 58.8<br />
East Hazel Crest 60.9<br />
Blue Isl<strong>and</strong> 66.9<br />
Alsip 67.9<br />
Chicago Heights 68.2<br />
Matteson 70.7<br />
Evanston 70.8<br />
Crest Hill 72.6<br />
Fairmont 73.0<br />
Joliet 75.0<br />
Lans<strong>in</strong>g 76.5<br />
Markham 79.3<br />
Chicago 88.3<br />
Summit 89.3<br />
Justice 91.0<br />
Dixmoor 92.5<br />
Low <strong>Segregation</strong><br />
Medium <strong>Segregation</strong><br />
High <strong>Segregation</strong><br />
Source: Figures derived from calculations based on the 2000<br />
census <strong>and</strong> provided by Pr<strong>of</strong>essor Domenico Parisi, Mississippi<br />
State University.<br />
Figure 1<br />
Chicago Metropolitan Communities:<br />
Percent Distribution <strong>of</strong> Low,<br />
Moderate <strong>and</strong> High <strong>Segregation</strong><br />
Levels<br />
70<br />
60<br />
50<br />
40<br />
30<br />
20<br />
10<br />
0<br />
18<br />
39<br />
Low<br />
<strong>Segregation</strong><br />
48<br />
44<br />
34<br />
Moderate<br />
<strong>Segregation</strong><br />
Black-White <strong>Segregation</strong><br />
Lat<strong>in</strong>o-White <strong>Segregation</strong><br />
tions are based on the 2000 census <strong>and</strong><br />
use data at the block level, thus provid<strong>in</strong>g<br />
a f<strong>in</strong>er gra<strong>in</strong>ed measure <strong>of</strong> segregation<br />
than is typical (most studies <strong>of</strong> metropolitan<br />
areas use the larger geographical unit<br />
<strong>of</strong> the census tract). 4<br />
What Is <strong>Segregation</strong> Like <strong>in</strong> the Chicago<br />
Metropolitan Area<br />
In Table 1, we show a rank order <strong>of</strong> the<br />
black-white dissimilarity scores for all<br />
places with<strong>in</strong> the Chicago metropolitan<br />
area that meet the criteria outl<strong>in</strong>ed above.<br />
As a rule <strong>of</strong> thumb for <strong>in</strong>terpret<strong>in</strong>g the dissimilarity<br />
scores, researchers typically classify<br />
places with scores below 40 as “low,”<br />
between 40-60 as “moderate,” <strong>and</strong> 60 or<br />
above as “high.” The table has been colorcoded<br />
as tan, blue <strong>and</strong> p<strong>in</strong>k, respectively,<br />
to reflect these three levels <strong>of</strong> segregation.<br />
There are quite a range <strong>of</strong> segregation levels<br />
<strong>in</strong> metropolitan Chicago, from a low <strong>of</strong> 29<br />
<strong>in</strong> Hillside to a high <strong>of</strong> 92 <strong>in</strong> Dixmoor. The<br />
city <strong>of</strong> Chicago itself is among the most seg-<br />
17<br />
High<br />
<strong>Segregation</strong><br />
Source: Figures derived from calculations based on the 2000<br />
census <strong>and</strong> provided by Pr<strong>of</strong>essor Domenico Parisi, Mississippi<br />
State University.
<strong>Institute</strong> <strong>of</strong> Government & Public Affairs<br />
Table 2<br />
Chicago Metro Places: Lat<strong>in</strong>o-White <strong>Segregation</strong><br />
regated <strong>of</strong> the Chicago metropolitan area<br />
places, with a score <strong>of</strong> 88. Eighty-two percent<br />
<strong>of</strong> communities are either highly (34<br />
percent) or moderately (48 percent) segregated;<br />
with 18 percent fall<strong>in</strong>g <strong>in</strong>to the “low”<br />
category. Figure 1 shows the distribution <strong>of</strong><br />
communities across these three categories.<br />
The levels <strong>of</strong> segregation for whites <strong>and</strong><br />
Lat<strong>in</strong>os <strong>in</strong> the Chicago metropolitan area<br />
are quite different from the overall patterns<br />
reported for segregation between<br />
blacks <strong>and</strong> whites. Table 2 shows that<br />
Lat<strong>in</strong>o-white segregation levels range from<br />
28 <strong>in</strong> Lyons, Berwyn <strong>and</strong> Elmwood Park to<br />
80 <strong>in</strong> Hodgk<strong>in</strong>s. Although the range is<br />
somewhat similar to that observed for<br />
blacks <strong>and</strong> whites, the distribution <strong>of</strong><br />
places across the three categories <strong>of</strong> low,<br />
moderate <strong>and</strong> high are strik<strong>in</strong>gly different.<br />
Figure 1 illustrates this quite clearly. For<br />
example, there are twice as many communities<br />
where black-white segregation falls<br />
<strong>in</strong>to the “high” category (34 percent) as<br />
compared to communities where Lat<strong>in</strong>owhite<br />
segregation is classified as “high”<br />
(17 percent). At the other extreme, about<br />
two <strong>in</strong> 10 communities had black-white<br />
segregation levels that were considered<br />
“low,” while almost four <strong>in</strong> 10 communities<br />
had Lat<strong>in</strong>o-white segregation levels<br />
that were considered low.<br />
What Is <strong>Segregation</strong> Like <strong>in</strong> Metropolitan<br />
Areas Outside <strong>of</strong> Chicagol<strong>and</strong><br />
For metropolitan areas that lie outside the<br />
Chicago metropolitan area, the story is not<br />
much different from that <strong>in</strong>side the<br />
Chicago metropolitan area. First, the blackwhite<br />
segregation levels shown <strong>in</strong> Table 3<br />
(pg. 38) reveal that there are far fewer (just<br />
20) communities that meet the criteria for<br />
calculat<strong>in</strong>g segregation scores.<br />
Place Name<br />
Dissimilarity<br />
Index, 2000<br />
Lyons 27.6<br />
Berwyn 27.6<br />
Elmwood P ark 27.7<br />
Romeoville 28.7<br />
Stone Park 28.8<br />
Round Lake Heights 29.5<br />
Schiller Park 29.8<br />
Boulder Hill 30.6<br />
Ingalls Park 30.8<br />
Berkeley 31.1<br />
Cicero 31.6<br />
Sauk Village 32.0<br />
River Grove 32.6<br />
Park City 33.0<br />
Bridgeview 33.0<br />
Burbank 33.4<br />
Glendale Heights 33.5<br />
Dixmoor 33.6<br />
Posen 34.5<br />
Beach Park 34.8<br />
Summit 35.9<br />
South Elg<strong>in</strong> 36.0<br />
Forest View 36.1<br />
Hillside 36.3<br />
Blue Isl<strong>and</strong> 36.4<br />
Streamwood 36.8<br />
Bol<strong>in</strong>gbrook 36.9<br />
Rockdale 37.8<br />
Round Lake 38.1<br />
Northlake 39.7<br />
Frankl<strong>in</strong> Park 40.0<br />
South Chicago Heights 40.2<br />
Plano 40.9<br />
Round Lake Park 41.4<br />
Stickney 41.6<br />
Montgomery 41.7<br />
Carpentersville 41.9<br />
Zion 42.0<br />
Calumet City 42.1<br />
Low<br />
<strong>Segregation</strong><br />
Medium<br />
<strong>Segregation</strong><br />
Place Name<br />
But <strong>in</strong> terms <strong>of</strong> the distribution <strong>of</strong> communities<br />
across the three levels <strong>of</strong> segregation,<br />
they are quite similar to those <strong>in</strong> the<br />
Chicago metropolitan area. As Figure 2<br />
(pg. 38) shows, the vast majority <strong>of</strong> communities<br />
(90 percent) have black-white levels<br />
<strong>of</strong> segregation that are either “high” (40<br />
percent) or “moderate” (50 percent). And,<br />
as was the case <strong>in</strong> metropolitan Chicago, as<br />
Table 4 (pg. 38) shows, the 10 places where<br />
white-Lat<strong>in</strong>o segregation levels could be<br />
calculated have generally lower levels <strong>of</strong><br />
segregation – just two <strong>of</strong> the 10 fall <strong>in</strong>to the<br />
“highly” segregated level, with one<br />
(Momence) just barely mak<strong>in</strong>g it <strong>in</strong>to this<br />
category with a segregation score <strong>of</strong> 60.<br />
High<br />
<strong>Segregation</strong><br />
Dissimilarity<br />
Index, 2000<br />
Ha<strong>in</strong>esville 42.2<br />
Round Lake Beach 42.3<br />
Highwood 42.8<br />
Bensenville 44.0<br />
Burnham 45.2<br />
Melrose Park 45.7<br />
Hanover Park 45.8<br />
Wood Dale 46.1<br />
Carol Stream 47.2<br />
Woodstock 47.4<br />
Harvard 48.1<br />
Marengo 49.3<br />
North Aurora 49.6<br />
Waukegan 50.4<br />
Des Pla<strong>in</strong>es 50.7<br />
Addison 50.8<br />
Genoa 51.0<br />
Fairmont 51.1<br />
Warrenville 52.3<br />
Wheel<strong>in</strong>g 52.3<br />
H<strong>of</strong>fman Estates 53.7<br />
Elg<strong>in</strong> 53.9<br />
Wauconda 53.9<br />
Long Lake 55.8<br />
North Chicago 58.4<br />
Villa Park 61.0<br />
West Chicago 61.3<br />
Mundele<strong>in</strong> 61.5<br />
Joliet 62.0<br />
Aurora 63.0<br />
Chicago Heights 63.3<br />
Chicago 63.5<br />
Roll<strong>in</strong>g Meadows 65.1<br />
Prospect Heights 66.0<br />
Palat<strong>in</strong>e 67.8<br />
Mount Prospect 68.8<br />
Rosemont 72.9<br />
Hodgk<strong>in</strong>s 80.4<br />
Source: Figures derived from calculations based on the 2000 census <strong>and</strong> provided by Pr<strong>of</strong>essor<br />
Domenico Parisi, Mississippi State University.<br />
37
The Ill<strong>in</strong>ois Report 2009<br />
Table 3<br />
Metro Places Outside Chicago Metro<br />
Area: Black-White <strong>Segregation</strong><br />
Place Name<br />
Low <strong>Segregation</strong><br />
Medium <strong>Segregation</strong><br />
High <strong>Segregation</strong><br />
Dissimilarity<br />
Index, 2000<br />
Cahokia 33.2<br />
Fairview Heights 37.9<br />
O'Fallon 41.6<br />
Rantoul 43.0<br />
Shiloh 51.6<br />
Belleville 52.8<br />
Madison 57.7<br />
Urbana 58.0<br />
Champaign 58.2<br />
Lebanon 58.9<br />
Peoria 59.8<br />
Danville 59.9<br />
Decatur 61.2<br />
Spr<strong>in</strong>gfield 64.2<br />
Rockford 66.1<br />
Rock Isl<strong>and</strong> 66.2<br />
Kankakee 66.5<br />
Alton 67.0<br />
Pontoon Beach 72.2<br />
Centralia 74.0<br />
Source: Figures derived from calculations based on the 2000<br />
census <strong>and</strong> provided by Pr<strong>of</strong>essor Domenico Parisi, Mississippi<br />
State University.<br />
Figure 2<br />
Non-Chicago Metropolitan<br />
Communities: Percent Distribution <strong>of</strong><br />
Low, Moderate <strong>and</strong> High <strong>Segregation</strong><br />
Levels<br />
70<br />
60<br />
50<br />
40<br />
30<br />
20<br />
10<br />
0<br />
10<br />
20<br />
Low<br />
<strong>Segregation</strong><br />
50<br />
60<br />
Moderate<br />
<strong>Segregation</strong><br />
40<br />
Black-White <strong>Segregation</strong><br />
Lat<strong>in</strong>o-White <strong>Segregation</strong><br />
20<br />
High<br />
<strong>Segregation</strong><br />
Source: Figures derived from calculations based on the 2000<br />
census <strong>and</strong> provided by Pr<strong>of</strong>essor Domenico Parisi, Mississippi<br />
State University.<br />
5<br />
Daniel T. Lichter et<br />
al. “National Estimates<br />
<strong>of</strong> <strong>Racial</strong> <strong>Segregation</strong><br />
<strong>in</strong> Rural<br />
<strong>and</strong> Small-Town<br />
America,” Demography<br />
44(3) (2007):<br />
563-581.<br />
38<br />
Table 4<br />
Metro places outside Chicago Metro<br />
Area: Lat<strong>in</strong>o-White <strong>Segregation</strong><br />
Place Name<br />
Dissimilarity<br />
Index, 2000<br />
Fairmont City 33.0<br />
Silvis 39.8<br />
East Mol<strong>in</strong>e 47.9<br />
St. Anne 48.0<br />
Belvidere 48.3<br />
Capron 52.5<br />
Mol<strong>in</strong>e 54.2<br />
Rockford 57.0<br />
Momence 60.4<br />
Rank<strong>in</strong> 81.4<br />
Low <strong>Segregation</strong><br />
Medium <strong>Segregation</strong><br />
High <strong>Segregation</strong><br />
Source: Figures derived from calculations based on the 2000<br />
census <strong>and</strong> provided by Pr<strong>of</strong>essor Domenico Parisi, Mississippi<br />
State University.<br />
Figure 2 shows further evidence that<br />
black-white segregation levels are high,<br />
relative to Lat<strong>in</strong>o-white segregation levels.<br />
What is <strong>Segregation</strong> Like In Non-<br />
Metropolitan Areas<br />
There has been very little analysis <strong>of</strong> rural<br />
<strong>and</strong> small-town America’s residential segregation<br />
patterns. In a 2007 study <strong>of</strong> national<br />
levels <strong>of</strong> segregation <strong>in</strong> non-metropolitan<br />
areas, demographer Daniel Lichter<br />
<strong>and</strong> his colleagues 5 concluded that, despite<br />
very different histories, the patterns<br />
<strong>of</strong> segregation <strong>in</strong> small-town America<br />
were surpris<strong>in</strong>gly similar to those <strong>in</strong> metropolitan<br />
areas. The results for Ill<strong>in</strong>ois lead<br />
to a similar conclusion. Table 5 shows the<br />
12 non-metropolitan places <strong>in</strong> the state<br />
where there were sufficient African Americans<br />
for black-white segregation scores to<br />
be mean<strong>in</strong>gfully calculated. Well over half
<strong>Institute</strong> <strong>of</strong> Government & Public Affairs<br />
Table 5<br />
Nonmetropolitan Places: Black-White<br />
<strong>Segregation</strong><br />
Place Name<br />
Low <strong>Segregation</strong><br />
Medium <strong>Segregation</strong><br />
High <strong>Segregation</strong><br />
Dissimilarity<br />
Index, 2000<br />
Baldw<strong>in</strong> 34.9<br />
Mounds 49.7<br />
Ull<strong>in</strong> 52.7<br />
Carbondale 53.9<br />
Tamms 56.4<br />
Sparta 60.9<br />
Cairo 61.0<br />
Carrier Mills 61.8<br />
Freeport 62.3<br />
Mount Vernon 65.7<br />
Mound City 70.0<br />
Clayton 88.6<br />
Source: Figures derived from calculations based on the 2000<br />
census <strong>and</strong> provided by Pr<strong>of</strong>essor Domenico Parisi, Mississippi<br />
State University.<br />
Table 6<br />
Nonmetropolitan Places:<br />
Lat<strong>in</strong>o-White <strong>Segregation</strong><br />
Place Name<br />
Dissimilarity<br />
Index, 2000<br />
Hillcrest 31.1<br />
De Pue 38.4<br />
Cobden 38.5<br />
Rock Falls 41.2<br />
Onarga 44.6<br />
Sterl<strong>in</strong>g 44.7<br />
Mendota 49.4<br />
Rochelle 49.7<br />
Arcola 54.6<br />
Beardstown 59.4<br />
Low <strong>Segregation</strong><br />
Medium <strong>Segregation</strong><br />
High <strong>Segregation</strong><br />
Source: Figures derived from calculations based on the 2000<br />
census <strong>and</strong> provided by Pr<strong>of</strong>essor Domenico Parisi, Mississippi<br />
State University.<br />
There has been<br />
very little<br />
analysis <strong>of</strong><br />
rural <strong>and</strong><br />
small-town<br />
America’s<br />
residential<br />
segregation<br />
patterns.<br />
<strong>of</strong> these communities score “high” <strong>in</strong> their<br />
segregation levels; <strong>and</strong> just one – Baldw<strong>in</strong><br />
– scores <strong>in</strong> the “low” category. And the<br />
pattern that Lichter calls “black exceptionalism”<br />
perta<strong>in</strong>s to non-metropolitan segregation<br />
scores as well: <strong>of</strong> the 10 nonmetropolitan<br />
places for which we could<br />
calculate Lat<strong>in</strong>o-white segregation scores,<br />
shown <strong>in</strong> Table 6, there are none that are<br />
“highly” segregated, seven that are “moderately”<br />
segregated, <strong>and</strong> three that fall <strong>in</strong><br />
the “low” segregation category. Figure 3<br />
shows this pattern quite clearly.<br />
In summary, across the state we f<strong>in</strong>d that<br />
<strong>in</strong> all three types <strong>of</strong> places – Chicago metropolitan,<br />
non-Chicago metropolitan, <strong>and</strong><br />
non-metropolitan areas – the vast majority<br />
<strong>of</strong> communities are segregated at moderate<br />
to high levels. This is particularly the<br />
case for black-white segregation; roughly<br />
twice as many communities, across all<br />
three types, have “low” levels <strong>of</strong> Lat<strong>in</strong>owhite<br />
segregation as compared to blackwhite<br />
segregation. <strong>Segregation</strong> is not just a<br />
problem <strong>in</strong> the state’s largest metropolitan<br />
region <strong>of</strong> Chicago.<br />
Figure 3<br />
Non-Metropolitan Communities:<br />
Percent Distribution <strong>of</strong> Low,<br />
Moderate <strong>and</strong> High <strong>Segregation</strong><br />
Levels<br />
70<br />
60<br />
50<br />
40<br />
30<br />
20<br />
10<br />
0<br />
8<br />
30<br />
Low<br />
<strong>Segregation</strong><br />
33<br />
70<br />
Moderate<br />
<strong>Segregation</strong><br />
58<br />
Black-White <strong>Segregation</strong><br />
Lat<strong>in</strong>o-White <strong>Segregation</strong><br />
0<br />
High<br />
<strong>Segregation</strong><br />
Source: Figures derived from calculations based on the 2000<br />
census <strong>and</strong> provided by Pr<strong>of</strong>essor Domenico Parisi, Mississippi<br />
State University.<br />
39
The Ill<strong>in</strong>ois Report 2009<br />
Figure 4<br />
Percent <strong>of</strong> Persons Who Are Black/African American Alone<br />
<strong>in</strong> Ill<strong>in</strong>ois by County<br />
Overall, accord<strong>in</strong>g to the 2000 census, the<br />
state <strong>of</strong> Ill<strong>in</strong>ois is about 15 percent African<br />
American <strong>and</strong> 12 percent Lat<strong>in</strong>o. Inspection<br />
<strong>of</strong> Figures 4 <strong>and</strong> 5, which provide the<br />
percentage black <strong>and</strong> percentage Lat<strong>in</strong>o by<br />
county, reveals that African Americans <strong>and</strong><br />
Lat<strong>in</strong>os are not evenly distributed<br />
throughout the state <strong>of</strong> Ill<strong>in</strong>ois. Indeed,<br />
there are large swaths <strong>of</strong> the state where<br />
blacks <strong>and</strong> Lat<strong>in</strong>os simply do not reside.<br />
6<br />
This chapter does<br />
not discuss exclusionary<br />
policies applied<br />
to Lat<strong>in</strong>os<br />
because Loewen’s<br />
analysis focuses on<br />
the more common<br />
k<strong>in</strong>d <strong>of</strong> Sundown<br />
Town <strong>in</strong> the State <strong>of</strong><br />
Ill<strong>in</strong>ois – those targeted<br />
specifically at<br />
African Americans.<br />
7<br />
James W. Loewen.<br />
Sundown Towns: A<br />
Hidden Dimension <strong>of</strong><br />
American Racism<br />
(New York: Simon<br />
<strong>and</strong> Schuster, 2005):<br />
213-214.<br />
40<br />
0 - 1.0%<br />
1.1 - 8.0%<br />
8.1 - 18.2%<br />
18.3 - 34.9%<br />
Source: Census 2000 Summary File 1 (SF 1)<br />
100-Percent Data<br />
Equally strik<strong>in</strong>g, though, is that there are<br />
few non-metropolitan places that are at<br />
least 10 percent African American or 10<br />
percent Lat<strong>in</strong>o. This highlights an important<br />
observation about hous<strong>in</strong>g patterns <strong>in</strong><br />
Ill<strong>in</strong>ois: there are many communities (metropolitan<br />
<strong>and</strong> non-metropolitan alike) that<br />
have so few African American <strong>and</strong> Lat<strong>in</strong>o<br />
residents that it makes little sense to calculate<br />
levels <strong>of</strong> segregation with<strong>in</strong> them.<br />
What About Places That Are Not Diverse<br />
Looked at another way, we can calculate<br />
the percentage <strong>of</strong> Ill<strong>in</strong>ois residents who<br />
live <strong>in</strong> places with more than 500 residents<br />
<strong>and</strong> are either 10 percent or more African<br />
American or 10 percent or more Lat<strong>in</strong>o<br />
<strong>and</strong> are at least 10 percent white (the set <strong>of</strong><br />
places for which we present dissimilarity<br />
scores <strong>in</strong> Tables 1 through 6). Approximately<br />
40 percent <strong>of</strong> Ill<strong>in</strong>oisans who live <strong>in</strong><br />
census-def<strong>in</strong>ed places live <strong>in</strong> communities<br />
that do not meet these criteria. In other<br />
words, they live <strong>in</strong> places with very little<br />
racial/ethnic diversity. To a great extent,<br />
these are white Ill<strong>in</strong>ois residents liv<strong>in</strong>g <strong>in</strong><br />
overwhelm<strong>in</strong>gly white communities.<br />
The absence <strong>of</strong> African Americans from<br />
many places throughout Ill<strong>in</strong>ois is the<br />
topic <strong>of</strong> a recent major study by sociologist<br />
James Loewen (2005). 6 He argues that the<br />
reason there are few, if any, African Americans<br />
<strong>in</strong> any particular community is <strong>of</strong>ten<br />
not due to “natural” causes <strong>of</strong> demography,<br />
migration, or market forces. Rather, <strong>in</strong><br />
many cases, the absence <strong>of</strong> African Americans<br />
<strong>in</strong> a community is the result <strong>of</strong> formal<br />
<strong>and</strong> <strong>in</strong>formal policies, particularly dur<strong>in</strong>g<br />
the nadir <strong>of</strong> race relations: 1890-1940.<br />
These practices <strong>and</strong> policies drove out exist<strong>in</strong>g<br />
black residents <strong>and</strong>/or kept others<br />
from mov<strong>in</strong>g <strong>in</strong>to the town. Sundown<br />
Towns, as Loewen def<strong>in</strong>es them, are “any<br />
organized jurisdiction that for decades<br />
kept out African Americans (or others)” 7<br />
<strong>and</strong> are so-named for the policy <strong>of</strong> such<br />
communities: “No coloreds after dark.” In<br />
his meticulous research, Loewen used historical<br />
census data to identify suspected<br />
Sundown Towns, based on the presence<br />
<strong>and</strong> then absence <strong>of</strong> African Americans<br />
among their residents, <strong>and</strong> then conducted<br />
additional research through oral history,
<strong>Institute</strong> <strong>of</strong> Government & Public Affairs<br />
Figure 5<br />
Percent <strong>of</strong> Persons Who Are Lat<strong>in</strong>o (<strong>of</strong> Any Race): 2000<br />
newspapers <strong>of</strong> the past <strong>and</strong> present, local<br />
histories, <strong>and</strong> other sources. This was done<br />
to determ<strong>in</strong>e if towns with an all-white<br />
past were all-white on purpose. Loewen<br />
estimates that roughly 75 percent <strong>of</strong> Ill<strong>in</strong>ois<br />
towns were “Sundown” at some po<strong>in</strong>t <strong>in</strong><br />
their history.<br />
Based on census-data research, Loewen<br />
identified about 500 communities <strong>in</strong> Ill<strong>in</strong>ois<br />
as probable Sundown Towns. To date,<br />
he has done more detailed research <strong>in</strong>to<br />
219 <strong>of</strong> these 500 <strong>and</strong> concluded that 218<br />
could be confirmed as Sundown Towns.<br />
Sundown Towns, he f<strong>in</strong>ds, used a variety<br />
<strong>of</strong> tactics to secure their status as a whiteonly<br />
community. Perhaps the most visible<br />
<strong>of</strong> these tactics was violence.<br />
The 1908 riot <strong>in</strong> Spr<strong>in</strong>gfield is one such example.<br />
Ultimately this riot was unsuccessful<br />
at expell<strong>in</strong>g its black population, likely<br />
ow<strong>in</strong>g to at least three factors: the large<br />
black population; Spr<strong>in</strong>gfield’s status as<br />
the state capital; <strong>and</strong> that it was Abraham<br />
L<strong>in</strong>coln’s hometown. But the riot nevertheless<br />
had an effect on other communities <strong>in</strong><br />
Ill<strong>in</strong>ois. As Loewen expla<strong>in</strong>s,<br />
0.2 - 1.0%<br />
1.1 - 8.0%<br />
8.1 - 18.1%<br />
18.2 - 23.7%<br />
“The Spr<strong>in</strong>gfield riot st<strong>and</strong>s as a prototype<br />
for the many smaller riots that left<br />
communities all-white between 1890<br />
<strong>and</strong> 1940, most <strong>of</strong> which have never<br />
been written about by any historian. Indeed,<br />
the Spr<strong>in</strong>gfield riot itself spawned<br />
a host <strong>of</strong> imitators: whites shouted<br />
“Give ‘em Spr<strong>in</strong>gfield!” dur<strong>in</strong>g attacks<br />
on African Americans…the Ill<strong>in</strong>ois State<br />
Register reported, ‘At Auburn, Thayer,<br />
Virden, Girard, Pawnee, Spauld<strong>in</strong>g, Buffalo,<br />
Riverton, Pana, Ed<strong>in</strong>burg, Taylorville,<br />
Pleasant Pla<strong>in</strong>s <strong>and</strong> a score <strong>of</strong><br />
other places <strong>in</strong> central Ill<strong>in</strong>ois a Negro is<br />
an unwelcome visitor <strong>and</strong> is soon <strong>in</strong>formed<br />
he must not rema<strong>in</strong> <strong>in</strong> the<br />
town.’ Buffalo, a little town twelve miles<br />
east <strong>of</strong> Spr<strong>in</strong>gfield, became all-white on<br />
August 17, 1908, two days after the National<br />
Guard ended the Spr<strong>in</strong>gfield riot.<br />
Not to be outdone by Spr<strong>in</strong>gfield,<br />
Source: Census 2000 Summary File 1 (SF 1)<br />
100-Percent Data<br />
whites <strong>in</strong> Buffalo posted the follow<strong>in</strong>g<br />
ultimatum at the tra<strong>in</strong> station: ‘All<br />
N - - - - - - are warned out <strong>of</strong> town by<br />
Monday, 12m, sharp. Buffalo Sharp<br />
Shooters.’” 8<br />
Spr<strong>in</strong>gfield itself rema<strong>in</strong>ed highly segregated<br />
as <strong>of</strong> 2000. With an <strong>in</strong>dex <strong>of</strong> dissimilarity<br />
score <strong>of</strong> 64, it ranked seventh highest<br />
among non-Chicago area metropolitan<br />
communities.<br />
Some Sundown Towns that used violence<br />
to rema<strong>in</strong> all-white have overcome their<br />
past. To take one example, Oak Park was a<br />
Sundown Suburb <strong>in</strong> 1950, as is clear from<br />
the response to the arrival <strong>of</strong> the renowned<br />
8<br />
James W. Loewen.<br />
Sundown Towns: A<br />
Hidden Dimension <strong>of</strong><br />
American Racism<br />
(New York: Simon<br />
<strong>and</strong> Schuster, 2005):<br />
94-95.<br />
41
The Ill<strong>in</strong>ois Report 2009<br />
9<br />
James W. Loewen.<br />
Sundown Towns: A<br />
Hidden Dimension <strong>of</strong><br />
American Racism<br />
(New York: Simon<br />
<strong>and</strong> Schuster, 2005):<br />
128.<br />
10<br />
James W. Loewen.<br />
Sundown Towns: A<br />
Hidden Dimension <strong>of</strong><br />
American Racism<br />
(New York: Simon<br />
<strong>and</strong> Schuster, 2005):<br />
410.<br />
11<br />
James W. Loewen.<br />
Personal communication<br />
with the author,<br />
2008.<br />
42<br />
chemist Percy Julian <strong>and</strong> his wife, Anna<br />
Roselle Johnson, the first African American<br />
woman to earn a PhD <strong>in</strong> sociology. The<br />
water commissioner refused to turn on the<br />
water <strong>in</strong> their newly purchased 15-room<br />
house, they received threaten<strong>in</strong>g phone<br />
calls, <strong>and</strong> there was an attempt to burn<br />
their house down. 9 Today, Oak Park is a<br />
stably <strong>in</strong>tegrated community with a reputation<br />
for its commitment to diversity <strong>and</strong><br />
a range <strong>of</strong> hous<strong>in</strong>g-related programs <strong>in</strong>stituted<br />
to ensure its openness. In 2000, it<br />
was 22 percent African American <strong>and</strong> its<br />
<strong>in</strong>dex <strong>of</strong> dissimilarity reveals that it is<br />
“moderately” segregated; as <strong>of</strong> the 2000<br />
census, it ranked 33rd out <strong>of</strong> the 44<br />
Chicago metropolitan communities <strong>in</strong>cluded<br />
<strong>in</strong> Table 1.<br />
Violence was not the only strategy for creat<strong>in</strong>g<br />
<strong>and</strong> then ma<strong>in</strong>ta<strong>in</strong><strong>in</strong>g Sundown<br />
Towns. It is perhaps just the most visible –<br />
but no more or less successful than a myriad<br />
<strong>of</strong> other tactics that communities undertook<br />
to keep their towns white.<br />
Communities threatened violence on an<br />
entire group by lynch<strong>in</strong>g one <strong>of</strong> its members,<br />
thus encourag<strong>in</strong>g the departure <strong>of</strong> the<br />
group. Local ord<strong>in</strong>ances were passed prohibit<strong>in</strong>g<br />
African Americans from be<strong>in</strong>g <strong>in</strong><br />
town after sundown <strong>and</strong> whistles blew<br />
from places like the town’s water tower<br />
each day at 6 p.m. to warn blacks out <strong>of</strong><br />
town. Police chiefs escorted the wayward<br />
black traveler or would-be resident out <strong>of</strong><br />
town. Citizens used “freeze out” tactics,<br />
such as refus<strong>in</strong>g service to blacks <strong>in</strong> public<br />
sett<strong>in</strong>gs, not allow<strong>in</strong>g their children to play<br />
with black children, <strong>and</strong> not hir<strong>in</strong>g blacks<br />
as employees. African Americans who<br />
were liv<strong>in</strong>g <strong>in</strong> Sundown Towns would be<br />
bought out, or <strong>in</strong>dividuals wish<strong>in</strong>g to develop<br />
new suburbs would buy out black<br />
property owners <strong>in</strong> rural areas where they<br />
were locat<strong>in</strong>g their new – all white by design<br />
– communities. Suburbs <strong>in</strong> particular<br />
used restrictive deed covenants prohibit<strong>in</strong>g<br />
the sale <strong>of</strong> property to blacks <strong>and</strong> established<br />
private associations to permit<br />
exclusion <strong>of</strong> certa<strong>in</strong> group members.<br />
Loewen’s detailed analysis gives countless<br />
examples <strong>of</strong> these tactics used throughout<br />
Sundown Towns <strong>in</strong> Ill<strong>in</strong>ois <strong>and</strong> the rest <strong>of</strong><br />
the nation.<br />
While explicit Sundown Town policies<br />
have faded <strong>in</strong>to the past, <strong>in</strong>formal policies<br />
<strong>and</strong> persistent reputations <strong>of</strong> communities<br />
as unwelcom<strong>in</strong>g <strong>of</strong> African Americans<br />
mean that the consequences <strong>of</strong> these earlier<br />
policies <strong>and</strong> practices cont<strong>in</strong>ue. Although<br />
it is difficult to know for sure,<br />
Loewen estimates that about one-half <strong>of</strong><br />
confirmed Sundown Towns are no longer<br />
so, based on census data analysis <strong>and</strong><br />
other research <strong>in</strong>dicat<strong>in</strong>g that the communities<br />
have shed their past status. 10 This<br />
means, <strong>of</strong> course, that about one-half <strong>of</strong><br />
them still are.<br />
A Side Note<br />
We take a brief detour at this po<strong>in</strong>t to identify<br />
a particularly troubl<strong>in</strong>g k<strong>in</strong>d <strong>of</strong> residential<br />
segregation; a situation where the<br />
black population <strong>in</strong> a community is literally<br />
conf<strong>in</strong>ed. Loewen has identified a<br />
number <strong>of</strong> communities <strong>in</strong> Ill<strong>in</strong>ois that<br />
have Sundown Town pasts (<strong>and</strong> perhaps<br />
presents) that now house state correctional<br />
<strong>in</strong>stitutions. 11 There are many <strong>in</strong>stances<br />
where the census reports a sizeable black<br />
population <strong>in</strong> a particular community, but<br />
closer <strong>in</strong>spection reveals that only a small<br />
number <strong>of</strong> householders are black. Instead,<br />
the vast majority <strong>of</strong> the black population<br />
enumerated <strong>in</strong> the census is actually<br />
housed <strong>in</strong> a prison. For example, the town<br />
<strong>of</strong> Ina, accord<strong>in</strong>g to the 2000 census, had<br />
1,027 black residents; but all except two<br />
were liv<strong>in</strong>g <strong>in</strong> the Big Muddy River Correctional<br />
Facility. Accord<strong>in</strong>g to Loewen,<br />
there are n<strong>in</strong>e federal or state correctional<br />
facilities <strong>in</strong> confirmed Sundown Towns<br />
<strong>and</strong> Counties <strong>in</strong> Ill<strong>in</strong>ois, <strong>and</strong> another four<br />
<strong>in</strong> suspected Sundown Towns. As Loewen<br />
argues, the k<strong>in</strong>d <strong>of</strong> black-white contact created<br />
<strong>in</strong> such sett<strong>in</strong>gs is hardly conducive to<br />
build<strong>in</strong>g trust between blacks <strong>and</strong> whites,<br />
<strong>and</strong> the geographic <strong>and</strong> sociological dis-
<strong>Institute</strong> <strong>of</strong> Government & Public Affairs<br />
tance between home <strong>and</strong> the prison makes<br />
it hard for prisoners to ma<strong>in</strong>ta<strong>in</strong> ties with<br />
their families <strong>and</strong> makes it harder for families<br />
to visit. Loewen describes the thoughts<br />
<strong>of</strong> a resident <strong>of</strong> a Sundown Town that got a<br />
prison <strong>in</strong> 1970, as an illustration <strong>of</strong> how<br />
such a situation fosters stereotypes <strong>and</strong><br />
negative racial attitudes: “S<strong>in</strong>ce that time,<br />
you get constant remarks about black people<br />
<strong>and</strong> how bad they are. Of course, [prisoners]<br />
are the only black people they<br />
know.”<br />
Contemporary Causes <strong>of</strong> <strong>Racial</strong> <strong>Residential</strong><br />
<strong>Segregation</strong><br />
The very existence <strong>of</strong> Sundown Towns, as<br />
Loewen notes, is a feature <strong>of</strong> Ill<strong>in</strong>ois <strong>and</strong><br />
American history that is “hidden <strong>in</strong> pla<strong>in</strong><br />
sight.” Citizens <strong>and</strong> researchers <strong>of</strong>ten fail<br />
to recognize how <strong>and</strong> why all-white communities<br />
have come to pass. If they notice<br />
them at all, they are <strong>of</strong>ten viewed as a<br />
“natural” outcome <strong>of</strong> market forces <strong>and</strong><br />
personal choices about where different<br />
racial groups “prefer” to live. Loewen’s<br />
analysis is a rem<strong>in</strong>der <strong>of</strong> how this history<br />
<strong>of</strong> creat<strong>in</strong>g all-white communities sets the<br />
stage for patterns <strong>of</strong> segregation across the<br />
state <strong>of</strong> Ill<strong>in</strong>ois. It is aga<strong>in</strong>st this historical<br />
backdrop that we turn now to the question<br />
<strong>of</strong> how <strong>and</strong> why racial residential segregation<br />
persists <strong>in</strong>to the contemporary era –<br />
40 years after the 1968 Fair Hous<strong>in</strong>g Act<br />
declared discrim<strong>in</strong>ation on the basis <strong>of</strong><br />
race <strong>in</strong> the sale <strong>and</strong> rental <strong>of</strong> hous<strong>in</strong>g to be<br />
illegal.<br />
Much <strong>of</strong> the scholarly research on segregation<br />
until recently has focused on metropolitan<br />
areas – places where blacks <strong>and</strong><br />
Lat<strong>in</strong>os are not excluded from so much as<br />
they are segregated with<strong>in</strong>. The historical<br />
role <strong>of</strong> local, state <strong>and</strong> federal governments<br />
<strong>in</strong> creat<strong>in</strong>g segregation with<strong>in</strong> any particular<br />
community or region is undeniable –<br />
from restrictive zon<strong>in</strong>g ord<strong>in</strong>ances to the<br />
federal government’s policies on public<br />
hous<strong>in</strong>g, transportation, <strong>and</strong> redl<strong>in</strong><strong>in</strong>g <strong>in</strong><br />
home loan programs 12 – public policies exacerbated<br />
the private actions <strong>of</strong> white residents,<br />
neighborhood associations, <strong>and</strong> the<br />
real estate <strong>in</strong>dustry who engaged <strong>in</strong> tactics<br />
rang<strong>in</strong>g from <strong>in</strong>timidation to protests to restrictive<br />
covenants. 13<br />
Set aga<strong>in</strong>st this historical backdrop, there<br />
are generally three explanations <strong>of</strong>fered for<br />
the persistence <strong>of</strong> racial residential segregation:<br />
discrim<strong>in</strong>ation, economics, <strong>and</strong><br />
preferences. The first is that despite be<strong>in</strong>g<br />
made illegal <strong>in</strong> 1968, racial discrim<strong>in</strong>ation<br />
<strong>in</strong> hous<strong>in</strong>g cont<strong>in</strong>ues to exist, <strong>and</strong> has the<br />
effect <strong>of</strong> barr<strong>in</strong>g racial m<strong>in</strong>orities from access<strong>in</strong>g<br />
some neighborhoods. The best evidence<br />
available <strong>in</strong>dicates that<br />
discrim<strong>in</strong>ation <strong>in</strong> the hous<strong>in</strong>g market persists,<br />
although <strong>of</strong>ten <strong>in</strong> more subtle <strong>and</strong><br />
complex ways than <strong>in</strong> the past. In the current<br />
era, it may <strong>of</strong>ten be the case that victims<br />
are not even aware that they have<br />
been discrim<strong>in</strong>ated aga<strong>in</strong>st. It is less that<br />
the door is slammed <strong>in</strong> the face <strong>of</strong> m<strong>in</strong>ority<br />
homeseekers <strong>and</strong> more that phone calls are<br />
not returned, fewer options are <strong>of</strong>fered,<br />
less help is given, less enthusiastic followup<br />
is provided, more hurdles are placed <strong>in</strong><br />
their path, they are given fewer options,<br />
<strong>and</strong> they are steered to communities where<br />
their own group dom<strong>in</strong>ates. 14 In the most<br />
recent nationwide audit-study 15 <strong>of</strong> hous<strong>in</strong>g<br />
discrim<strong>in</strong>ation, the U.S. Department <strong>of</strong><br />
Hous<strong>in</strong>g <strong>and</strong> Urban Development found<br />
that African Americans <strong>and</strong> Lat<strong>in</strong>os face<br />
significant discrim<strong>in</strong>ation <strong>in</strong> hous<strong>in</strong>g,<br />
The best<br />
evidence<br />
available<br />
<strong>in</strong>dicates that<br />
discrim<strong>in</strong>ation<br />
<strong>in</strong> the hous<strong>in</strong>g<br />
market<br />
persists,<br />
although <strong>of</strong>ten<br />
<strong>in</strong> more subtle<br />
<strong>and</strong> complex<br />
ways than <strong>in</strong><br />
the past.<br />
12<br />
James H. Carr <strong>and</strong> N<strong>and</strong><strong>in</strong>ee K. Kutty, eds. <strong>Segregation</strong>: The Ris<strong>in</strong>g Costs for America<br />
(New York: Routledge, 2008).<br />
13<br />
Stephen Grant Meyer. As Long as They Don’t Move Next Door: <strong>Segregation</strong> <strong>and</strong> <strong>Racial</strong><br />
Conflict <strong>in</strong> American Neighborhoods (Lanham, MD: Rowman <strong>and</strong> Littlefield, 2000).<br />
14<br />
Margery Turner <strong>and</strong> Stephen L. Ross. “How <strong>Racial</strong> Discrim<strong>in</strong>ation Affects the Search<br />
for Hous<strong>in</strong>g,” <strong>in</strong> Xavier de Souza Briggs, ed., The Geography <strong>of</strong> Opportunity: Race <strong>and</strong><br />
Hous<strong>in</strong>g Choice <strong>in</strong> Metropolitan America (Wash<strong>in</strong>gton, DC: Brook<strong>in</strong>gs Institution,<br />
2005).<br />
15<br />
An audit study is conducted by match<strong>in</strong>g two homeseekers on a range <strong>of</strong> characteristics,<br />
with the only difference be<strong>in</strong>g their race/ethnicity. Each <strong>of</strong> the homeseekers<br />
approaches a real estate agent/l<strong>and</strong>lord, express<strong>in</strong>g an <strong>in</strong>terest <strong>in</strong> rent<strong>in</strong>g/<br />
purchas<strong>in</strong>g a home. Detailed records are taken on how the auditors are treated by<br />
the real estate pr<strong>of</strong>essionals. In cases where the white auditor is treated more favorably<br />
than the black <strong>and</strong>/or Lat<strong>in</strong>o auditor, discrim<strong>in</strong>ation on the basis <strong>of</strong> race/ethnicity<br />
is <strong>in</strong> evidence.<br />
43
16<br />
Kathleen C. Engel<br />
<strong>and</strong> Patricia McCoy.<br />
“From Credit Denial<br />
to Predatory Lend<strong>in</strong>g:<br />
The Challenge<br />
<strong>of</strong> Susta<strong>in</strong><strong>in</strong>g M<strong>in</strong>ority<br />
Homeownership,”<br />
<strong>in</strong> James H.<br />
Carr <strong>and</strong> N<strong>and</strong><strong>in</strong>ee<br />
K. Kutty, eds., <strong>Segregation</strong>:<br />
The Ris<strong>in</strong>g<br />
Costs for America<br />
(New York: Routledge,<br />
2008); Gregory<br />
D. Squires <strong>and</strong><br />
Charis E. Kubr<strong>in</strong>.<br />
Privileged Places:<br />
Race, Residence, <strong>and</strong><br />
the Structure <strong>of</strong> Opportunity<br />
(Boulder,<br />
CO: Lynne Reimer<br />
Publishers, 2006).<br />
17<br />
Tyrone Forman <strong>and</strong><br />
Maria Krysan.<br />
“<strong>Racial</strong> <strong>Segregation</strong><br />
<strong>in</strong> Metropolitan<br />
Chicago Hous<strong>in</strong>g.”<br />
Policy Forum 20(3),<br />
(<strong>Institute</strong> <strong>of</strong> Government<br />
<strong>and</strong> Public<br />
Affairs, 2008).<br />
18<br />
Ingrid Gould Ellen.<br />
Shar<strong>in</strong>g America’s<br />
Neighborhoods: The<br />
Prospects for Stable<br />
<strong>Racial</strong> Integration<br />
(Cambridge, MA:<br />
Harvard University<br />
Press, 2000); Camille<br />
Zubr<strong>in</strong>sky Charles.<br />
Won’t You Be My<br />
Neighbor Race,<br />
Class, <strong>and</strong> Residence<br />
<strong>in</strong> Los Angeles (New<br />
York: Russell Sage<br />
Foundation, 2006);<br />
<strong>and</strong> Reynolds Farley<br />
et al. “Stereotypes<br />
<strong>and</strong> <strong>Segregation</strong>:<br />
Neighborhoods <strong>in</strong><br />
the Detroit Area.”<br />
American Journal <strong>of</strong><br />
Sociology 100(3)<br />
(1994): 750-780.<br />
19<br />
Ingrid Gould Ellen.<br />
Shar<strong>in</strong>g America’s<br />
Neighborhoods: The<br />
Prospects for Stable<br />
<strong>Racial</strong> Integration<br />
(Cambridge, MA:<br />
Harvard University<br />
Press, 2000).<br />
20<br />
James W. Loewen.<br />
Personal communication<br />
with the author,<br />
2008.<br />
44<br />
although levels had decl<strong>in</strong>ed somewhat<br />
s<strong>in</strong>ce 1989. But they also reported that<br />
racial steer<strong>in</strong>g – the act <strong>of</strong> show<strong>in</strong>g m<strong>in</strong>ority<br />
clients neighborhoods where their<br />
group predom<strong>in</strong>ates, while show<strong>in</strong>g white<br />
clients only predom<strong>in</strong>ately white neighborhoods<br />
– had <strong>in</strong>creased. Studies <strong>of</strong> the<br />
mortgage <strong>in</strong>dustry also suggest that m<strong>in</strong>orities<br />
are more likely to be denied a<br />
home loan <strong>and</strong> also more likely to be <strong>of</strong>fered<br />
only sub-prime loan products, to be<br />
the victims <strong>of</strong> predatory lend<strong>in</strong>g practices,<br />
<strong>and</strong> to face more difficulties <strong>and</strong> more expense<br />
<strong>in</strong> secur<strong>in</strong>g property <strong>in</strong>surance. 16<br />
The Ill<strong>in</strong>ois Report 2009<br />
A second explanation for the persistence <strong>of</strong><br />
racial residential segregation is that people<br />
prefer it that way; put simply, if blacks,<br />
whites <strong>and</strong> Lat<strong>in</strong>os live <strong>in</strong> different areas, it<br />
is because they want it that way. Studies<br />
generally show that whites <strong>and</strong> African<br />
Americans hold <strong>in</strong>compatible preferences<br />
about the racial composition <strong>of</strong> the neighborhoods<br />
they would like to live <strong>in</strong>.<br />
Whites want relatively few African Americans<br />
<strong>in</strong> their neighborhood while African<br />
Americans prefer a more even mix <strong>of</strong><br />
whites <strong>and</strong> blacks. But it is problematic to<br />
construe these k<strong>in</strong>ds <strong>of</strong> preferences as reflections<br />
<strong>of</strong> “personal choices” that are benign<br />
<strong>and</strong> neutral. Indeed, much research<br />
demonstrates that preferences are not<br />
“neutral” <strong>and</strong> “unproblematic” but rather<br />
constra<strong>in</strong>ed <strong>and</strong> complicated. For example,<br />
one study shows that to describe African<br />
American racial residential preferences as<br />
for “50-50” or majority-m<strong>in</strong>ority neighborhoods<br />
<strong>and</strong> to then conclude, as some have,<br />
that segregation is caused by m<strong>in</strong>ority<br />
preferences, is problematic. Indeed, if we<br />
look more <strong>in</strong>-depth at African American<br />
preferences us<strong>in</strong>g different methods, we<br />
f<strong>in</strong>d that they are far from “segregation<br />
promot<strong>in</strong>g.” In a recent study <strong>in</strong> the<br />
Chicago metropolitan area, 17 we f<strong>in</strong>d that<br />
81 percent <strong>of</strong> African Americans who have<br />
searched for hous<strong>in</strong>g <strong>in</strong> the last 10 years<br />
had among their search locations at least<br />
one community where blacks were <strong>in</strong> the<br />
m<strong>in</strong>ority. This is compared to just 25 percent<br />
<strong>of</strong> whites who searched <strong>in</strong> a community<br />
where whites were <strong>in</strong> the m<strong>in</strong>ority.<br />
And, by ask<strong>in</strong>g why African Americans<br />
hold the preferences they do, we discover<br />
that it is less because <strong>of</strong> a “neutral” <strong>in</strong>group<br />
preference <strong>and</strong> more because <strong>of</strong> a<br />
desire to avoid discrim<strong>in</strong>ation <strong>in</strong> largely<br />
white communities. Furthermore, white<br />
preferences for white communities are not<br />
shaped by neutral forces but <strong>in</strong>stead by<br />
racial stereotypes about blacks <strong>and</strong> neighborhoods<br />
that have black residents <strong>in</strong><br />
them. 18<br />
The third explanation for segregation is arguably<br />
the one that most citizens prescribe<br />
to: money talks <strong>and</strong> so the reason blacks,<br />
whites <strong>and</strong> Lat<strong>in</strong>os live <strong>in</strong> different neighborhoods<br />
is because people live where<br />
they can afford to live. Ow<strong>in</strong>g to the economic<br />
segregation <strong>of</strong> many American<br />
cities, it is “natural” that we have racial<br />
residential segregation so long as we cont<strong>in</strong>ue<br />
to have racial economic <strong>in</strong>equality.<br />
But despite the <strong>in</strong>tuitive appeal <strong>of</strong> this argument,<br />
as Ingrid Ellen concludes, “virtually<br />
every study that has exam<strong>in</strong>ed the role<br />
<strong>of</strong> <strong>in</strong>come differences <strong>in</strong> driv<strong>in</strong>g segregation<br />
has found that <strong>in</strong>come differences between<br />
blacks <strong>and</strong> whites account for only a<br />
modest share <strong>of</strong> segregation patterns.” 19<br />
Apart from these three ma<strong>in</strong> explanations<br />
for segregation, we also <strong>in</strong>clude <strong>in</strong> this discussion<br />
some attempt to underst<strong>and</strong> why<br />
Sundown Towns cont<strong>in</strong>ue to be all white –<br />
even <strong>in</strong> those cases where the policies, practices<br />
<strong>and</strong> tactics are a th<strong>in</strong>g <strong>of</strong> the past.<br />
Loewen suggests that the persistence <strong>of</strong><br />
racial exclusion <strong>in</strong> these communities<br />
comes from the “upstream” <strong>and</strong> the “downstream.”<br />
20 From the upstream, while there<br />
may be will<strong>in</strong>gness on the part <strong>of</strong> a community<br />
to rent or sell to African Americans,<br />
“… precisely ow<strong>in</strong>g to that racial past,<br />
few African Americans may seek hous<strong>in</strong>g<br />
<strong>in</strong> the community. The town or<br />
county has built a reputation as an entity,<br />
based on policies <strong>and</strong> <strong>in</strong>cidents
<strong>Institute</strong> <strong>of</strong> Government & Public Affairs<br />
stretch<strong>in</strong>g back for decades. It is not<br />
easy for acts by <strong>in</strong>dividuals to undo this<br />
corporate character. Indeed, the town’s<br />
actions as an entity, along with the reputations<br />
that have built up, may preclude<br />
the possibility <strong>of</strong> nondiscrim<strong>in</strong>atory acts<br />
by <strong>in</strong>dividual would-be sellers or<br />
renters.”<br />
In other words, communities have reputations,<br />
<strong>and</strong> the degree to which the reputation<br />
– <strong>and</strong> possibly the reality – <strong>of</strong> a<br />
community is unwelcom<strong>in</strong>g to certa<strong>in</strong><br />
groups <strong>of</strong> people raises a barrier to members<br />
<strong>of</strong> that group even attempt<strong>in</strong>g to<br />
search for hous<strong>in</strong>g. Related to this, communities<br />
may simply be unknown among<br />
certa<strong>in</strong> racial/ethnic groups. If the knowledge<br />
residents <strong>of</strong> different backgrounds<br />
have about a community is shaped by the<br />
composition <strong>of</strong> that community, then these<br />
patterns <strong>of</strong> knowledge – or the lack <strong>of</strong><br />
knowledge – may constitute an important<br />
barrier to <strong>in</strong>tegrated liv<strong>in</strong>g. It is difficult to<br />
move <strong>in</strong>to a neighborhood if you don’t<br />
know anyth<strong>in</strong>g about it.<br />
In a survey <strong>of</strong> Chicago residents, we found<br />
that whites, blacks <strong>and</strong> Lat<strong>in</strong>os all tend to<br />
know more about communities <strong>in</strong> which<br />
their co-ethnics live. 21 But African Americans<br />
<strong>and</strong> Lat<strong>in</strong>os, relative to whites, know<br />
about a broader range <strong>of</strong> communities –<br />
racially mixed <strong>and</strong> racially segregated<br />
alike. For African Americans <strong>and</strong> Lat<strong>in</strong>os,<br />
the few “bl<strong>in</strong>d spots” are communities that<br />
are both predom<strong>in</strong>ately white <strong>and</strong> geographically<br />
distant from the city, thus creat<strong>in</strong>g<br />
a barrier to the possible <strong>in</strong>tegration<br />
<strong>of</strong> communities like this. But there are<br />
plenty <strong>of</strong> predom<strong>in</strong>ately white communities<br />
about which African Americans do not<br />
have a bl<strong>in</strong>d spot relative to whites; as<br />
such, there are clearly other barriers, perhaps<br />
discrim<strong>in</strong>ation or perhaps “negative”<br />
knowledge about how African Americans<br />
are treated <strong>in</strong> these communities. For their<br />
part, whites are far less likely than Lat<strong>in</strong>os<br />
or African Americans to know about heavily<br />
African American communities. And<br />
what is troubl<strong>in</strong>g for the encouragement <strong>of</strong><br />
<strong>in</strong>tegration is that whites’ bl<strong>in</strong>d spots also<br />
<strong>in</strong>clude communities that are racially<br />
mixed (either with Lat<strong>in</strong>os or African<br />
Americans) – even those where whites are<br />
<strong>in</strong> the majority.<br />
From the “downstream,” once a m<strong>in</strong>ority<br />
person decides to make a home <strong>in</strong> a former<br />
Sundown Town, there may be acts <strong>of</strong> harassment<br />
<strong>and</strong> unwelcom<strong>in</strong>g behavior that<br />
make life difficult; <strong>and</strong> aga<strong>in</strong>, ow<strong>in</strong>g to its<br />
past, there may be unstated policies that<br />
black newcomers should be challenged by<br />
authorities because they “don’t belong.” 22<br />
This k<strong>in</strong>d <strong>of</strong> harassment may result <strong>in</strong> the<br />
first black pioneers not stay<strong>in</strong>g <strong>in</strong> the community.<br />
Thus discrim<strong>in</strong>ation <strong>and</strong> preferences<br />
are <strong>in</strong>extricably l<strong>in</strong>ked: blacks’<br />
reluctance to enter communities or neighborhoods<br />
that have a reputation for hostility<br />
toward blacks can hardly be constructed<br />
as a free choice. And it is the choices <strong>of</strong><br />
whites to cont<strong>in</strong>ue to move <strong>in</strong>to all-white<br />
communities that must be equally understood<br />
as problematic. The most recent research<br />
shows that it is less the case that<br />
whites move out <strong>of</strong> neighborhoods that become<br />
diverse, which was more common <strong>in</strong><br />
the heyday <strong>of</strong> “white flight,” but it is the<br />
case that when they choose where to move,<br />
they choose to move <strong>in</strong>to whiter neighborhoods.<br />
23 Given the regularly high levels <strong>of</strong><br />
mobility, these <strong>in</strong>dividual choices, <strong>in</strong> the<br />
aggregate, mean that whites do little to<br />
overcome the persistence <strong>of</strong> overwhelm<strong>in</strong>gly<br />
white communities.<br />
F<strong>in</strong>ally, as noted previously, there has been<br />
little research that exam<strong>in</strong>es the causes <strong>of</strong><br />
segregation <strong>in</strong> rural <strong>and</strong> small-town America.<br />
In the most detailed analysis on this<br />
topic, Daniel Lichter <strong>and</strong> his colleagues<br />
conclude that there are substantial parallels<br />
between patterns <strong>in</strong> metropolitan <strong>and</strong><br />
nonmetropolitan areas:<br />
“<strong>Racial</strong> residential segregation <strong>in</strong> rural<br />
places <strong>in</strong>creases with grow<strong>in</strong>g m<strong>in</strong>ority<br />
percentage shares <strong>and</strong> is typically lower<br />
<strong>in</strong> “newer” places (as measured by<br />
21<br />
Maria Krysan.<br />
“<strong>Racial</strong> Bl<strong>in</strong>d Spots:<br />
A Barrier to Integrated<br />
Communities<br />
<strong>in</strong> Chicago.”<br />
Critical Issues Paper,<br />
(<strong>Institute</strong> <strong>of</strong> Government<br />
<strong>and</strong> Public<br />
Affairs, 2008).<br />
22<br />
James W. Loewen.<br />
Personal communication<br />
with the author,<br />
2008.<br />
23<br />
Ingrid Gould Ellen.<br />
“Cont<strong>in</strong>u<strong>in</strong>g Isolation:<br />
<strong>Segregation</strong> <strong>in</strong><br />
America Today” <strong>in</strong><br />
James H. Carr <strong>and</strong><br />
N<strong>and</strong><strong>in</strong>ee K. Kutty,<br />
eds., <strong>Segregation</strong>:<br />
The Ris<strong>in</strong>g Costs for<br />
America (New York:<br />
Routledge, 2008).<br />
45
The Ill<strong>in</strong>ois Report 2009<br />
<strong>Segregation</strong><br />
also takes its<br />
toll on the<br />
political,<br />
economic, <strong>and</strong><br />
social vitality<br />
<strong>of</strong> entire<br />
regions.<br />
growth <strong>in</strong> the hous<strong>in</strong>g stock), while<br />
racially selective annexation <strong>and</strong> the implied<br />
“racial threat” at the periphery exacerbate<br />
racial segregation <strong>in</strong> rural<br />
places.” 24<br />
24<br />
Daniel T. Lichter et al. “National Estimates <strong>of</strong> <strong>Racial</strong> <strong>Segregation</strong> <strong>in</strong> Rural <strong>and</strong> Small-<br />
Town America.” Demography 44(3) (2007): 563.<br />
25<br />
Richard Alba, John R. Logan, <strong>and</strong> Brian Stults. “The Chang<strong>in</strong>g Neighborhood<br />
Context <strong>of</strong> the Immigrant Metropolis,” Social Forces 79 (2000): 587-621.<br />
26<br />
Camille Zubr<strong>in</strong>sky Charles. Won’t You Be My Neighbor Race, Class, <strong>and</strong> Residence <strong>in</strong><br />
Los Angeles (New York: Russell Sage Foundation (2006).<br />
27<br />
For examples <strong>of</strong> many <strong>of</strong> these, see the recent edited volume, <strong>Segregation</strong>: The<br />
Ris<strong>in</strong>g Costs for America (Carr <strong>and</strong> Kutty, 2008).<br />
28<br />
Melv<strong>in</strong> L. Oliver <strong>and</strong> Thomas M. Shapiro. Black Wealth/White Wealth: A New<br />
Perspective on <strong>Racial</strong> Inequality (New York: Routledge, 1995).<br />
29<br />
James H. Carr <strong>and</strong> N<strong>and</strong><strong>in</strong>ee K. Kutty, eds. <strong>Segregation</strong>: The Ris<strong>in</strong>g Costs for America<br />
(New York: Routledge, 2008); Melv<strong>in</strong> L. Oliver <strong>and</strong> Thomas M. Shapiro. Black<br />
Wealth/White Wealth: A New Perspective on <strong>Racial</strong> Inequality (New York: Routledge,<br />
1995).<br />
46<br />
We focus our discussion on the causes <strong>and</strong><br />
consequences <strong>of</strong> segregation more heavily<br />
on African Americans than Lat<strong>in</strong>os because<br />
there is substantially less research that exam<strong>in</strong>es<br />
Lat<strong>in</strong>o-white segregation. A few<br />
patterns are noteworthy. First, although<br />
there is some evidence that Lat<strong>in</strong>o-white<br />
segregation may be <strong>in</strong>creas<strong>in</strong>g, it is still the<br />
case that Lat<strong>in</strong>o-white segregation is far<br />
lower than black-white segregation. Second,<br />
while racial/ethnic differences <strong>in</strong> economic<br />
background expla<strong>in</strong> only a small<br />
fraction <strong>of</strong> black-white segregation patterns,<br />
the same is not true for Lat<strong>in</strong>o-white<br />
segregation. As Lat<strong>in</strong>os climb the economic<br />
ladder they become more residentially <strong>in</strong>tegrated<br />
with whites, to a much greater degree<br />
than is true <strong>of</strong> blacks. It is also the case<br />
that the longer Lat<strong>in</strong>os have been <strong>in</strong> the<br />
United States, the less segregated they<br />
are. 25 From the st<strong>and</strong>po<strong>in</strong>t <strong>of</strong> preferences, it<br />
is generally reported that white attitudes<br />
toward liv<strong>in</strong>g with African Americans are<br />
more negative than toward liv<strong>in</strong>g with<br />
Lat<strong>in</strong>os. In other words, black “exceptionalism”<br />
holds for preferences for racial <strong>in</strong>tegration;<br />
from the st<strong>and</strong>po<strong>in</strong>t <strong>of</strong> whites,<br />
blacks are the least desirable neighbors followed<br />
by Lat<strong>in</strong>os <strong>and</strong> then Asians. 26<br />
Consequences <strong>of</strong> <strong>Segregation</strong><br />
<strong>Racial</strong> residential segregation has been described<br />
as the “structural lynchp<strong>in</strong>” <strong>of</strong> racial<br />
<strong>in</strong>equality <strong>in</strong> America. Because so much <strong>of</strong><br />
what happens to a person is driven by<br />
where they live – th<strong>in</strong>gs like where they go<br />
to school, what services they receive, <strong>and</strong><br />
their access to transportation, medical services<br />
<strong>and</strong> employment opportunities – racial<br />
residential segregation is implicated <strong>in</strong> persistent<br />
racial <strong>in</strong>equalities. Numerous studies<br />
have documented the deleterious<br />
consequences <strong>of</strong> residential segregation for<br />
outcomes among blacks <strong>in</strong>clud<strong>in</strong>g <strong>in</strong>fant<br />
<strong>and</strong> adult mortality, educational atta<strong>in</strong>ment,<br />
employment, death rates from homicide,<br />
rates <strong>of</strong> s<strong>in</strong>gle motherhood, <strong>and</strong> the accumulation<br />
<strong>of</strong> equity <strong>in</strong> homes. Others have<br />
po<strong>in</strong>ted out the effects <strong>of</strong> segregation on the<br />
quality <strong>of</strong> schools, employment opportunities,<br />
health <strong>and</strong> personal networks, <strong>and</strong> access<br />
to social resources. 27<br />
Recently, attention has been paid not only<br />
to how economics <strong>in</strong>fluence where people<br />
live, but also how where people live shapes<br />
their economic outcome. Researchers<br />
Melv<strong>in</strong> Oliver <strong>and</strong> Thomas Shapiro make<br />
the po<strong>in</strong>t that while <strong>in</strong>come <strong>in</strong>equality between<br />
blacks <strong>and</strong> whites may have reduced<br />
somewhat, there are tremendous disparities<br />
<strong>in</strong> black-white wealth: for every $1 <strong>in</strong><br />
wealth held by a black household, white<br />
households have $12. 28 Because homeownership<br />
is the most common form <strong>of</strong> wealth<br />
accumulation <strong>in</strong> the United States, the discrim<strong>in</strong>ation<br />
faced by blacks <strong>in</strong> terms <strong>of</strong> access<br />
to homeownership <strong>and</strong> the<br />
consequences <strong>of</strong> segregation on the value <strong>of</strong><br />
properties that blacks do own, there have<br />
been deep <strong>in</strong>equities <strong>in</strong> the accumulation <strong>of</strong><br />
wealth between whites <strong>and</strong> blacks. Wealth,<br />
<strong>in</strong> turn, affects a range <strong>of</strong> outcomes for m<strong>in</strong>orities,<br />
for example, a family’s ability to<br />
fund their children’s college education. 29
<strong>Institute</strong> <strong>of</strong> Government & Public Affairs<br />
From the st<strong>and</strong>po<strong>in</strong>t <strong>of</strong> race relations, segregated<br />
neighborhoods do little to help<br />
break down racial tensions <strong>and</strong> negative attitudes.<br />
30 Social scientists have shown that<br />
contact between groups is an important<br />
way to reduce negative <strong>in</strong>ter-group attitudes.<br />
But this contact must feature (1)<br />
equal group status; (2) common goals; (3)<br />
<strong>in</strong>ter-group cooperation; (4) authority support;<br />
<strong>and</strong> (5) friendship potential. 31 Liv<strong>in</strong>g<br />
side-by-side <strong>and</strong> work<strong>in</strong>g to solve neighborhood<br />
problems <strong>and</strong> build community is<br />
one context <strong>in</strong> which these conditions<br />
could be met. And failure to do so means<br />
that there are few opportunities for people<br />
<strong>of</strong> all races <strong>and</strong> ethnicities to <strong>in</strong>teract <strong>in</strong> a<br />
way that breaks down negative stereotypes.<br />
32 By liv<strong>in</strong>g <strong>in</strong> segregated neighborhoods<br />
<strong>and</strong> Sundown Towns, we are<br />
miss<strong>in</strong>g an opportunity to cultivate more<br />
positive race/ethnic relations. <strong>Segregation</strong><br />
also takes its toll on the political, economic,<br />
<strong>and</strong> social vitality <strong>of</strong> entire regions. 33<br />
Dismantl<strong>in</strong>g Patterns <strong>of</strong> <strong>Segregation</strong> <strong>and</strong><br />
<strong>Exclusion</strong><br />
There is no panacea for reduc<strong>in</strong>g the levels<br />
<strong>of</strong> segregation <strong>and</strong> exclusion that exist<br />
throughout communities <strong>in</strong> Ill<strong>in</strong>ois. The<br />
causes <strong>of</strong> segregation, as outl<strong>in</strong>ed above,<br />
are complex <strong>and</strong> <strong>in</strong>ter-related, mak<strong>in</strong>g it<br />
difficult to po<strong>in</strong>t a f<strong>in</strong>ger at one cause <strong>and</strong><br />
imag<strong>in</strong>e solv<strong>in</strong>g the problem with a s<strong>in</strong>gle<br />
remedy. Based on the discussion above,<br />
however, several areas are worthy <strong>of</strong><br />
attention.<br />
Despite the passage <strong>of</strong> the Fair Hous<strong>in</strong>g<br />
Act <strong>of</strong> 1968, there rema<strong>in</strong>s substantial evidence<br />
<strong>of</strong> persistent hous<strong>in</strong>g discrim<strong>in</strong>ation.<br />
As Carr <strong>and</strong> Kutty observe, “HUD’s enforcement<br />
powers have for various reasons<br />
largely rema<strong>in</strong>ed underutilized. In 2003,<br />
HUD brought only four racial discrim<strong>in</strong>ation<br />
cases, although it had received more<br />
than 2,700 compla<strong>in</strong>ts that year.” Support<br />
for test<strong>in</strong>g <strong>and</strong> prosecut<strong>in</strong>g cases <strong>of</strong> discrim<strong>in</strong>ation<br />
<strong>in</strong> the buy<strong>in</strong>g <strong>and</strong> rent<strong>in</strong>g <strong>of</strong><br />
hous<strong>in</strong>g <strong>and</strong> <strong>in</strong> the secur<strong>in</strong>g <strong>of</strong> mortgages<br />
Maria Krysan is a member <strong>of</strong> the<br />
IGPA faculty <strong>and</strong> an associate pr<strong>of</strong>essor<br />
<strong>of</strong> sociology at the University<br />
<strong>of</strong> Ill<strong>in</strong>ois at Chicago. Her<br />
research focuses on racial residential<br />
segregation <strong>and</strong> racial attitudes.<br />
She is co-author (with H.<br />
Schuman, L. Bobo <strong>and</strong> C. Steeh) <strong>of</strong><br />
the book <strong>Racial</strong> Attitudes <strong>in</strong> America:<br />
Trends <strong>and</strong> Interpretations<br />
(Harvard University Press, Revised<br />
Edition, 1997), <strong>and</strong> is responsible<br />
for a website that updates the data<br />
from that book (http://www.igpa.<br />
uill<strong>in</strong>ois.edu/programs/racial<br />
attitudes). In addition to a recent<br />
edited volume with Am<strong>and</strong>a Lewis,<br />
called The Chang<strong>in</strong>g Terra<strong>in</strong> <strong>of</strong> Race<br />
<strong>and</strong> Ethnicity, her most recent work<br />
has appeared <strong>in</strong> the Annual Review<br />
<strong>of</strong> Sociology, Demography, Social<br />
Problems, Social Forces, Social<br />
Science Research, <strong>and</strong> The DuBois<br />
Review. She is a pr<strong>in</strong>cipal <strong>in</strong>vestigator<br />
on an NIH-funded grant, “How<br />
Does Race Matter <strong>in</strong> Hous<strong>in</strong>g<br />
Search Strategies, Experiences <strong>and</strong><br />
Preferences,” a project that cont<strong>in</strong>ues<br />
her <strong>in</strong>terest <strong>in</strong> racial attitudes<br />
<strong>and</strong> residential segregation.<br />
Krysan received her Ph.D. from the<br />
University <strong>of</strong> Michigan <strong>in</strong> 1995.<br />
<strong>and</strong> property <strong>in</strong>surance are necessary tools<br />
for address<strong>in</strong>g <strong>in</strong>equities <strong>in</strong> the hous<strong>in</strong>g<br />
system.<br />
Alter<strong>in</strong>g preferences that work aga<strong>in</strong>st <strong>in</strong>tegration<br />
is a far more complicated policy<br />
goal. In the abstract, <strong>in</strong>dividuals <strong>of</strong> all races<br />
generally pr<strong>of</strong>ess an <strong>in</strong>terest <strong>in</strong> more <strong>in</strong>te-<br />
30<br />
Camille Zubr<strong>in</strong>sky<br />
Charles. Won’t You<br />
Be My Neighbor<br />
Race, Class, <strong>and</strong> Residence<br />
<strong>in</strong> Los Angeles<br />
(New York: Russell<br />
Sage Foundation<br />
(2006).<br />
31<br />
Gordon W. Allport.<br />
1954. The Nature <strong>of</strong><br />
Prejudice (New York:<br />
Doubleday Anchor,<br />
1954); Thomas F.<br />
Pettigrew. “Intergroup<br />
Contact Theory,”<br />
Annual Review<br />
<strong>of</strong> Psychology 49<br />
(1998): 65-85.<br />
32<br />
James W. Loewen.<br />
Sundown Towns: A<br />
Hidden Dimension <strong>of</strong><br />
American Racism<br />
(New York: Simon<br />
<strong>and</strong> Schuster, 2005).<br />
33<br />
Gregory D. Squires.<br />
“Prospects <strong>and</strong> Pitfalls<br />
<strong>of</strong> Fair Hous<strong>in</strong>g<br />
Enforcement Efforts”<br />
<strong>in</strong> James H.<br />
Carr <strong>and</strong> N<strong>and</strong><strong>in</strong>ee<br />
K. Kutty, eds., <strong>Segregation</strong>:<br />
The Ris<strong>in</strong>g<br />
Costs for America<br />
(New York: Routledge,<br />
2008).<br />
47
The Ill<strong>in</strong>ois Report 2009<br />
grated neighborhoods than those where<br />
they actually live. The challenge is to create<br />
situations where those abstract preferences<br />
can be translated <strong>in</strong>to behavior. The affirmative<br />
market<strong>in</strong>g component <strong>of</strong> fair hous<strong>in</strong>g<br />
legislation is consistent with this need.<br />
Affirmative market<strong>in</strong>g refers to the active<br />
promotion <strong>of</strong> racially diverse, majority<br />
black, <strong>and</strong> majority Lat<strong>in</strong>o neighborhoods<br />
to whites <strong>and</strong> the encourag<strong>in</strong>g <strong>of</strong> Asians,<br />
blacks, <strong>and</strong> Lat<strong>in</strong>os to consider mov<strong>in</strong>g <strong>in</strong>to<br />
majority-white neighborhoods. Programs<br />
that seek to overcome the <strong>in</strong>formational<br />
biases that lead people to avoid certa<strong>in</strong><br />
neighborhoods, or to have little knowledge<br />
<strong>of</strong> them, should be supported. Policies that<br />
provide resources to community-based organizations<br />
that work with real estate<br />
agents, l<strong>and</strong>lords <strong>and</strong> civic leaders to market<br />
their communities <strong>in</strong> a way that makes<br />
them attractive <strong>and</strong> accessible to people <strong>of</strong><br />
all races <strong>and</strong> ethnicities would speak to this<br />
issue.<br />
For Sundown Towns <strong>in</strong> particular, Loewen<br />
identifies three th<strong>in</strong>gs a community can<br />
do: “(a) Admit it (‘We did this’); (b) Apologize<br />
for it (‘We did this, <strong>and</strong> it was wrong’)<br />
<strong>and</strong> (c) Proclaim they now welcome residents<br />
<strong>of</strong> all races (‘We did this, it was<br />
wrong, <strong>and</strong> we don’t do it anymore’).” But<br />
he also argues that there are state <strong>and</strong> federal<br />
responses that can be taken to penalize<br />
Sundown Towns – <strong>in</strong> the form <strong>of</strong> deny<strong>in</strong>g<br />
federal <strong>and</strong> state tax dollars for programs<br />
<strong>and</strong> projects until they take action to make<br />
up for their past practices.<br />
48