Validation of Calibration Equations Developed ... - Automatic Milking
Validation of Calibration Equations Developed ... - Automatic Milking
Validation of Calibration Equations Developed ... - Automatic Milking

You also want an ePaper? Increase the reach of your titles
YUMPU automatically turns print PDFs into web optimized ePapers that Google loves.
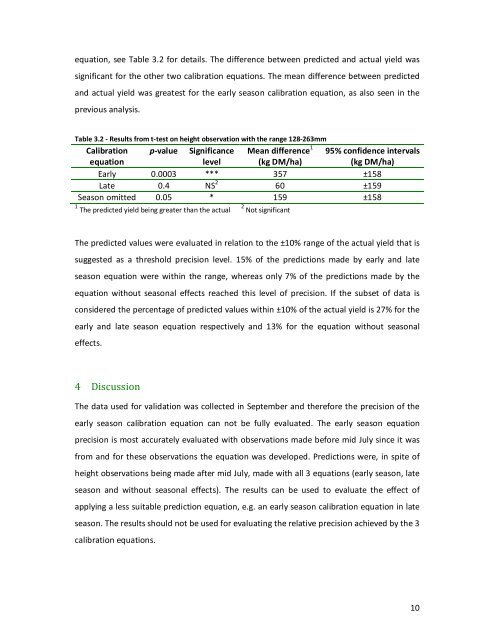
equation, see Table 3.2 for details. The difference between predicted and actual yield was<br />
significant for the other two calibration equations. The mean difference between predicted<br />
and actual yield was greatest for the early season calibration equation, as also seen in the<br />
previous analysis.<br />
Table 3.2 - Results from t-test on height observation with the range 128-263mm<br />
<strong>Calibration</strong><br />
equation<br />
p-value Significance<br />
level<br />
Mean difference 1<br />
(kg DM/ha)<br />
95% confidence intervals<br />
(kg DM/ha)<br />
Early 0.0003 *** 357 ±158<br />
Late 0.4 NS 2 60 ±159<br />
Season omitted 0.05 * 159 ±158<br />
1 The predicted yield being greater than the actual<br />
2 Not significant<br />
The predicted values were evaluated in relation to the ±10% range <strong>of</strong> the actual yield that is<br />
suggested as a threshold precision level. 15% <strong>of</strong> the predictions made by early and late<br />
season equation were within the range, whereas only 7% <strong>of</strong> the predictions made by the<br />
equation without seasonal effects reached this level <strong>of</strong> precision. If the subset <strong>of</strong> data is<br />
considered the percentage <strong>of</strong> predicted values within ±10% <strong>of</strong> the actual yield is 27% for the<br />
early and late season equation respectively and 13% for the equation without seasonal<br />
effects.<br />
4 Discussion<br />
The data used for validation was collected in September and therefore the precision <strong>of</strong> the<br />
early season calibration equation can not be fully evaluated. The early season equation<br />
precision is most accurately evaluated with observations made before mid July since it was<br />
from and for these observations the equation was developed. Predictions were, in spite <strong>of</strong><br />
height observations being made after mid July, made with all 3 equations (early season, late<br />
season and without seasonal effects). The results can be used to evaluate the effect <strong>of</strong><br />
applying a less suitable prediction equation, e.g. an early season calibration equation in late<br />
season. The results should not be used for evaluating the relative precision achieved by the 3<br />
calibration equations.<br />
10