Process and Equipment Reliability - Barringer and Associates, Inc.
Process and Equipment Reliability - Barringer and Associates, Inc.
Process and Equipment Reliability - Barringer and Associates, Inc.

You also want an ePaper? Increase the reach of your titles
YUMPU automatically turns print PDFs into web optimized ePapers that Google loves.
<strong>Process</strong> <strong>and</strong> <strong>Equipment</strong><br />
<strong>Reliability</strong><br />
Paul <strong>Barringer</strong>, P.E.<br />
<strong>Barringer</strong> & <strong>Associates</strong>, <strong>Inc</strong>.<br />
P.O. Box 3985<br />
Humble, TX 77347-3985 USA<br />
Phone: 1-281-852-6810 Website: www.barringer1.com<br />
FAX: 1-281-852-3749 E-mail: hpaul@barringer1.com<br />
© <strong>Barringer</strong> & <strong>Associates</strong>, <strong>Inc</strong>. 2004 1<br />
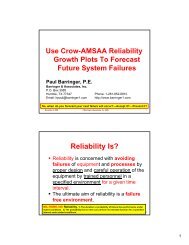
Definitions<br />
• <strong>Reliability</strong>—<br />
The probability that a component, device, system, or<br />
process will perform its intended function without<br />
failure for a given time when operated correctly<br />
under specified environmental conditions.<br />
• Life Cycle Costs—<br />
All costs associated with the acquisition <strong>and</strong><br />
ownership of a system over its full life. The usual<br />
figure of merit is net present value.<br />
• <strong>Reliability</strong> <strong>and</strong> Life Cycle Cost—<br />
Business issues come together as a rational task.<br />
© <strong>Barringer</strong> & <strong>Associates</strong>, <strong>Inc</strong>. 2004 2<br />
1
<strong>Reliability</strong> Is A Business Issue<br />
• System failures halt cash inflows plus incur repair costs<br />
• <strong>Equipment</strong> failures cost money for repairs/claims<br />
• Business needs equipment <strong>and</strong> processes that are<br />
– Available ready for duty when needed<br />
– Reliable free from system failures <strong>and</strong> high cost<br />
– Affordable a life cycle cost issue of tradeoffs<br />
• We speak of technology, safety, <strong>and</strong> reliability but the<br />
main issue is money which addresses life cycle costs!<br />
• <strong>Reliability</strong> issues involve details about time <strong>and</strong> money<br />
for the entire organization to make business decisions<br />
© <strong>Barringer</strong> & <strong>Associates</strong>, <strong>Inc</strong>. 2004 3<br />
<strong>Reliability</strong> Starts<br />
With Management<br />
• Management must communicate reliability issues<br />
<strong>and</strong> the $ need for a failure free environment<br />
• Most reliability issues are driven by money<br />
• Some reliability issues are regulatory<br />
• Most things are not perfect <strong>and</strong> not free of failures<br />
• Everything fails—some by aging—some by events<br />
• Perfection exists only in our fantasy world<br />
• Management must say what they want <strong>and</strong> want<br />
what they say in policy statements to guide the staff<br />
© <strong>Barringer</strong> & <strong>Associates</strong>, <strong>Inc</strong>. 2004 4<br />
2
Management Double Speak<br />
• Management says they want reliability then they describe<br />
availability—with emphasis on fast repairs<br />
– Availability describes the % of time the system is alive <strong>and</strong><br />
ready for use when called upon<br />
• Management verbalizes they want reliability—with<br />
emphasis on uptime (availability)<br />
– <strong>Reliability</strong> addresses the probability of the failure free interval<br />
under specific conditions<br />
• Management seldom accurately defines costs of<br />
unreliability to focus the staff on $Risk tradeoffs for<br />
reliability issues<br />
© <strong>Barringer</strong> & <strong>Associates</strong>, <strong>Inc</strong>. 2004 5<br />
What’s Your <strong>Reliability</strong> Policy<br />
Your safety policy says:<br />
We will have an accident free work place.<br />
Your quality policy says:<br />
We will ship products free from defects.<br />
Your environmental policy says:<br />
We will have no environmental spills/releases.<br />
Does your reliability policy say:<br />
We will build an economical <strong>and</strong> failure<br />
free process which will operate for<br />
5 years between planned outage.<br />
Considered<br />
impossible<br />
40 years ago<br />
Considered<br />
impossible<br />
20 years ago<br />
Considered<br />
impossible<br />
2 years ago<br />
Considered<br />
impossible<br />
today!<br />
© <strong>Barringer</strong> & <strong>Associates</strong>, <strong>Inc</strong>. 2004 6<br />
3
Management Do You Know The<br />
Cost Of Unreliability<br />
• Are you managing to control the cost of<br />
unreliability including failure of the process<br />
• Have you defined a strategy for the system<br />
or do you simply have a collection of tactics<br />
that you think represent a strategy<br />
• Have you communicated your cost of<br />
unreliability with a plan for attacking high<br />
costs money issues—do your engineers know<br />
the cost details to implement the tactics<br />
© <strong>Barringer</strong> & <strong>Associates</strong>, <strong>Inc</strong>. 2004 7<br />
The Most Important Tool<br />
• Make Pareto lists based on money. Focusing<br />
on $issues is the most important reliability tool.<br />
• Get engineers to work the $Pareto money list<br />
rather than on love affairs with equipment<br />
• If your Pareto list is based on nose counts of<br />
problems, you’re on the wrong track!<br />
• Ensure engineering/maintenance tactics support<br />
the plant reliability strategy for $issues<br />
© <strong>Barringer</strong> & <strong>Associates</strong>, <strong>Inc</strong>. 2004 8<br />
4
<strong>Reliability</strong> vs Maintenance<br />
Engineering<br />
• Renaming your maintenance organization to include<br />
the name reliability gives you style—but what about<br />
substance of actually using reliability tools<br />
• <strong>Reliability</strong> engineering tools work to avoid failures<br />
• Maintenance engineering tools strive for fast repairs<br />
• It’s simple—<br />
<strong>Reliability</strong> engineers : Fire marshal ::<br />
Maintenance engineers : Fire fighters<br />
• You’ll need ~1 <strong>Reliability</strong> Engineer for every ~10<br />
Maintenance Engineers (no increase in staff size)<br />
© <strong>Barringer</strong> & <strong>Associates</strong>, <strong>Inc</strong>. 2004 9<br />
<strong>Reliability</strong> Tools: Are You Using<br />
• Mean time between failures — Use arithmetic for figures of merit<br />
• Decision trees — Use reliability values to get quick decisions<br />
• Bathtub curves — Underst<strong>and</strong> modes of failure from human experiences<br />
• Availability/reliability — % of time available <strong>and</strong> % chance for no failures<br />
• Preparing reliability data for analysis — Make data talk<br />
• Normal probability plots — Bell shaped curve made into a straight line<br />
• Log-normal probability plots — Tailed data made into a straight line<br />
• Weibull probability plots — Organize chaos of data into a straight line<br />
• Corrective action for Weibull failure modes — What to do <strong>and</strong> when<br />
• <strong>Reliability</strong> block diagram models — Organize failures into RAM facts<br />
• Monte Carlo simulations — Use for complex models to get facts on failures<br />
© <strong>Barringer</strong> & <strong>Associates</strong>, <strong>Inc</strong>. 2004<br />
5
<strong>Reliability</strong> Tools: -- Cont’d<br />
• Critical items list — Reduce complexity to the vital few issues for management<br />
• Pareto distributions — Separate the vital few issues from the trivial many<br />
• Failure mode effect analysis — Bottom up search for problems to eliminate<br />
• Fault tree analysis — Top down search for problems driven by experience<br />
• Quality function deployment — Put the voice of the user into reliability<br />
• Design reviews — Perform engineering review for reliability issues<br />
• Configuration control — Document to avoid reliability problems<br />
• Mechanical components interaction tests — Find problems early<br />
• Load/strength interactions — Failures: strengths too low or loads too high<br />
© <strong>Barringer</strong> & <strong>Associates</strong>, <strong>Inc</strong>. 2004<br />
<strong>Reliability</strong> Tools: -- Cont’d<br />
• Electronic device screening <strong>and</strong> derating — Eliminate failures<br />
• Software reliability tools — Test/use/correct, test/use/correct, test/use/correct<br />
• <strong>Reliability</strong> testing strategies — Find the limits to find weaknesses & correct<br />
• Simultaneous testing — Testing/use strategy for inexpensive items<br />
• Sudden death testing — Testing/use strategy for expensive items<br />
• Accelerated testing — How to get test results in your life time!—add loads<br />
• <strong>Reliability</strong> growth models — Show failures & forecast future failures<br />
• Failure recording, analysis, & corrective action systems — Data!<br />
• <strong>Reliability</strong> policies <strong>and</strong> systems — Say what you want & get what you say<br />
• Contracting for reliability — Specify <strong>and</strong> communicate with your vendors<br />
• <strong>Reliability</strong> audits — Find out how you’re really doing by examination<br />
© <strong>Barringer</strong> & <strong>Associates</strong>, <strong>Inc</strong>. 2004<br />
6
<strong>Reliability</strong> Tools — Start Your<br />
Numbers With Arithmetic<br />
• Start with MTTF or MTBF = (Σ life)/(Σ fail.)<br />
• What are you mean times between failure for:<br />
Pumps Heat exchangers Valves etc. — or are you<br />
clueless If you’re clueless on the numbers, you just<br />
don’t get the idea about reliability issues!<br />
• Underst<strong>and</strong> MTTF or MTBF which begins with<br />
arithmetic <strong>and</strong> grows to statistics<br />
• A key long term issue: mean time between<br />
maintenance actions—this is a durability issue!<br />
© <strong>Barringer</strong> & <strong>Associates</strong>, <strong>Inc</strong>. 2004 13<br />
MTTF/MTBF—Simple Arithmetic<br />
This MTTF data from production, maintenance, <strong>and</strong> purchasing records<br />
Year<br />
Number<br />
Of<br />
Unspared<br />
Pumps<br />
Chemical Plant ANSI Pump Life<br />
Number<br />
Total Hours Number Seal<br />
Of<br />
Of Pump Of Seal MTTF<br />
Spared<br />
Operation Failures (yrs)<br />
Pumps<br />
Seal<br />
Failure<br />
Conditions<br />
Rate<br />
(fail/hr)<br />
1985 937 2996 21,330,000 1083 2.25 50.8E-6 No<br />
1986 943 2996 21,380,000 937 2.60 43.8E-6 Emission<br />
1987 950 2998 21,450,000 1156 2.12 53.9E-6 Monitoring<br />
1988 950 3008 21,500,000 1127 2.18 52.4E-6<br />
1989 953 3012 21,540,000 1003 2.45 46.6E-6<br />
1990 955 3028 21,630,000 1689 1.46 78.1E-6<br />
1991 957 3036 21,680,000 1628 1.52 75.1E-6<br />
1992 963 3048 21,790,000 1581 1.57 72.6E-6<br />
1993 955 3038 21,670,000 1517 1.63 70.0E-6 Emission<br />
1994 951 3026 21,580,000 1487 1.66 68.9E-6 Monitoring<br />
Remember: MTTF is a meterstick—not a micrometer!!<br />
Refinery API Pump Life<br />
The<br />
Number<br />
Data<br />
Seal<br />
Number Of Total Hours Number Seal<br />
Of<br />
Failure<br />
Year<br />
Spared Of Pump Of Seal MTTF<br />
Conditions<br />
Unspared<br />
Rate<br />
Pumps Operation Failures (yrs)<br />
Pumps<br />
(fail/hr)<br />
1985 313 1542 9,500,000 415 2.61 43.7E-6 No<br />
1986 313 1542 9,500,000 398 2.72 41.9E-6 Emission<br />
1987 313 1548 9,520,000 380 2.86 39.9E-6 Monitoring<br />
1988 310 1560 9,550,000 361 3.02 37.8E-6<br />
1989 305 1580 9,590,000 343 3.19 35.8E-6<br />
1990 295 1580 9,500,000 535 2.03 56.3E-6<br />
1991 290 1590 9,500,000 481 2.25 50.6E-6<br />
1992 280 1598 9,450,000 403 2.68 42.6E-6<br />
1993 270 1602 9,380,000 354 3.02 37.7E-6 Emission<br />
1994 265 1610 9,370,000 278 3.85 29.7E-6 Monitoring<br />
MTTF (yrs)<br />
Chemical Plant ANSI Pump Seal Life<br />
4.00<br />
3.50<br />
3.00<br />
2.50<br />
2.00<br />
1.50<br />
1.00<br />
0.50<br />
0.00<br />
Before<br />
Emission<br />
Monitoring<br />
After<br />
Emission<br />
Monitoring<br />
1984 1986 1988 1990 1992 1994<br />
Year<br />
Change In<br />
Failure<br />
Criteria<br />
MTTF (yrs)<br />
4.00<br />
3.50<br />
3.00<br />
2.50<br />
2.00<br />
1.50<br />
1.00<br />
0.50<br />
0.00<br />
Refinery API Pump Seal Life<br />
Before<br />
Emission<br />
Monitoring<br />
1984 1986 1988 1990 1992 1994<br />
Year<br />
© <strong>Barringer</strong> & <strong>Associates</strong>, <strong>Inc</strong>. 2004 14<br />
After<br />
Emission<br />
Monitoring<br />
7
Knowing MTBF or MTTF Tells<br />
About Maintenance Dem<strong>and</strong>s<br />
• Suppose you have 400 pumps. Half of the pumps are<br />
running at any one time (which means we accumulate<br />
200 years of life annually).<br />
• Suppose your MTBF = 2 years/failure.<br />
• How many pump repairs should you expect<br />
MTBF = ΣLife<br />
= 2 years<br />
= 200 years<br />
X failure<br />
, ∴ X = 100<br />
failures<br />
year<br />
ΣFailures failure<br />
• If your competitor has MTBF = 4 years — who has the<br />
advantage <strong>and</strong> by how much<br />
© <strong>Barringer</strong> & <strong>Associates</strong>, <strong>Inc</strong>. 2004 15<br />
Can We Do Better Than Arithmetic<br />
• Weibull analysis provides specific details about failure<br />
modes <strong>and</strong> allows us to forecast future failures<br />
• We have 5 ages-to-failure data from bearings on a<br />
specific machine at (in rank order): 3900, 6500, 7800,<br />
18100, 32600 hours. We also have 5 bearings in<br />
operation that have not failed (suspensions) at: 4000,<br />
6000, 15000, 25000, <strong>and</strong> 30000 hours will be replaced<br />
with similar bearings when failure occurs.<br />
• What’s the failure mode, when are future failures<br />
predicted for the bearings in continuous service<br />
© <strong>Barringer</strong> & <strong>Associates</strong>, <strong>Inc</strong>. 2004 16<br />
8
L-10 life<br />
Weibull Plot<br />
~5x η<br />
Forecasted<br />
Future<br />
Failures:<br />
1 by month 6<br />
1 by month 12<br />
1 by month 18<br />
1 by month 24<br />
1 by month 31<br />
1 by month 37<br />
4403 hrs<br />
Wear-out<br />
failure mode<br />
β > 1<br />
Characteristic<br />
Life η = 22,914<br />
hours<br />
© <strong>Barringer</strong> & <strong>Associates</strong>, <strong>Inc</strong>. 2004 17<br />
PM Bearing Replacements<br />
β = 1.364<br />
η = 22,914<br />
• It depends on β, η, planned & unplanned costs.<br />
• Supposed the planned cost is $5000.<br />
– Case 1: Suppose the unplanned cost is $15,000<br />
– Case 2: Suppose the unplanned cost is $25,000<br />
• Case 1: No optimum replacement. Run<br />
bearings to failure<br />
• Case 2 says the optimum replacement interval is<br />
19,465 hours for a PM replacement but cost<br />
savings is so small—∴run to failure<br />
© <strong>Barringer</strong> & <strong>Associates</strong>, <strong>Inc</strong>. 2004 18<br />
9
Bearing Replacement Curve<br />
No real $/hr<br />
advantage<br />
for using a PM<br />
replacement<br />
strategy<br />
© <strong>Barringer</strong> & <strong>Associates</strong>, <strong>Inc</strong>. 2004 19<br />
Models Organize Thinking<br />
• Gather facts, build models, get the math right.<br />
• Weibull models are “smart” models with heavy<br />
data dem<strong>and</strong>s by individual failure modes.<br />
• Crow-AMSAA models are not so smart, have<br />
lesser data dem<strong>and</strong>s, <strong>and</strong> allow use of mixed<br />
failure modes.<br />
• C-A plots allow “fearless forecasts” of future<br />
failures.<br />
© <strong>Barringer</strong> & <strong>Associates</strong>, <strong>Inc</strong>. 2004 20<br />
10
<strong>Reliability</strong> Growth Models<br />
This graph predicted next safety incident to occur<br />
On May 16, 2004. Actual occurred May 11, 2004.<br />
“If you can predict it, you can control it.”<br />
Localize bad trend!<br />
When:<br />
β < 1 failures come slowly<br />
β >1 failures come faster<br />
β = 1 no improvement/deterioration<br />
N(t) = λt β<br />
© <strong>Barringer</strong> & <strong>Associates</strong>, <strong>Inc</strong>. 2004 21<br />
<strong>Reliability</strong> Growth Models<br />
1590 hrs<br />
1150 hrs<br />
Localize bad trend!<br />
© <strong>Barringer</strong> & <strong>Associates</strong>, <strong>Inc</strong>. 2004 22<br />
11
Did Your RCM Program Do This<br />
Loss<br />
Save<br />
RCM Starts Here <br />
<br />
© <strong>Barringer</strong> & <strong>Associates</strong>, <strong>Inc</strong>. 2004 23<br />
What’s Your <strong>Process</strong> <strong>Reliability</strong> <br />
<strong>Reliability</strong> %<br />
.1<br />
1<br />
5<br />
20 10<br />
40 30<br />
60 50<br />
70<br />
80<br />
90<br />
95<br />
98<br />
99<br />
99.5<br />
99.8<br />
Weibull Probability Paper<br />
Daily Production Data<br />
Actual Data<br />
Point Estimate Of Daily Output = 1000 tons/day<br />
Efficiency & Utilizations Losses = 83,133 t/yr<br />
<strong>Reliability</strong> Losses = 10,184 t/yr<br />
99.9<br />
.1 1 10<br />
100 1000<br />
Production Output (tons/day)<br />
Point Estimate<br />
Nameplate<br />
Output =<br />
1200 tons/day<br />
<strong>Reliability</strong> =<br />
~91%<br />
Demonstrated<br />
Line<br />
Nameplate<br />
Line<br />
© <strong>Barringer</strong> & <strong>Associates</strong>, <strong>Inc</strong>. 2004 24<br />
12
Series <strong>Reliability</strong> Models<br />
λ T<br />
= Σλ<br />
λ 2<br />
λ<br />
i<br />
= λ 1<br />
+ λ 2<br />
+ λ<br />
….<br />
3<br />
λ 1<br />
3<br />
i=n<br />
R 1<br />
= e (-λ 1 t) R 2<br />
= e (-λ 2 t) R 3<br />
= e R (-λ 3 t) s = Π R i<br />
= R<br />
i=1 1<br />
* R 2<br />
* R 3<br />
= e (-λ Τ t)<br />
S<br />
y<br />
s<br />
t<br />
e<br />
m<br />
R<br />
e<br />
l<br />
i<br />
a<br />
b<br />
i<br />
l<br />
i<br />
t<br />
y<br />
1<br />
0.9<br />
0.8<br />
0.7<br />
0.6<br />
0.5<br />
0.4<br />
0.3<br />
0.2<br />
0.1<br />
0<br />
Many Components In Series Destroys Systems <strong>Reliability</strong><br />
N = 5 Elements in series<br />
N = 10<br />
N = 25<br />
N = 50<br />
N = 100<br />
0.95 0.96 0.97 0.98 0.99 1<br />
Individual Component <strong>Reliability</strong><br />
Many things in<br />
series = bad news!<br />
© <strong>Barringer</strong> & <strong>Associates</strong>, <strong>Inc</strong>. 2004 25<br />
Parallel <strong>Reliability</strong> Models<br />
R<br />
R overall = 1 -(1-R 1 )*(1 - R 2 )*(1 - R 3 )*( …. )<br />
1<br />
y<br />
N = 3<br />
s<br />
t 0.9995<br />
R N = 4<br />
3 m<br />
Components In Parallel Improve Systems <strong>Reliability</strong><br />
R 2<br />
S<br />
1<br />
0.9990<br />
High reliability elements<br />
R<br />
need only a few items in<br />
e<br />
parallel for achieving a<br />
l<br />
i 0.9985<br />
high reliability system.<br />
a<br />
b<br />
i<br />
l<br />
0.9980<br />
N = 2 Elements In Parallel<br />
i<br />
t<br />
y<br />
Each element<br />
in parallel<br />
must be able<br />
to carry the<br />
full load<br />
0.9975<br />
0.95 0.96 0.97 0.98 0.99 1<br />
Individual Component <strong>Reliability</strong><br />
© <strong>Barringer</strong> & <strong>Associates</strong>, <strong>Inc</strong>. 2004 26<br />
13
#1<br />
#2<br />
Roots Of <strong>Reliability</strong> Failures<br />
Mature Plants Frequency %<br />
• People 38<br />
• Procedures + <strong>Process</strong>es 34<br />
• <strong>Equipment</strong> 28<br />
100<br />
People<br />
Procedures/<strong>Process</strong>es<br />
Machines<br />
• Human reliability problems are opportunities<br />
for improvement by error proofing operations<br />
• Some human failures are also tied to<br />
procedures <strong>and</strong> processes problems<br />
© <strong>Barringer</strong> & <strong>Associates</strong>, <strong>Inc</strong>. 2004 27<br />
Fast action<br />
required by<br />
humans =<br />
failure!<br />
<strong>Reliability</strong> = (1 - pof)<br />
Human Models<br />
Table 2<br />
Time Available For Diagnosis<br />
Of An Abnormal Event After<br />
Control Room Annuciation<br />
Time<br />
(minutes)<br />
Probability Of<br />
Failure (%)<br />
1 ~100<br />
10 50<br />
20 10<br />
30 1<br />
60 0.1<br />
1500 0.01<br />
If they don’t<br />
forget!<br />
© <strong>Barringer</strong> & <strong>Associates</strong>, <strong>Inc</strong>. 2004 28<br />
14
Top Down Cost Of<br />
Unreliabilty Model<br />
For each block <strong>and</strong> the plant summary: What is the cost of unreliability if gross margin is<br />
$10,000/hr, scrap is $5,000/incident, <strong>and</strong> maintenance cost is $5,000 per hour of down time<br />
Block Diagram Of Plant<br />
Lost Time 3.6 24 41.5 69.1 hrs/yr<br />
Gross<br />
Margin Lost $36,000 $240,000 $415,000 $691,000 $/yr<br />
Scrap<br />
Disposal $'s $1,000 $5,000 $2,500 $8,500 $/yr<br />
Breakdown<br />
<strong>Reliability</strong><br />
Problem<br />
A B C Summary<br />
Failure Rate<br />
22.8E-06 114.2E-06 57.1E-06 194.1E-06 fail./hr<br />
Corrective<br />
Time/Fail. 18 24 83 40.6 hrs/fail<br />
Maint. $'s $18,000 $120,000 $207,500 $345,500 $/yr<br />
Total $55,000 $365,000 $625,000 $1,045,000 $/yr<br />
2<br />
Cost of Unreliability<br />
© <strong>Barringer</strong> & <strong>Associates</strong>, <strong>Inc</strong>. 2004 29<br />
1<br />
Maintainability<br />
Problem<br />
1<br />
2<br />
Don’t Forget Simple Tools: FMEA<br />
FMEA Work Sheet<br />
Occurrence Ranking Index: Severity Ranking Index Customer's Detection Ranking Index<br />
Rank Criteria Rank Criteria Rank Criteria<br />
1 Remote chance for failure 1 Undetectable effect on system 1 Almost certain detection of failure mode<br />
2 Low failure rate based on 2 Low severity impact because failure 2 Very high likelihood of detecting failure<br />
3 previous designs with low failures 3 will cause slight customer annoyance 3 High likelihood of detecting failure mode<br />
4 Moderate failure rates based on similar 4 Moderate severity with some customer 4 Mod. high likelihood of detecting failure<br />
5 designs which have some occasional 5 dissatisfaction <strong>and</strong> with performance 5 Mod. likelihood of detecting failure<br />
6 failures but not in major proportions 6 loss which is noticable by customer 6 Low likelihood of detecting failure mode<br />
7 High failure rates based on similar 7 High severity with high degree of 7 Very low likelihood of detecting failure<br />
8 designs which have been troublesome. 8 customer dissatisfaction 8 Remote likelihood of detecting failure<br />
9 Very high failure rates <strong>and</strong> the failures 9 Very severe problem involving potential 9 Very remote likelihood of detecting failure<br />
10 will be major occurrences. 10 safety problem or major non-conformity 10 Can not detect failure mode<br />
Component:<br />
FMEA Date/Rev Level:<br />
Supplier:<br />
Customer:<br />
Engineer: Assembly :<br />
Component<br />
Name<br />
Component<br />
Function<br />
Cause(s)<br />
Of<br />
Failure<br />
Effect(s) Of<br />
Failure<br />
Occurrence<br />
Index<br />
(O)<br />
Severity<br />
Index<br />
(S)<br />
Detection<br />
Index<br />
(D)<br />
Risk Priority<br />
Number<br />
(O)*(S)*(D)<br />
Recommended Corrective<br />
Action<br />
SAE: J1739<br />
© <strong>Barringer</strong> & <strong>Associates</strong>, <strong>Inc</strong>. 2004 30<br />
15
Conflicting LCC Issues--<br />
What To Do<br />
Project Engineers:<br />
Minimize capital expenditures<br />
Maintenance Engineers:<br />
Minimize repair hours<br />
Shareholders:<br />
Maximize dividends<br />
<strong>and</strong>/or share price<br />
Production:<br />
Maximize uptime hours<br />
<strong>Reliability</strong> Engineers<br />
And Regulators:<br />
Maximize equipment reliability<br />
to avoid failures<br />
Buy right Or<br />
Buy Cheap<br />
Accounting:<br />
Maximize project net present value<br />
© <strong>Barringer</strong> & <strong>Associates</strong>, <strong>Inc</strong>. 2004 31<br />
Engineers Must Quantify All<br />
Life Cycle Costs<br />
Engineers Must Think Like MBA’s<br />
And<br />
Act Like Engineers<br />
To Get<br />
Lowest Long Term Cost Of Ownership<br />
Over The Entire Life Cycle<br />
Think NPV<br />
© <strong>Barringer</strong> & <strong>Associates</strong>, <strong>Inc</strong>. 2004 32<br />
16
Life Cycle Costs Are Fixed<br />
During Design<br />
• Often sustaining costs (including hidden costs)<br />
are 2-20 times acquisition costs (obvious costs)<br />
• About 65% of total LCC are fixed by the time<br />
equipment is specified (but only a few percent<br />
of funds have been expended)<br />
• Minimizing LCC pushes up NPV<br />
• Finding the minimum LCC required details<br />
for both acquisition costs <strong>and</strong> sustaining costs<br />
© <strong>Barringer</strong> & <strong>Associates</strong>, <strong>Inc</strong>. 2004 33<br />
Top Levels Of LCC CostTree<br />
LCC = Acquisition Costs + Sustaining Costs<br />
Life Cycle<br />
Cost Tree<br />
Acquisition Costs<br />
Sustaining Costs<br />
Acquisition costs <strong>and</strong> sustaining costs are not<br />
mutually exclusive—find both by gathering the<br />
correct inputs <strong>and</strong> identifying cost drivers<br />
© <strong>Barringer</strong> & <strong>Associates</strong>, <strong>Inc</strong>. 2004 34<br />
17
Getting LCC Just Right!<br />
The High Cost Of Large<br />
<strong>Equipment</strong>—Too Many<br />
Outages And Too<br />
Few Run Hours<br />
The High Cost Of Small <strong>Equipment</strong><br />
With Too Many Redundancies<br />
And Long Run Hours<br />
Life Cycle Cost<br />
The Sweet Spot<br />
Effectiveness<br />
In The Simplest Form, Effectiveness<br />
Could Be Availability<br />
© <strong>Barringer</strong> & <strong>Associates</strong>, <strong>Inc</strong>. 2004 35<br />
LCC Thumbnail<br />
• Life cycle costs include cradle to grave costs<br />
• <strong>Inc</strong>luding failures into LCC decisions permits<br />
engineering quantities of manpower, spare parts,<br />
<strong>and</strong> alternatives on a rational basis rather than use<br />
of rules of thumb or emotion<br />
• LCC provides numbers for trade-off studies <strong>and</strong><br />
uses NPV for sound, unemotional decisions<br />
• Monte Carlo models add realism to numbers <strong>and</strong><br />
help find trade-off values<br />
© <strong>Barringer</strong> & <strong>Associates</strong>, <strong>Inc</strong>. 2004 36<br />
18
Summary<br />
• Set a policy for a failure free environment<br />
• Use data to predict problems <strong>and</strong> fix them<br />
• Think time, money, <strong>and</strong> alternativeS<br />
• Quantify unreliability <strong>and</strong> unreliability costs<br />
• Plan for organized improvements<br />
• Learn new tools for solving old problems<br />
• Prevent system failures<br />
© <strong>Barringer</strong> & <strong>Associates</strong>, <strong>Inc</strong>. 2004 37<br />
Internet Downloads<br />
• Copies of the technical paper <strong>Process</strong> <strong>and</strong><br />
<strong>Equipment</strong> <strong>Reliability</strong> <strong>and</strong> slides are<br />
available as down loadable PDF files<br />
• http://www.barringer1.com/Papers.htm<br />
• Or use hyperlinks from<br />
home page to reach<br />
Recent Technical Papers<br />
Yes, that’s a<br />
capital “P”<br />
© <strong>Barringer</strong> & <strong>Associates</strong>, <strong>Inc</strong>. 2004 38<br />
19