Full Annual Report - Inchcape
Full Annual Report - Inchcape
Full Annual Report - Inchcape

Create successful ePaper yourself
Turn your PDF publications into a flip-book with our unique Google optimized e-Paper software.
<strong>Annual</strong> <strong>Report</strong> and Accounts 2009<br />
Industry leader<br />
Uniquely positioned<br />
worldwide...
<strong>Inchcape</strong> plc<br />
Uniquely positioned industry leader,worldwide<br />
<strong>Inchcape</strong> is a leading independent global<br />
automotive distributor and retailer which owes<br />
its unique position to four key factors:<br />
• A resilient business model<br />
• A relentless commitment to superior<br />
customer service<br />
• A decentralised and empowered organisation<br />
• Significant growth opportunities for the future<br />
<strong>Inchcape</strong> is a leader in 14 of the 26 developed<br />
and emerging markets where it operates.<br />
Contents<br />
Section One<br />
Business review 01-49<br />
Overview<br />
01 Financial highlights<br />
02 Uniquely positioned worldwide<br />
04 Our business at a glance<br />
06 Chairman’s statement<br />
Strategy<br />
10 Group Chief Executive’s strategic review<br />
20 Key performance indicators<br />
22 Operating review<br />
36 Financial review<br />
38 Principal risks<br />
40 Corporate responsibility<br />
Section Two<br />
Governance 50-77<br />
52 Board of Directors<br />
54 Executive Committee<br />
56 Corporate governance report<br />
62 Investor relations<br />
68 Remuneration report<br />
75 Directors’ report<br />
Section Three<br />
Financial statements 78-144<br />
Group financial statements<br />
78 Consolidated income statement<br />
79 Consolidated statement of comprehensive income<br />
80 Consolidated statement of financial position<br />
81 Consolidated statement of changes in equity<br />
82 Consolidated statement of cash flows<br />
83 Accounting policies<br />
90 Notes to the accounts<br />
135 Five year record<br />
136 <strong>Report</strong> of the Auditors – Group<br />
Company financial statements<br />
137 Company balance sheet<br />
138 Accounting policies<br />
139 Notes to the accounts<br />
144 <strong>Report</strong> of the Auditors – Company<br />
Section Four<br />
Shareholder information<br />
Inside back cover<br />
Company details<br />
Financial calendar<br />
Key<br />
More online<br />
More inside
Section<br />
One<br />
Business<br />
review<br />
Financial highlights<br />
<strong>Inchcape</strong> has delivered a resilient financial performance generating<br />
record cash flow in 2009 despite the economic downturn.<br />
Sales<br />
£5.6bn<br />
-10.8%<br />
Cash generated<br />
from operations<br />
£336.7m<br />
+83.3%<br />
Net assets<br />
£1,089.7m<br />
+6.9%<br />
£4.5bn<br />
£4.8bn<br />
£6.1bn<br />
£6.3bn<br />
£5.6bn<br />
05<br />
06<br />
07<br />
08<br />
09<br />
Operating profit<br />
before exceptional items<br />
£175.2m<br />
-27.2%<br />
Profit before tax<br />
before exceptional items<br />
£155.1m<br />
-18.7%<br />
£189.4m<br />
£213.9m<br />
£265.0m<br />
£240.5m<br />
£175.2m<br />
£190.3m<br />
£213.9m<br />
£235.1m<br />
£190.7m<br />
£155.1m<br />
5.0p<br />
6.0p<br />
6.2p<br />
5.0p<br />
2.7p<br />
£591.2m<br />
£651.0m<br />
£837.8m<br />
£1,019.6m<br />
£1,089.7m<br />
05<br />
06<br />
07<br />
08<br />
09<br />
Adjusted earnings<br />
per share*<br />
before exceptional items<br />
2.7p<br />
-46.0%<br />
05<br />
06<br />
07<br />
08<br />
09<br />
05<br />
06<br />
07<br />
08<br />
09<br />
05<br />
06<br />
07<br />
08<br />
09<br />
Operating profit<br />
£156.8m<br />
-0.8%<br />
Profit before tax<br />
£136.7m<br />
+26.3%<br />
£176.4m<br />
£213.9m<br />
£269.9m<br />
£158.0m<br />
£156.8m<br />
£177.3m<br />
£213.9m<br />
£240.0m<br />
£108.2m<br />
£136.7m<br />
4.6p<br />
6.3p<br />
6.4p<br />
1.9p<br />
2.3p<br />
£195.4m<br />
£236.8m<br />
£293.0m<br />
£183.7m<br />
£336.7m<br />
05<br />
06<br />
07<br />
08<br />
09<br />
Earnings per share*<br />
2.3p<br />
+21.1%<br />
05<br />
06<br />
07<br />
08<br />
09<br />
05<br />
06<br />
07<br />
08<br />
09<br />
05<br />
06<br />
07<br />
08<br />
09<br />
* Restated to reflect the bonus element of the Rights Issue<br />
www.inchcape.com 1
Business review<br />
Overview<br />
Uniquely positioned worldwide<br />
to take advantage of the global recovery<br />
<strong>Inchcape</strong> operates retail<br />
and distribution businesses<br />
on a global scale.<br />
Global footprint<br />
With a scale presence in 26<br />
markets and a leadership<br />
position in 14,we are the most<br />
international FTSE 350 listed<br />
retailer*,operating in many of<br />
the world’s strongest economies<br />
with exposure to both developed<br />
and emerging markets.<br />
Proven<br />
business model<br />
Our resilient business model with<br />
distribution and retail market<br />
channels,a differentiating<br />
Customer 1st strategy and<br />
decentralised organisation have<br />
been proven over six years of<br />
record growth prior to the<br />
global downturn.<br />
Industry leading<br />
processes<br />
Our industry leading business<br />
processes are focused on<br />
achieving customer-centric<br />
operational excellence around<br />
the world,providing insights on<br />
key trends and benchmarking<br />
opportunities across the Group.<br />
Strongest<br />
brand partners<br />
We partner with the world’s leading<br />
automotive manufacturers whose<br />
brands consistently outperform<br />
the industry.<br />
* Between 2003 and 2008 (calendarised), <strong>Inchcape</strong> has been the most international UK FTSE 350<br />
listed general retailer, based on the percentage of operating profit outside of the UK<br />
2<br />
<strong>Inchcape</strong> plc ¦ <strong>Annual</strong> <strong>Report</strong> and Accounts 2009
Section<br />
One<br />
Business<br />
review<br />
Strengthened<br />
competitive position<br />
<strong>Inchcape</strong>’s competitive position<br />
has grown even stronger during<br />
the economic downturn,giving us<br />
an excellent growth platform for<br />
the upturn.<br />
Diversified<br />
revenue streams<br />
Our balanced income streams<br />
deliver growth opportunities<br />
alongside consistent,recurring<br />
aftersales income.<br />
Growth opportunities<br />
in developed and<br />
emerging markets<br />
We expect customer demand for<br />
greener technology will drive vehicle<br />
replacement in developed markets,<br />
whilst in emerging markets low car<br />
ownership and increasing wealth will<br />
drive new demand.<br />
Financial firepower<br />
We have a strong balance sheet<br />
and the financial firepower to take<br />
advantage of industry consolidation<br />
opportunities.<br />
www.inchcape.com 3
Business review<br />
Overview<br />
Our business<br />
at a glance<br />
We partner with the world’s<br />
leading automotive brands<br />
in 26 developed and<br />
emerging markets,<br />
generating revenue from<br />
four value drivers...<br />
• Vehicle sales<br />
• Finance and<br />
insurance products<br />
• Servicing<br />
• Parts<br />
...through distribution,retail<br />
and vertically integrated<br />
retail (VIR) market channels.<br />
Australasia<br />
<strong>Inchcape</strong> operates a multi<br />
brand retail strategy in<br />
Australia and is the distributor<br />
for Subaru in Australia and<br />
New Zealand.<br />
Brand partners<br />
Market channels<br />
Europe<br />
<strong>Inchcape</strong> operates distribution<br />
and retail across four western<br />
European markets – Belgium,<br />
Greece, Finland and<br />
Luxembourg.<br />
Brand partners<br />
Market channels<br />
Financial highlights<br />
Sales<br />
£762.8m 6.0%<br />
2008: £719.3m<br />
Trading profit<br />
£37.9m 10.2%<br />
2008: £42.2m<br />
Financial highlights<br />
Sales<br />
£1,006.1m 18.2%<br />
2008: £1,229.2m<br />
Trading profit<br />
£28.6m 29.6%<br />
2008: £40.6m<br />
Key<br />
Contribution<br />
to Group profit<br />
Contribution<br />
to Group profit<br />
Distribution<br />
Retail<br />
19.5% 14.7%<br />
Vertically integrated retail (VIR)<br />
Trading profit: Defined as operating profit excluding the<br />
impact of exceptional items and unallocated central costs<br />
More on pages 24-25 More on pages 26-27<br />
4<br />
<strong>Inchcape</strong> plc ¦ <strong>Annual</strong> <strong>Report</strong> and Accounts 2009
Section One<br />
One<br />
Business<br />
review<br />
North Asia<br />
South Asia<br />
United Kingdom<br />
Russia and<br />
Emerging Markets<br />
<strong>Inchcape</strong> operates a multi<br />
brand vertically integrated<br />
retail model in Hong Kong,<br />
Macau, Guam and Saipan.<br />
<strong>Inchcape</strong> operates a multi<br />
brand vertically integrated retail<br />
model in Singapore and Brunei.<br />
<strong>Inchcape</strong> operates a scale<br />
retail business with premium<br />
and premium-volume brand<br />
partners in key regions.<br />
<strong>Inchcape</strong> operates VIR in the<br />
Baltics,Africa, South America,<br />
distribution and retail in the<br />
Balkans; and retail in Russia,<br />
China, and Poland.<br />
Brand partners<br />
Brand partners<br />
Brand partners<br />
Brand partners<br />
Market channel<br />
Market channel<br />
Market channels<br />
Market channels<br />
Financial highlights<br />
Financial highlights<br />
Financial highlights<br />
Financial highlights<br />
Sales<br />
£312.2m 17.5%<br />
2008: £378.5m<br />
Sales<br />
£548.2m 2.3%<br />
2008: £536.0m<br />
Sales<br />
£2,085.7m 10.9%<br />
2008: £2,340.1m<br />
Sales<br />
£868.7m 17.8%<br />
2008: £1,056.7m<br />
Trading profit<br />
£19.9m 48.6%<br />
2008: £38.7m<br />
Trading profit<br />
£55.9m 11.3%<br />
2008: £63.0m<br />
Trading profit<br />
£46.7m 102.2%<br />
2008: £23.1m<br />
Trading profit<br />
£5.0m 88.2%<br />
2008: £42.5m<br />
Contribution<br />
to Group profit<br />
Contribution<br />
to Group profit<br />
Contribution<br />
to Group profit<br />
Contribution<br />
to Group profit<br />
10.3% 28.8%<br />
24.1% 2.6%<br />
More on pages 28-29 More on pages 30-31 More on pages 32-33 More on pages 34-35<br />
www.inchcape.com 5
Business review<br />
Overview<br />
Chairman’s statement<br />
confidence and lack of credit availability.<br />
However, with the gradual thawing of global<br />
credit markets and falling interest rates,<br />
assisted by government incentive schemes<br />
in several markets, 2009 global car sales<br />
outperformed most expectations. Globally,<br />
the industry sold just over 63m vehicles in<br />
2009, a 3.9% decline from 2008 and a 5.1%<br />
decline from 2007*.<br />
Of particular note, China became the<br />
world’s largest car market in 2009,<br />
surpassing the USA. Car sales in China<br />
surged some 50% to 12.9m* vehicles in<br />
2009,driven by government incentives on<br />
fuel efficient vehicles and increasing<br />
demand for car ownership.<br />
Strategy<br />
<strong>Inchcape</strong> has responded swiftly<br />
and decisively to an unprecedented<br />
global downturn.The Group’s focus<br />
continues to be on customer service<br />
and we have gained share in most<br />
of our markets,while cutting costs<br />
and reducing inventory.We are well<br />
positioned for the future.<br />
Ken Hanna<br />
Chairman<br />
This is my first year as Chairman of<br />
<strong>Inchcape</strong> plc and despite challenging<br />
trading conditions in most of our markets<br />
around the world I am pleased to report<br />
results for 2009 above our expectations<br />
with particularly impressive cash generation.<br />
This has demonstrated the resilience of<br />
<strong>Inchcape</strong>’s business model, the success of<br />
our self-help measures and an outstanding<br />
level of leadership and commitment from<br />
our employees.<br />
Automotive industry<br />
At the start of 2009, the global automotive<br />
industry faced a rapid and unprecedented<br />
downturn driven by falling consumer<br />
We have remained true to our differentiating<br />
Customer 1st strategy which has enabled<br />
us to both strengthen our market position<br />
and to further cement our relationships with<br />
our manufacturer brand partners.At the<br />
same time, management has remained<br />
focused on five self-help measures: growing<br />
market share; growing aftersales; reducing<br />
costs; managing working capital; and<br />
selective capital expenditure investment.<br />
These measures have generated a strong<br />
cash performance with a cost base and<br />
levels of working capital that are well below<br />
those at the end of 2008.<br />
Performance<br />
As a result of the unprecedented decline in<br />
the global car markets, Group sales have<br />
decreased by 10.8% to £5.6bn for the full<br />
year to 31 December 2009. On a like for like,<br />
constant currency basis, sales fell by 14.6%.<br />
We began our swift response to changing<br />
market conditions in the fourth quarter of<br />
2008 when we implemented a number of<br />
restructuring measures to reduce our cost<br />
base. During the last quarter of 2008 and<br />
early 2009 we closed 31 less profitable sites<br />
and reduced our workforce by 2,350 people.<br />
These actions generated annualised cost<br />
savings of approximately £70m.<br />
Profit before tax and exceptional items of<br />
£155.1m was 18.7% lower than 2008 and<br />
adjusted earnings per share fell 46% to 2.7p<br />
(adjusted for the bonus element of the<br />
Rights Issue). On a statutory basis, profit<br />
before tax was £136.7m, 26.3% above 2008.<br />
Cash generated from operations during<br />
the year was £336.7m which is the highest<br />
* Source: Global Insight<br />
6<br />
<strong>Inchcape</strong> plc ¦ <strong>Annual</strong> <strong>Report</strong> and Accounts 2009
Section<br />
One<br />
Business<br />
review<br />
level generated by the Group since 2000<br />
and represents a 215% conversion of<br />
operating profit.<br />
Debt reduction<br />
The Group has historically maintained an<br />
appropriate level of borrowings based on<br />
a prudent balance sheet strategy. Given<br />
the precipitous decline in economic<br />
conditions seen at the end of 2008 and<br />
the challenging trading environment<br />
forecast for 2009, the Board announced<br />
an equity raise via a Rights Issue in March<br />
2009 which was completed in April 2009.<br />
This enabled us to reduce our debt and<br />
strengthen the capital structure of the<br />
Group.I would like to thank our shareholders<br />
for their support.<br />
The net proceeds of £234.3m raised by this<br />
Rights Issue together with the actions we<br />
took to restructure our cost base and<br />
reduce working capital, together with the<br />
benefits of our geographic spread and<br />
diversified revenue streams, enabled us to<br />
be in a net cash position at year end.<br />
Acquisition and disposals<br />
During 2009 we made an earn out payment<br />
of US$35m and a further US$5m will be paid<br />
in 2010 in relation to the acquisition of the<br />
75.1% interest in the Musa Motors group,one<br />
of Russia’s largest car retailers.Whilst the<br />
Russian car market has been challenging<br />
in 2009 and we expect this environment to<br />
continue in 2010, we are confident that due<br />
to our scale position and the low levels of<br />
car ownership, our investment in Russia has<br />
placed us in a strong position to benefit<br />
when the market rebounds.<br />
Capital expenditure<br />
Whilst in 2009 we reduced our discretionary<br />
capital expenditure in agreement with<br />
our brand partners, we have continued to<br />
make strategic investments, opening nine<br />
greenfield sites across the world.<br />
Board<br />
After 15 years with the Group, Peter Johnson<br />
retired as Non-Executive Chairman and I<br />
was delighted to be appointed to the role<br />
with effect from 14 May 2009. I would like<br />
to thank Peter for his years of service and I<br />
feel privileged to be working with so many<br />
talented colleagues both on the Board<br />
and throughout the business.<br />
There have been a number of other<br />
changes to the Board. On 14 May 2009<br />
Graham Pimlott was appointed as<br />
Chairman of the Audit Committee, with<br />
Raymond Ch’ien and Karen Guerra both<br />
retiring as Non-Executive Directors.<br />
Following three years with the Group and<br />
the successful completion of the Rights<br />
Issue, Barbara Richmond, Group Finance<br />
Director, left the Group at the end of June.<br />
John McConnell was appointed to the<br />
position with effect from 1 October 2009<br />
and joined the Board as an Executive<br />
Director. John was formerly CEO <strong>Inchcape</strong><br />
Australasia, before that CFO and has 10<br />
years’ experience with the Group.<br />
Also, we were pleased to announce the<br />
appointment of two new Non-Executive<br />
Directors with effect from 1 July 2009:Alison<br />
Cooper, who is currently Chief Operating<br />
Officer, Chief Executive Designate and<br />
board member of Imperial Tobacco Group<br />
plc, joined the Board and has also become<br />
a member of the Audit Committee; Nigel<br />
Northridge, currently Chairman of Paddy<br />
Power plc, Senior Independent Director<br />
of Aggreko plc and Chairman of<br />
Debenhams plc, joined the Board and<br />
has also become a member of the<br />
Remuneration and Audit Committees.<br />
Dividend<br />
In line with our disclosure in last year’s <strong>Annual</strong><br />
<strong>Report</strong> and Accounts and in the Prospectus<br />
published at the time of the Rights Issue, the<br />
Board is not recommending the payment of<br />
an ordinary dividend for the year in light of<br />
the challenging trading conditions.<br />
Whilst no decision has been made as yet<br />
concerning a dividend in 2010, we intend<br />
to return to our stated aim of maintaining<br />
a progressive dividend policy as soon as<br />
trading conditions allow.<br />
Share consolidation<br />
The Board intends to propose a 1 for 10<br />
consolidation of <strong>Inchcape</strong> plc ordinary<br />
shares.The purpose of the share<br />
consolidation is to reduce the total number<br />
of shares now in issue following the Rights<br />
Issue undertaken in 2009 and to increase<br />
the likely price of the Company’s shares to a<br />
figure more appropriate for a listed company<br />
of its size and nature in the UK market.The<br />
share consolidation is subject to approval<br />
by shareholders at the <strong>Annual</strong> General<br />
Meeting to be held on 13 May 2010.<br />
Following the share consolidation there is<br />
expected to be approximately 460m<br />
<strong>Inchcape</strong> ordinary shares in issue, reduced<br />
from approximately 4.6bn at present.<br />
Approach to governance<br />
and corporate responsibility<br />
We continue to focus on the importance of<br />
good governance and apply the Combined<br />
Code and other relevant guidance for<br />
listed companies in our global operations.<br />
Integrating socially responsible behaviour<br />
into every aspect of how we operate and<br />
define ourselves remains high on our<br />
agenda. In 2009 we have built on the<br />
foundations of a global approach to<br />
corporate responsibility that is making<br />
responsible economic, environmental and<br />
social behaviour intrinsic to the way we work.<br />
People<br />
On behalf of the Board, I wish to express my<br />
sincere thanks to all our colleagues across<br />
the Group for their commitment and<br />
support throughout the extremely<br />
challenging trading conditions in 2009.<br />
Outlook<br />
<strong>Inchcape</strong> is uniquely positioned in the global<br />
car industry and in 2009 the Group has<br />
continued to outperform its competitors.<br />
Whilst we expect market conditions in 2010 to<br />
remain challenging,the Group is well placed<br />
to benefit from the market recovery and to<br />
take advantage of industry consolidation<br />
opportunities in the medium term.<br />
Ken Hanna<br />
Chairman<br />
www.inchcape.com 7
Official opening of<br />
Lexus Shanghai,China<br />
In 2009,we opened nine sites in<br />
strategic locations around the<br />
world.Our third retail centre in<br />
China,Lexus Shanghai,is in one of<br />
the most dynamic,flourishing cities<br />
in the world.The centre is over<br />
19,000m 2 with an impressive array<br />
of customer areas and services.<br />
8<br />
<strong>Inchcape</strong> plc ¦ <strong>Annual</strong> <strong>Report</strong> and Accounts 2009
Section<br />
One<br />
Business<br />
review<br />
Business review<br />
10 Group Chief Executive’s strategic review<br />
20 Key performance indicators<br />
22 Operating review<br />
36 Financial review<br />
38 Principal risks<br />
40 Corporate responsibility<br />
www.inchcape.com<br />
9
Business review<br />
Strategy<br />
Group Chief Executive’s<br />
strategic review<br />
<strong>Inchcape</strong> is uniquely positioned<br />
worldwide.We are a leading<br />
independent international automotive<br />
distributor and retailer who has<br />
delivered a record cash performance<br />
in the downturn by creating great value<br />
from great brands.We are strongly<br />
positioned for the global recovery.<br />
André Lacroix<br />
Group Chief Executive<br />
Sales<br />
£5.6bn<br />
-10.8%<br />
£4.5bn<br />
£4.8bn<br />
£6.1bn<br />
£6.3bn<br />
£5.6bn<br />
Operating profit<br />
before exceptional items<br />
£175.2m<br />
-27.2%<br />
£189.4m<br />
£213.9m<br />
£265.0m<br />
£240.5m<br />
£175.2m<br />
Cash generated<br />
from operations<br />
£336.7m<br />
+83.3%<br />
£195.4m<br />
£236.8m<br />
£293.0m<br />
£183.7m<br />
£336.7m<br />
<strong>Inchcape</strong> is a leading independent,<br />
international automotive distributor and<br />
retailer, with scale operations in Australia,<br />
Belgium, Greece, Hong Kong, Russia,<br />
Singapore and the UK as well as operations<br />
in 19 other markets.We represent some of<br />
the world’s leading automotive brands with<br />
whom we have long-standing relationships.<br />
The <strong>Inchcape</strong> management team has<br />
reacted decisively to the unprecedented<br />
global slowdown in car sales witnessed in<br />
the latter part of 2008 and in early 2009 by<br />
focusing on five key operational priorities:<br />
to build market share; to grow our aftersales<br />
business; to reduce our costs; to manage<br />
our working capital by controlling inventory;<br />
and to limit capital expenditure to<br />
committed strategic investments.<br />
These actions, together with our decision<br />
to strengthen our capital structure and<br />
reduce debt through a Rights Issue<br />
completed in April 2009 with the support of<br />
our shareholders,has meant the Group has<br />
ended 2009 in a significantly stronger<br />
position than we entered it.<br />
<strong>Inchcape</strong> is in a net cash position, has<br />
gained share in many of its key markets, has<br />
enjoyed a resilient aftersales performance<br />
(approximately 50% of Group gross margin)<br />
and has significantly reduced the cost of<br />
doing business. Our operating cash flow<br />
was the highest achieved since 2000 and<br />
was almost twice our operating profit<br />
(before exceptional items) as we reduced<br />
our stock. Further, we have strengthened our<br />
balance sheet which will enable the Group<br />
to trade effectively, invest in working capital<br />
and to take advantage of the upturn.<br />
During the Company’s 160 plus year history,<br />
<strong>Inchcape</strong> has invariably emerged from a<br />
time of crisis stronger and more resilient.<br />
Although we expect a continuation of<br />
difficult trading conditions in many of our<br />
markets until well into the second half of<br />
2010, I am confident that we are uniquely<br />
positioned as the global industry leader to<br />
grasp the opportunities of recovery when<br />
they emerge.<br />
In that context, I would like to emphasise<br />
why we believe that the medium to long<br />
term outlook for <strong>Inchcape</strong> is very exciting.<br />
05<br />
06<br />
07<br />
08<br />
09<br />
05<br />
06<br />
07<br />
08<br />
09<br />
05<br />
06<br />
07<br />
08<br />
09<br />
10<br />
<strong>Inchcape</strong> plc ¦ <strong>Annual</strong> <strong>Report</strong> and Accounts 2009
Section<br />
One<br />
Business<br />
review<br />
Uniquely positioned<br />
Focused strategy<br />
Vision<br />
To be the world’s most customer<br />
centric automotive retail group<br />
Strategy<br />
Strengthen<br />
Customer-focused<br />
operational<br />
excellence in<br />
every site<br />
Core Purpose<br />
To create the ultimate<br />
customer experience<br />
for our brand partners<br />
Strategy<br />
Expand<br />
Consolidation in<br />
high margin/high<br />
growth areas<br />
Key strengths<br />
Resilient<br />
business 1 model<br />
Unique<br />
2 approach<br />
Decentralised<br />
and empowered 3 organisation<br />
Uniquely<br />
4 positioned<br />
for the future<br />
Our broad geographic<br />
spread, scale and<br />
diversified activities give us<br />
balanced expansive and<br />
defensive capabilities, so<br />
we can grasp growth<br />
opportunities by selling<br />
more vehicles, finance and<br />
insurance products and<br />
draw upon consistent<br />
streams of revenue from<br />
vehicle servicing and the<br />
sale of parts.<br />
Our unwavering Customer<br />
1st focus driven by our<br />
unique <strong>Inchcape</strong><br />
Advantage programme<br />
succeeds in creating the<br />
greatest possible value<br />
from the world’s leading<br />
automotive brands in every<br />
market where we operate,<br />
constantly strengthening<br />
our relationships with<br />
our brand partners and<br />
our customers.<br />
Our empowered local<br />
management teams have<br />
a deep understanding of<br />
regional trends and<br />
customer preferences.The<br />
speed and decisiveness<br />
with which they responded<br />
to the onset of recession<br />
through a focus on our five<br />
key priorities enabled us to<br />
manage the impact of the<br />
downturn and emerge<br />
from 2009 with improved<br />
customer service, a lower<br />
cost base and in a net<br />
cash position.<br />
With our unique business<br />
model, long standing<br />
brand partner relationships,<br />
diverse geographic spread,<br />
financial strength, scale<br />
operations and engaged<br />
people, we believe<br />
<strong>Inchcape</strong> is in a unique<br />
position to continue to<br />
outperform our competitors<br />
and to benefit from the<br />
global market recovery.<br />
More on pages 12-13<br />
More on pages 14-15<br />
More on pages 16-17<br />
More on pages 18-19<br />
www.inchcape.com<br />
11
Business review<br />
Strategy<br />
Group Chief Executive’s<br />
strategic review continued<br />
Resilient business model<br />
We operate scale retail and distribution<br />
businesses in 26 markets across the world<br />
and are a leader in 14 of these. Our core<br />
brand partners, with whom we have longstanding<br />
relationships, have a history of<br />
outperforming the market.<strong>Inchcape</strong>’s global<br />
scale of operation is unique in our industry.<br />
Our business model is further strengthened<br />
by the Group’s broad geographic spread,<br />
which embraces developed markets (like<br />
Australia,the UK and other western European<br />
countries together with powerful Asian<br />
centres like Hong Kong and Singapore),<br />
and emerging markets (such as Russia,<br />
China and other central and eastern<br />
European states) and is unequalled. Our<br />
diversity has spread risk, as decline in some<br />
markets has been balanced by strength<br />
in others. It also gives us a vital presence<br />
in those emerging markets where sales<br />
potential is highest and which,in the fullness<br />
of time, we believe will deliver the best<br />
returns thanks to our efficient retail footprint.<br />
We also match the demands and<br />
opportunities in each territory with the<br />
appropriate channel strategy.<br />
In small to medium sized markets, we<br />
predominantly operate as country<br />
distributors, where we become the<br />
custodian of brands like Toyota, Lexus and<br />
Subaru to manage every step of the journey<br />
between the factory and the end customer.<br />
This demands our deep involvement with<br />
our brand partners, as well as developing<br />
local brand, marketing and sales strategies,<br />
finance products, aftersales servicing, parts<br />
and accessories, plus managing sales via<br />
a mix of <strong>Inchcape</strong>-owned retail centres<br />
and third-party independent dealerships.<br />
In larger markets like the UK and Russia,<br />
manufacturers use their own national sales<br />
companies to distribute and appoint<br />
independent dealers. In these markets, we<br />
operate a retail service that is increasingly<br />
focused on bigger, better sites that deliver<br />
an enhanced customer experience and<br />
provide scale volume for our sales and<br />
aftersales activities, including servicing,<br />
parts and accessories.<br />
In the city state markets of Hong Kong<br />
and Singapore and a number of central<br />
European states, we operate a ‘vertically<br />
integrated retail’ (VIR) model where we<br />
are both the distributor and the exclusive<br />
retailer, enabling us to deliver heightened<br />
efficiencies and strong margins through<br />
our management of the entire value chain.<br />
<strong>Inchcape</strong> has a mix of growth and<br />
defensive value drivers, which gives the<br />
Group a diversity of revenue streams. Our<br />
growth drivers are new and used vehicle<br />
sales together with associated finance<br />
and insurance products, which are<br />
particularly important to facilitate the sales<br />
process. Defensive drivers are our resilient<br />
parts and aftersales servicing businesses,<br />
which in 2009 represented approximately<br />
50% of our Group gross margin.<br />
We are in close partnership with many<br />
of the best known and most respected<br />
automotive brands in the world.These are<br />
strong, innovative brands that outperform<br />
and lead the market based on years of<br />
investment, to create deep customer<br />
relationships through constant technological<br />
advance and continuous improvement.<br />
1<br />
Resilient<br />
business<br />
model<br />
Our business model<br />
enables growth,<br />
spreads risk,and<br />
delivers resilience.<br />
It is fundamental<br />
to our position as<br />
a global leader.<br />
12<br />
<strong>Inchcape</strong> plc ¦ <strong>Annual</strong> <strong>Report</strong> and Accounts 2009
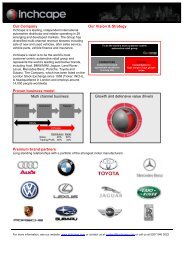
The <strong>Inchcape</strong> business model<br />
Section<br />
One<br />
Business<br />
review<br />
Our defensive drivers become increasingly important<br />
in times of economic difficulty<br />
Defensive drivers <br />
• Growth and<br />
defensive<br />
value drivers<br />
• Diversified<br />
multi-channel<br />
business<br />
model<br />
Vehicle<br />
Service<br />
sales<br />
Retail<br />
Distribution<br />
Parts<br />
Finance and insurance<br />
• Broad<br />
geographic<br />
spread<br />
• Strong brand<br />
partnerships<br />
Growth drivers <br />
Our growth drivers give us opportunities<br />
to drive our business forward<br />
Growth and defensive value drivers<br />
Vehicle sales<br />
As fewer, better retail centres<br />
drive efficiencies, our scale<br />
operations present the best<br />
performing manufacturer<br />
brands with superior<br />
operating and customer<br />
facing processes.<br />
Finance and<br />
insurance products<br />
While credit has been harder<br />
for customers to arrange<br />
during the downturn, our<br />
ability to organise finance<br />
has supported sales,<br />
reassured customers<br />
and provided income.<br />
Service<br />
Strong customer relationships,<br />
a high level of customer<br />
service, trained technicians<br />
and hi-tech resources give<br />
us a source of competitive<br />
advantage.<br />
Parts<br />
Ensuring customers have<br />
immediate access to<br />
genuine spare parts from<br />
our manufacturer brand<br />
partners both strengthens<br />
relationships along the value<br />
chain and provides a resilient<br />
source of revenue.<br />
Strong brand partners<br />
We are proud of our portfolio<br />
of winning brands which<br />
outperform and lead the<br />
market. Our long-standing<br />
relationships with the world’s<br />
leading manufacturers have<br />
created strong partnerships<br />
at both a national and<br />
international level.<br />
Broad geographic spread<br />
We have scale positions across 26 developed and<br />
emerging markets.We benefit from a decentralised<br />
organisational model which enables us to stay<br />
close to changes in the marketplace and react<br />
quickly to flex our operational focus.<br />
Multi channel business<br />
Distribution<br />
In markets where <strong>Inchcape</strong> is<br />
the distributor,we effectively<br />
become the custodian of the<br />
manufacturer’s brands,<br />
handling every aspect of their<br />
operation as the national sales<br />
and marketing company.<br />
Retail<br />
As a retailer,<strong>Inchcape</strong>’s<br />
strategy is to have scale<br />
operations on a regional basis<br />
with premium brands and to<br />
leverage the benefits of<br />
diversified income streams.<br />
Vertically integrated<br />
retail (VIR)<br />
In city state markets,where<br />
we are both the exclusive<br />
distributor and the exclusive<br />
retailer,we deliver a seamless<br />
brand experience and drive<br />
superior returns,leveraging<br />
our scale position with<br />
leading market shares.<br />
www.inchcape.com 13
Business review<br />
Strategy<br />
Group Chief Executive’s<br />
strategic review continued<br />
Unique approach:<br />
<strong>Inchcape</strong> Advantage is our<br />
competitive advantage<br />
To extract the greatest value from this unique<br />
global infrastructure, we have a clear and<br />
simple vision, to be ‘the world’s most<br />
customer-centric automotive retail group’.<br />
Our industry is generally not known for the<br />
quality of its customer service and our<br />
approach is based on a simple insight: if we<br />
look after people and their cars better than<br />
the competition,customers are more likely to<br />
choose us; and if we perform demonstrably<br />
better for our brand partners than our<br />
competitors, manufacturers are more likely<br />
to expand their global business with us.<br />
By successfully continuing to implement<br />
our strategy for improved customer service,<br />
based on our unique <strong>Inchcape</strong> Advantage<br />
programme, we increased market share in<br />
many of our markets in 2009, despite tough<br />
decision-making that led to the closure of<br />
underperforming sites and a reduction<br />
in headcount.<br />
Through <strong>Inchcape</strong> Advantage, customer<br />
service is truly at the heart of the business,<br />
from the top of the company to the sales<br />
floor and service workshop. It is intrinsic to<br />
the way that every <strong>Inchcape</strong> person works,<br />
ensuring that providing superior service is<br />
present and evident at every stage of the<br />
customer journey.<br />
As a result, we believe we are the most<br />
advanced company in our industry in<br />
implementing cutting edge retail techniques<br />
and technologies.Among other initiatives<br />
we manage a continuous mystery shopper<br />
programme to maintain the highest<br />
standards of in-centre service; we interview<br />
around 12,000 customers every month to<br />
identify precisely what we do well and what<br />
we should do better; and we constantly<br />
track a wide range of customer metrics –<br />
from footfall and test drives to leads and<br />
conversion rates.<br />
Our global online portal (winner of a<br />
Microsoft Innovation Award) is used to<br />
interrogate this data, enabling local<br />
performance management and the<br />
sharing of information across the Group to<br />
learn on a daily basis from the experience<br />
of our businesses across the world.These<br />
leading indicators and a real time view<br />
of our customers provide us with valuable<br />
insights into changing consumer<br />
preferences and behaviours, effectively<br />
accelerating our response and enabling us<br />
to grasp new opportunities as they emerge.<br />
These proprietary retail processes are<br />
truly unique in the automotive sector.They<br />
are a vital point of differentiation across<br />
our business and the foundation stone of<br />
the operational excellence that gives us<br />
a key advantage as we expand into<br />
emerging markets.<br />
2<br />
Unique<br />
approach<br />
Through our superior<br />
customer processes,<br />
we deliver the<br />
ultimate customer<br />
experience and<br />
create maximum<br />
value for our brand<br />
partners across the<br />
world.<br />
14<br />
<strong>Inchcape</strong> plc ¦ <strong>Annual</strong> <strong>Report</strong> and Accounts 2009
The <strong>Inchcape</strong> Advantage<br />
Section One<br />
One<br />
Business<br />
review<br />
<strong>Inchcape</strong> Advantage is a systematic, Group wide<br />
continuous improvement programme that is at<br />
the heart of our strategic commitment to<br />
strengthening our business through customercentric<br />
operational excellence.<br />
The outstanding quality of service it drives is<br />
proven to set us apart from our competitors,<br />
building tangible customer loyalty that makes<br />
potential buyers more likely to deal with us<br />
than with anybody else.<br />
In an industry not renowned for putting the<br />
customer first, <strong>Inchcape</strong> Advantage is our<br />
competitive advantage.<br />
The customer funnel<br />
Purchase<br />
Customer<br />
data<br />
Traffic<br />
Leads<br />
Test drives<br />
Capture rate<br />
Enquiries<br />
Bookings<br />
Lead time<br />
Capture rate<br />
Ownership<br />
Identify<br />
focus areas<br />
& recognise<br />
progress<br />
Service excellence<br />
Group wide Customer 1st processes,<br />
staff training and retail systems drive<br />
quality.<br />
<strong>Inchcape</strong> Advantage portal<br />
Portal allows rigorous daily performance<br />
management,recording data from all<br />
retail centres to identify areas for focus<br />
and the sharing of best practice.<br />
Customer management<br />
Targeted retention programmes help<br />
us to take care of our customers as<br />
well as their cars.<br />
Mystery shopper<br />
Our global mystery shopper<br />
programme helps drive service<br />
improvement in every retail centre.<br />
Net Promoter Score (NPS)<br />
customer feedback programme<br />
We interview around 12,000 buyers<br />
and non-buyers each month across<br />
both sales and aftersales to measure<br />
satisfaction and provide customer<br />
insight to drive performance.<br />
Innovation sharing<br />
Leveraging the benefits of the<br />
<strong>Inchcape</strong> Advantage portal to<br />
quickly share innovation.<br />
Superior customer service<br />
We are convinced that the real<br />
differentiator is,increasingly,the<br />
customer experience.Superior<br />
customer service is a sustainable<br />
competitive advantage for us through<br />
our metrics and proprietary <strong>Inchcape</strong><br />
Advantage processes,delivered<br />
consistently through all of our retail<br />
centres across the globe.<br />
We interview over<br />
140,000 customers<br />
per year<br />
www.inchcape.com 15
Business review<br />
Strategy<br />
Group Chief Executive’s<br />
strategic review continued<br />
Decentralised and empowered<br />
organisation<br />
I believe that this unique position also<br />
extends to the quality of our global and<br />
regional management teams, on whose<br />
personal judgement and freedom to make<br />
decisions so much depends.<br />
It is our people across the world who<br />
have enabled us to deliver a performance<br />
in 2009 that was ahead of our own<br />
expectations and which improved as the<br />
year progressed. Revenues declined year<br />
on year but due to our committed<br />
operational focus, we ended 2009 with<br />
a robust gross margin performance,strong<br />
cash flows, improved customer service<br />
globally and increased market share<br />
in many territories across the world.<br />
This performance was due, in no small part,<br />
to the tight management of our five key<br />
priorities – growing market share, growing<br />
aftersales, reducing costs, managing<br />
working capital, and selective capital<br />
expenditure investment – augmented by<br />
the in depth personal knowledge that our<br />
local management teams have of their<br />
markets. Our decentralised structure<br />
enables management to act swiftly with<br />
relevant, local, innovative propositions to<br />
meet the particular needs and preferences<br />
of their customer base, ensuring that a<br />
localised customer focus builds on our<br />
global strategy.<br />
High quality people are vital to ensure that<br />
the business model works, and I would like<br />
to thank all our employees for playing a<br />
fundamental role in delivering a record<br />
operating cash flow in 2009.<br />
3<br />
Decentralised<br />
and<br />
empowered<br />
organisation<br />
The unprecendented<br />
economic crisis<br />
brought out the best<br />
in our organisation,<br />
achieving success<br />
through a balanced<br />
approach to cost and<br />
cash initiatives as well<br />
as superior customer<br />
service and strong<br />
market share<br />
performance.<br />
Five Key Priorities<br />
Growing<br />
market share<br />
Reducing<br />
costs<br />
Managing<br />
working<br />
capital<br />
Growing<br />
aftersales<br />
Controlling<br />
capital<br />
expenditure<br />
16<br />
<strong>Inchcape</strong> plc ¦ <strong>Annual</strong> <strong>Report</strong> and Accounts 2009
Global experience<br />
Section<br />
One<br />
Business<br />
review<br />
The decline in new car sales that we saw<br />
begin in late 2008 was unprecedented.We<br />
immediately narrowed our management<br />
focus across the world to five key priorities.<br />
The speed and decisiveness with which<br />
we responded was the result of the many<br />
years collective industry experience and<br />
a deep personal understanding shared by<br />
our local managers of what really matters<br />
in their markets.<br />
As a result of actions taken at the end of<br />
2008 and during 2009,we ended the year<br />
in a far stronger competitive and financial<br />
position than we entered it.<br />
<strong>Inchcape</strong> Group Executive Committee<br />
Outperforming the downturn – our Five Key Priorities<br />
1<br />
Growing<br />
market<br />
share<br />
2<br />
Growing<br />
aftersales<br />
3<br />
Reducing<br />
costs<br />
4<br />
Managing<br />
working<br />
capital<br />
5<br />
Controlling<br />
capital<br />
expenditure<br />
We have<br />
succeeded in<br />
improving customer<br />
service in all of our<br />
operations and<br />
gaining share<br />
in most of our<br />
key markets.<br />
Despite the<br />
downturn, our<br />
aftersales business<br />
has remained<br />
resilient thanks to<br />
the quality of our<br />
customer service,<br />
effective marketing<br />
campaigns and our<br />
approach to<br />
customer retention.<br />
We reduced like for<br />
like costs by c.£70m<br />
at constant<br />
currency during<br />
2009, having taken<br />
the difficult decision<br />
to close 31 less<br />
profitable sites<br />
and reduce our<br />
workforce by<br />
2,350 people.<br />
In reducing our<br />
inventory by 28.7%<br />
in comparison with<br />
the end of 2008,<br />
we were able to<br />
destock faster than<br />
we expected and<br />
release cash from<br />
working capital.<br />
Our investment<br />
activities have been<br />
selective and have<br />
focused on the<br />
opening of nine<br />
new strategic<br />
greenfield sites in key<br />
markets to reach<br />
large and valuable<br />
customer clusters.<br />
Market leader<br />
Share of gross margin<br />
<strong>Annual</strong>ised benefit<br />
Inventory reduction<br />
Capital expenditure<br />
Number 1<br />
in 14 markets<br />
c.50%<br />
Group gross margin<br />
c.£70m<br />
Like for like<br />
-28.7%<br />
Year on year<br />
-57.5%<br />
Year on year<br />
www.inchcape.com 17
Business review<br />
Strategy<br />
Group Chief Executive’s<br />
strategic review continued<br />
Uniquely positioned for the future<br />
I believe that the future for <strong>Inchcape</strong>, its<br />
employees, brand partners and<br />
shareholders is very exciting.<br />
While we remain cautious about the timing<br />
of the market recovery, we certainly believe<br />
that no competitor is better placed than<br />
<strong>Inchcape</strong>, both to weather any continuing<br />
impact of the downturn and to grasp<br />
the opportunities that recovery will bring.<br />
We consider <strong>Inchcape</strong> to be uniquely<br />
positioned worldwide to take advantage of<br />
the global upturn for a number of reasons.<br />
We are one of the most international of FTSE<br />
350 listed retailers, having delivered 83% of<br />
trading profit outside of the UK in the last six<br />
years. Our diversified geographic portfolio<br />
has scale businesses in 26 developed and<br />
emerging markets and we are a leader in<br />
14 of these.<br />
Our resilient business model, with distribution<br />
and retail channels,differentiating Customer<br />
1st strategy and empowered management<br />
has a proven track record.<br />
Our portfolio of the world’s strongest<br />
automotive brands consistently outperforms<br />
the industry.<br />
Our balance of revenue streams provides us<br />
with both growth opportunities and recurring<br />
aftermarket income.<br />
Our leading, customer-centric operational<br />
processes introduced with our <strong>Inchcape</strong><br />
Advantage programme,have improved our<br />
competitive position globally.<br />
Our competitive position has grown<br />
stronger over the last year, both in terms<br />
of customer service and market share,<br />
providing us with an excellent growth<br />
platform for the future.<br />
We expect customer demand for greener<br />
technology to drive vehicle replacement in<br />
developed markets and we are partnered<br />
with manufacturers committed to investing<br />
in the newest technology and greener<br />
vehicles. In the emerging markets, where<br />
we have scale operations and the car<br />
ownership levels are relatively low, the<br />
increase in wealth will grow demand.<br />
We believe consolidation of a fragmented<br />
market to be inevitable. <strong>Inchcape</strong> will<br />
benefit from increased market share and<br />
the desire of manufacturers to seek new<br />
retail or distribution partners with the<br />
strongest companies.We have the financial<br />
firepower to invest in the best strategic<br />
opportunities to give us and our brand<br />
partners access to markets with strong<br />
future wealth and growth potential.<br />
We outperformed the market in 2009.<br />
I believe that we will continue to outperform<br />
our competitors in 2010 and that <strong>Inchcape</strong><br />
is uniquely positioned worldwide to benefit<br />
from the global market recovery in 2011<br />
and beyond.<br />
André Lacroix<br />
Group Chief Executive<br />
4<br />
Uniquely<br />
positioned<br />
for the future<br />
We are well placed<br />
to take advantage of<br />
the economic upturn.<br />
Our unique business<br />
model,long-standing<br />
brand partner<br />
relationships,diverse<br />
geographic presence,<br />
financial strength,<br />
scale operations,<br />
decentralised<br />
and empowered<br />
organisation are our<br />
key strategic assets.<br />
18<br />
<strong>Inchcape</strong> plc ¦ <strong>Annual</strong> <strong>Report</strong> and Accounts 2009
Superior customer service driving growth<br />
in sales and aftersales<br />
<strong>Inchcape</strong> Advantage<br />
processes deliver<br />
consistent,superior<br />
customer experience<br />
to drive growth<br />
in vehicle sales<br />
and aftersales.<br />
Growth opportunities in mature markets<br />
Increase in demand<br />
for greener / low cost<br />
of usage vehicles<br />
will accelerate the<br />
replacement cycle<br />
in mature markets.<br />
Section<br />
One<br />
Business<br />
review<br />
Growth opportunities in emerging markets*<br />
Financial firepower to take advantage<br />
of consolidation<br />
Wealth increase and low levels of car ownership will grow<br />
demand in emerging markets<br />
2004-2014 compound annual growth rate<br />
5.0%<br />
4.0%<br />
3.0%<br />
2.0%<br />
1.0%<br />
0<br />
*Source Global Insight<br />
Low growth, high car ownership:<br />
N. America, W. Europe<br />
0<br />
High growth, low car ownership:<br />
Asia, S. America, E. Europe<br />
100 200 300 400 500 600<br />
2009 Cars per 1,000 population<br />
<strong>Inchcape</strong> is in a<br />
unique position as<br />
a well financed<br />
global operator with<br />
a strong track record<br />
to take advantage<br />
of scale expansion<br />
opportunities<br />
at the right time<br />
in the right markets.<br />
*At swap foreign exchange rates<br />
Committed facilities<br />
£980m*<br />
Forecast global sales<br />
85<br />
Global car sales forecast to grow over 30% between 2009 and 2014*<br />
80<br />
75<br />
+30%<br />
70<br />
Millions<br />
65<br />
60<br />
55<br />
50<br />
2004<br />
2005<br />
2006<br />
2007<br />
2008<br />
2009<br />
2010<br />
2011<br />
2012<br />
2013<br />
2014<br />
*Source Global Insight<br />
www.inchcape.com 19
Business review<br />
Strategy<br />
Key Performance Indicators (KPIs)<br />
These KPIs are how we measure<br />
the success of our business<br />
Key performance indicators<br />
The <strong>Inchcape</strong> plc Board of<br />
Directors and the Group<br />
Executive Committee monitor<br />
the Group’s progress against<br />
its strategic objectives and the<br />
financial performance of the<br />
Group’s operations on a regular<br />
basis. Performance is assessed<br />
against the strategy, budgets<br />
and forecasts.<br />
We also measure the quality<br />
of revenues through the mix of<br />
revenue streams, and the flow<br />
through of value from sales<br />
revenue to trading profit.<br />
Sales<br />
Definition<br />
Defined as the<br />
consideration receivable<br />
from the sale of goods<br />
and services. It is stated<br />
net of rebates and any<br />
discounts and excludes<br />
sales related taxes.<br />
Trading profit<br />
Definition<br />
Defined as operating<br />
profit excluding the<br />
impact of exceptional<br />
items and unallocated<br />
central costs.<br />
Trading margin<br />
Definition<br />
Calculated by dividing<br />
trading profit by sales.<br />
Achievements in 2009<br />
Achievements in 2009<br />
Achievements in 2009<br />
Thanks to the growth in<br />
our market share, our<br />
sales decline was limited<br />
to 10.8% despite the<br />
severity of the global<br />
economic downturn.<br />
Trading profit declined by<br />
22.4% in 2009 driven by<br />
the significant market<br />
declines across the<br />
Group’s regions.<br />
Resilient trading margin<br />
of 3.5% achieved in<br />
challenging trading<br />
conditions, offset by<br />
significant cost savings.<br />
Sales<br />
Trading profit<br />
Trading margin<br />
£5.6bn<br />
-10.8%<br />
£4.5bn<br />
£4.8bn<br />
£6.1bn<br />
£6.3bn<br />
£5.6bn<br />
Australasia 19.5%<br />
Europe 14.7%<br />
North Asia 10.3%<br />
South Asia 28.8%<br />
UK 24.1%<br />
Russia and Emerging<br />
Markets 2.6%<br />
£194.0m<br />
3.5%<br />
05<br />
06<br />
07<br />
08<br />
09<br />
20<br />
<strong>Inchcape</strong> plc ¦ <strong>Annual</strong> <strong>Report</strong> and Accounts 2009
Section<br />
One<br />
Business<br />
review<br />
Like for like sales and<br />
trading profit<br />
Profit before tax and<br />
exceptional items<br />
Working capital<br />
Cash generated from<br />
operations<br />
Definition<br />
Definition<br />
Definition<br />
Definition<br />
Excludes the impact of<br />
acquisitions from the date<br />
of acquisition until the 13th<br />
month of ownership and<br />
businesses that are sold or<br />
closed.It further removes the<br />
impact of retail centres that<br />
are relocated.This is from the<br />
date of opening until the<br />
13th month of trading in the<br />
new location.These<br />
numbers are presented in<br />
constant currency.<br />
Represents the profit<br />
made after operating<br />
and interest expense but<br />
before tax is charged<br />
excluding the impact of<br />
exceptional items.<br />
Defined as inventory,<br />
receivables, payables, and<br />
supplier related credit.<br />
Defined as trading profit<br />
adjusted for depreciation,<br />
amortisation and other<br />
non cash items plus the<br />
change in working capital<br />
and provisions.<br />
Achievements in 2009<br />
Achievements in 2009<br />
Achievements in 2009<br />
Achievements in 2009<br />
Like for like sales and<br />
trading profit declined as<br />
anticipated in 2009 due<br />
to the significant fall in the<br />
majority of our markets.<br />
Profit before tax and<br />
exceptional items<br />
decreased by 19% in 2009<br />
due to the global market<br />
downturn.<br />
Our stock cover target<br />
was achieved seven<br />
months ahead of plan.<br />
Total working capital<br />
reduced by £176m in<br />
2009, a 69.6% reduction<br />
on 2008.<br />
As a result of cost saving<br />
and working capital<br />
reductions, operating<br />
cash flow grew by 83.3%<br />
to £336.7m in 2009.<br />
Like for like sales<br />
and trading profit<br />
Profit before tax<br />
and exceptional items<br />
£155.1m<br />
-18.7%<br />
Working capital<br />
£77m<br />
-69.6%<br />
Cash generated<br />
from operations<br />
£336.7m<br />
Like for like sales<br />
£5.2bn<br />
<br />
14.6%<br />
Like for like trading profit<br />
£194.8m<br />
<br />
29.0%<br />
£190.3m<br />
£213.9m<br />
£235.1m<br />
£190.7m<br />
£155.1m<br />
£253m<br />
-69.6%<br />
£77m<br />
+83.3%<br />
05<br />
06<br />
07<br />
08<br />
09<br />
2008<br />
2009<br />
www.inchcape.com 21
Business review<br />
Strategy<br />
Operating review<br />
Group<br />
Our resilient global business model<br />
and proven strategy has delivered<br />
a solid financial performance in the<br />
face of an unprecedented downturn.<br />
John McConnell<br />
Group Finance Director<br />
Across Europe, we delivered resilient margin<br />
in distribution despite the continued<br />
downturn. In Greece, where the market<br />
declined by 18.8%, our Toyota and Lexus<br />
business retained its market leadership<br />
position.Although the Belgian market fell by<br />
12.6% we maintained our market share<br />
under very competitive circumstances.<br />
Although the market in Hong Kong<br />
improved in the fourth quarter of 2009, it<br />
was down 28.3% for the full year and we<br />
remained market leader despite strong<br />
pricing activity from our competitors. In<br />
Singapore the market slowed down further<br />
in the second half as new car quota sizes<br />
were reduced by the government. However,<br />
our strong marketing campaigns and lower<br />
parallel imports led to a 3.7ppts gain in<br />
market share to 21.4%.<br />
In a year that saw the car market in<br />
Australia decline by 7.4% we improved<br />
our market share by 0.1ppts.<br />
While our Russia and Emerging Markets<br />
segment has been significantly affected<br />
by the continued downturn, it remains<br />
profitable and the Group gained market<br />
share in the Baltics and the Balkans.<br />
Retail business<br />
The unprecedented downturn which<br />
began in the second half of 2008 and<br />
continued throughout 2009 has significantly<br />
impacted the global demand for new<br />
and used vehicles.We faced extremely<br />
challenging trading conditions in all of our<br />
markets across the world and although we<br />
saw improvements in a few markets in the<br />
second half of 2009, particularly the UK and<br />
Australia, overall, total registrations in all of<br />
our markets were considerably down<br />
compared with 2008 for the full year.<br />
Despite these significant market declines,<br />
the Group has delivered resilient results<br />
with sales of £5.6bn, a decline of 16.6% at<br />
constant currency for the year. Our swift<br />
response to market challenges,with a focus<br />
on our five key operational priorities of<br />
growing market share, growing aftersales,<br />
reducing costs, managing working capital<br />
and selective capital expenditure has been<br />
reflected in a Group operating profit of<br />
£175.2m before exceptional items, down<br />
from £240.5m in 2008.<br />
The restructuring carried out at the end of<br />
2008 and in the second quarter of 2009 has<br />
resulted in annualised like for like cost savings<br />
of c.£70m.This has resulted in a trading<br />
margin of 3.5%, down from 4.0% in 2008.<br />
The Group has reduced working capital<br />
by £176m in 2009 and our stock target<br />
of 1.5 months was achieved earlier than<br />
expected.This, together with our other self<br />
help measures has enabled the Group to<br />
deliver cash generated from operations<br />
significantly ahead of expectations,<br />
generating £336.7m, 83.3% better than<br />
2008 (at actual rate).<br />
The strong cash generation from operations<br />
combined with the proceeds from the<br />
Rights Issue enabled the Group to repay<br />
a significant portion of its borrowings.The<br />
Group ended the year with £0.8m of net<br />
cash compared to a net debt of £407.8m<br />
in 2008.<br />
Distribution business<br />
Our distribution businesses have been<br />
resilient despite the global decline in car<br />
markets resulting in sales of £2.4bn, a<br />
decline of 19.7% and a robust 5.7% trading<br />
margin, resulting in a trading profit of<br />
£137.6m, a decline of 37.7% on 2008.<br />
Although sales declined by 14.1% versus<br />
2008, trading margins improved by 0.2ppts<br />
delivering a trading margin of 1.8% as a<br />
result of our self help measures put in place<br />
at the start of the year to deliver a trading<br />
profit of £56.4m.<br />
In the UK we delivered solid results,<br />
outperforming the market which fell by 6.4%,<br />
to deliver a like for like sales decline of 3.9%.<br />
With the beneficial impact of the<br />
scrappage scheme and a significantly<br />
reduced cost base, we generated a growth<br />
in trading profit of 48.6% and 34.6% on a like<br />
for like basis.<br />
Our Australasian retail business delivered<br />
a strong trading profit 15.2% higher than the<br />
prior year and a trading margin of 3.9%,<br />
an improvement of 0.6ppts.<br />
Across Europe we have continued to focus<br />
on delivering excellent customer service in<br />
very challenging trading environments.<br />
In our Russia and Emerging Markets<br />
businesses, sales decreased by 1.6%.<br />
Trading conditions remained extremely<br />
challenging, however we finished the<br />
year with a trading profit of £4.0m.<br />
22<br />
<strong>Inchcape</strong> plc ¦ <strong>Annual</strong> <strong>Report</strong> and Accounts 2009
Section<br />
One<br />
Business<br />
review<br />
Regional analysis<br />
For the year ended 31 December 2009, the<br />
Group adopted IFRS 8‘Operating Segments’.<br />
IFRS 8 replaces IAS 14 ‘Segment <strong>Report</strong>ing’<br />
and is effective for reporting periods<br />
beginning on or after 1 January 2009. IFRS 8<br />
requires operating segments to be identified<br />
on the basis of internal reports about<br />
components of the Group that are regularly<br />
reviewed by the chief operating decision<br />
maker in order to assess their performance<br />
and to allocate resources to the segments.<br />
These operating segments are then<br />
aggregated into reporting segments to<br />
combine those with similar characteristics.<br />
In contrast, the predecessor standard<br />
required the Group to identify two sets of<br />
segments (business and geographical),<br />
using a risks and rewards approach.<br />
Under IFRS 8, Group businesses previously<br />
reported within the Rest of World segment<br />
under IAS 14 are reported within the<br />
other segments that best match the<br />
characteristics of each individual business.<br />
As a result, the Group’s reportable segments<br />
for 2009 are as below.<br />
Distribution<br />
Australasia<br />
Europe<br />
North Asia<br />
South Asia<br />
United Kingdom<br />
Russia and<br />
Emerging Markets<br />
Retail<br />
Australasia<br />
Europe<br />
United Kingdom<br />
Russia and<br />
Emerging Markets<br />
Included within the Russia and Emerging<br />
Markets segment are Russia, China, South<br />
America,Africa, the Balkans, the Baltics and<br />
Poland; on the basis that prior to the global<br />
downturn these markets had entered the<br />
growth phase of their development cycle<br />
and we expect these markets to return to that<br />
growth phase in the medium term.These<br />
changes require comparative segmental<br />
information to be restated accordingly.<br />
Our results are stated at actual rates<br />
of exchange.However,to enhance<br />
comparability,we also present year on year<br />
changes in sales and trading profit in<br />
constant currency thereby isolating the<br />
impact of exchange.Unless otherwise stated,<br />
changes in sales and trading profit in the<br />
operating review are at constant currency.<br />
Performance indicators – Results<br />
Year ended Year ended % change<br />
31.12.2009 31.12.2008 in constant<br />
£m £m % change currency<br />
Sales 5,583.7 6,259.8 (10.8) (16.6)<br />
Trading profit 194.0 250.1 (22.4) (30.0)<br />
Trading margins (%) 3.5 4.0 (0.5)ppt (0.7)ppt<br />
Like for like sales 5,223.1 5,713.1 (8.6) (14.6)<br />
Like for like trading profit 194.8 248.1 (21.5) (29.0)<br />
Like for like sales (decline)/growth (%) (8.6) 2.6 (11.2)ppt<br />
Like for like trading profit (decline) (%) (21.5) (16.1) (5.4)ppt<br />
Working capital 76.7 252.5 (69.6)<br />
Cash generated from operations 336.7 183.7 83.3<br />
Business analysis<br />
Sales<br />
Regional analysis<br />
Year ended Year ended % change<br />
31.12.2009 31.12.2008 in constant<br />
£m £m % change currency<br />
Distribution 2,427.0 2,654.7 (8.6) (19.7)<br />
Retail 3,156.7 3,605.1 (12.4) (14.1)<br />
Trading profit<br />
Distribution 137.6 192.9 (28.7) (37.7)<br />
Retail 56.4 57.2 (1.4) 0.2<br />
2009 2009 2009 2008 2008 2008<br />
Operating Exceptional Trading Operating Exceptional Trading<br />
profit items profit profit items profit<br />
£m £m £m £m £m £m<br />
Australasia 37.9 – 37.9 40.9 (1.3) 42.2<br />
Europe 26.8 (1.8) 28.6 33.6 (7.0) 40.6<br />
North Asia 19.9 – 19.9 38.6 (0.1) 38.7<br />
South Asia 55.9 – 55.9 63.0 – 63.0<br />
United Kingdom 43.7 (3.0) 46.7 – (23.1) 23.1<br />
Russia and<br />
Emerging Markets (7.1) (12.1) 5.0 (7.1) (49.6) 42.5<br />
Central costs (20.3) (1.5) (11.0) (1.4)<br />
Operating profit 156.8 (18.4) 158.0 (82.5)<br />
www.inchcape.com 23
Business review<br />
Strategy<br />
Operating review continued<br />
Australasia<br />
Brand partners<br />
Spencer Lock<br />
Chief Executive Officer<br />
<strong>Inchcape</strong> Australasia<br />
Our Australasian segment encompasses our<br />
businesses in Australia and New Zealand.<br />
Key financial highlights<br />
Contribution to<br />
Group sales<br />
Contribution to<br />
Group profit<br />
Financial highlights<br />
Sales<br />
Year ended Year ended % change<br />
31.12.2009 31.12.2008 in constant<br />
£m £m % change currency<br />
Retail 284.4 263.2 8.1% (1.8)%<br />
Distribution 478.4 456.1 4.9% (4.4)%<br />
Like for like sales<br />
Retail 270.5 252.1 7.3% (2.5)%<br />
Distribution 478.4 456.1 4.9% (4.4)%<br />
Trading profit<br />
Retail 11.2 8.9 25.8% 15.2%<br />
Distribution 26.7 33.3 (19.8)% (27.2)%<br />
Like for like trading profit<br />
Retail 10.6 8.8 20.5% 10.1%<br />
Distribution 26.7 33.3 (19.8)% (27.2)%<br />
Trading margin<br />
Retail 3.9% 3.4% 0.5ppt 0.6ppt<br />
Distribution 5.6% 7.3% (1.7)ppt (1.7)ppt<br />
Cash generated from operations<br />
Retail 17.8 5.9 201.7%<br />
Distribution 29.6 39.3 (24.7)%<br />
13.7% 19.5%<br />
Sales<br />
£762.8m 6.0%*<br />
2008: £719.3m<br />
Trading profit<br />
£37.9m 10.2%*<br />
2008: £42.2m<br />
Operational highlights for the year<br />
• Record Subaru market share<br />
• Strong aftersales performance<br />
• Record retail operating profit<br />
• Successful launch of new Subaru<br />
Liberty and Outback.Forester leader<br />
in its segment<br />
*at actual exchange rates<br />
More online at www.inchcape.com/ourbusinessmodel/regions<br />
24<br />
<strong>Inchcape</strong> plc ¦ <strong>Annual</strong> <strong>Report</strong> and Accounts 2009
Section<br />
One<br />
Business<br />
review<br />
Franchised retail centres<br />
18<br />
The market<br />
The Australian market declined by 7.4%<br />
compared to 2008, despite government<br />
stimulus packages aimed at the business<br />
consumer that ended in December 2009.<br />
These stimulus packages supported the<br />
light commercial vehicles market in<br />
particular, which was down 1.5%<br />
compared to a decline of 7.9% in the<br />
passenger car segment.<br />
However the market rebounded in the<br />
second half in line with the improving<br />
Australian economy.<br />
In New Zealand, the total market declined<br />
28.0% with commercial vehicles most<br />
affected and the passenger car market<br />
down 25.9%.<br />
Business model and strategy<br />
We are the distributor for Subaru in both<br />
Australia and New Zealand.We have<br />
represented Subaru in Australia since1973.<br />
In addition, we have multi-franchise retail<br />
operations based in Sydney, Melbourne<br />
and Brisbane.These operations hold<br />
franchises for Subaru,Volkswagen, Hyundai,<br />
Mitsubishi and Kia.<br />
To support these operations, we have a<br />
logistics business called AutoNexus, which<br />
is responsible for managing vehicle and<br />
parts inventory, distribution and vehicle<br />
refurbishment on behalf of Subaru Australia,<br />
and our retail business as well as other<br />
independent dealers.<br />
Our strategy for our distribution operations is<br />
to continue to grow market share through<br />
our superior Customer 1st business<br />
processes.<br />
Revenue is principally generated from<br />
vehicle sales, with aftersales a significant<br />
source of both revenue and gross margin.<br />
This strategy is supported by the<br />
development of market specific special<br />
editions and new product specification in<br />
conjunction with Subaru.<br />
Our retail operations are focused on<br />
delivering an outstanding customer<br />
experience for our brand partners and<br />
driving revenue from sales of new cars and<br />
vehicle parts. In addition, we generate<br />
revenue from used cars and through the<br />
sales of finance and insurance products.<br />
Our operating performance<br />
In both of our Australasian distribution<br />
businesses,we have continued to outperform<br />
the market and have grown share. Sales<br />
were down 4.4% in a market which was<br />
down by 7.9% and trading profit was 27.2%<br />
below 2008 at £26.7m,due primarily to a<br />
stronger Japanese Yen (JPY),with a solid<br />
trading margin of 5.6%.<br />
In retail,the business benefited significantly<br />
in 2009 from improved used car margins<br />
as a result of strong demand and lower<br />
inventory levels. In addition, a strong<br />
contribution from aftersales resulted in<br />
a trading profit 15.2% better than 2008<br />
and a record trading margin of 3.9%.<br />
This strong trading profit performance and<br />
our continued focus on working capital<br />
across the segment resulted in cash<br />
generated from operations of £17.8m in<br />
retail and £29.6m in distribution.<br />
Outlook for 2010<br />
The market in Australia was one of the more<br />
resilient in 2009 and we expect that the<br />
positive momentum in the fourth quarter<br />
together with improving economic<br />
conditions and market sentiment will lead to<br />
a small growth overall in the market in 2010.<br />
We expect Subaru to achieve market share<br />
improvements in both Australia and New<br />
Zealand as the benefit of a full year of new<br />
Outback, Liberty, Exiga and Outback diesel<br />
models is realised.<br />
We expect to see fluctuations in currency<br />
rates. However we have already put in place<br />
currency hedging to manage our JPY/AUD<br />
exposure on vehicle and parts purchases<br />
through to the end of the third quarter of<br />
2010 and will implement coverage for the<br />
fourth quarter at the appropriate time.<br />
www.inchcape.com 25
Business review<br />
Strategy<br />
Operating review continued<br />
Europe<br />
Brand partners<br />
George Ashford<br />
Chief Executive Officer<br />
Toyota Belgium<br />
Aris Aravanis<br />
Chairman and Managing<br />
Director Toyota Hellas<br />
Jean Van der Hasselt<br />
Managing Director Nordics,<br />
South America and Africa<br />
The Europe segment includes Belgium,<br />
Luxembourg,Greece and Finland.<br />
Key financial highlights<br />
Contribution to<br />
Group sales<br />
Contribution to<br />
Group profit<br />
Financial highlights<br />
Sales<br />
Year ended Year ended % change<br />
31.12.2009 31.12.2008 in constant<br />
£m £m % change currency<br />
Retail 204.3 391.3 (47.8)% (54.0)%<br />
Distribution 801.8 837.9 (4.3)% (15.6)%<br />
Like for like sales<br />
Retail 187.6 262.9 (28.6)% (37.1)%<br />
Distribution 801.8 837.9 (4.3)% (15.6)%<br />
Trading (loss)/profit<br />
Retail (1.6) 0.7 (328.6)% (299.9)%<br />
Distribution 30.2 39.9 (24.3)% (33.1)%<br />
Like for like trading (loss)/profit<br />
Retail (1.2) 1.0 (220.0)% (210.3)%<br />
Distribution 30.2 39.8 (24.1)% (33.1)%<br />
Trading margin<br />
Retail (0.8)% 0.2% (1.0)ppt (1.0)ppt<br />
Distribution 3.8% 4.8% (1.0)ppt (1.0)ppt<br />
Cash generated from operations<br />
Retail 7.6 10.3 (26.2)%<br />
Distribution 76.6 (27.3) 380.6%<br />
18.0% 14.7%<br />
Sales<br />
£1,006.1m 18.2%*<br />
2008: £1,229.2m<br />
Trading profit<br />
£28.6m 29.6%*<br />
2008: £40.6m<br />
Operational highlights for the year<br />
• Market share growth in Belgium in the<br />
second half following successful new<br />
model launches<br />
• Greece maintained clear market<br />
leadership position through effective<br />
marketing and new products<br />
• Successfully restructured operations<br />
in Finland<br />
*at actual exchange rates<br />
More online at www.inchcape.com/ourbusinessmodel/regions<br />
26<br />
<strong>Inchcape</strong> plc ¦ <strong>Annual</strong> <strong>Report</strong> and Accounts 2009
Section<br />
One<br />
Business<br />
review<br />
The market<br />
In Belgium, in the absence of the biannual<br />
Motor Show last held in 2008 and with no<br />
stimulus package for the motor industry, the<br />
market declined by 12.6%. In Greece the<br />
overall market declined by 18.8% despite a<br />
small recovery mid year as a result of several<br />
government stimuli including a tax incentive<br />
and a short lived scrappage scheme. In<br />
Finland the market declined by 35.2%.<br />
Business model and strategy<br />
In Belgium, we are the distributor for Toyota<br />
and Lexus.We own and operate eight Toyota<br />
and Lexus retail centres, with the remaining<br />
network of 85 retail centres operated by<br />
independent third party retailers.<br />
In Luxembourg, we are the distributor and<br />
retailer of Jaguar,Toyota and Lexus, with one<br />
retail centre for each brand.<br />
In Greece, we are the distributor for Toyota<br />
and Lexus.We operate six retail centres with<br />
the remaining network of 35 Toyota and<br />
Lexus retail centres and 40 authorised<br />
repairers independently owned.<br />
In Finland, we are the distributor for Jaguar,<br />
Land Rover and Mazda with four retail<br />
centres in Helsinki.<br />
We aim to drive growth in market share in<br />
our distribution business and to continue<br />
our turnaround plan for retail. In distribution,<br />
growth will be driven by strong marketing<br />
programmes increasing traffic into the<br />
dealer network, with new model launches<br />
and a focus on operational excellence,<br />
all supported by tight overhead cost control.<br />
In retail, our plan continues to focus on<br />
customer-centric operational excellence<br />
and improvements in footfall conversion.<br />
Our operating performance<br />
Trading conditions across our European<br />
markets remained extremely difficult<br />
throughout the year resulting in trading<br />
profits in our distribution business declining<br />
by 33.1% to £30.2m and a trading loss in<br />
our retail business of £1.6m.<br />
In Belgium the overall market decline led<br />
to strong price competition which resulted<br />
in a broadly flat Toyota market share.<br />
However the new hybrid Prius was launched<br />
in quarter three and we gained share in the<br />
second half of the year.<br />
In the retail business lower new vehicle<br />
sales have been partly mitigated by<br />
sales growth in used vehicles and strong<br />
aftersales performance.<br />
In Greece we maintained clear market<br />
leadership achieving 10.1% share through<br />
effective marketing campaigns and<br />
successfully leveraging new products and<br />
technologies on car models.<br />
In Finland we successfully restructured our<br />
retail operations.<br />
Our focus on working capital and in<br />
particular inventory management has<br />
resulted in strong cash generated from<br />
operations of £7.6m for the retail business,<br />
and £76.6m for distribution, well ahead of<br />
last year.<br />
Outlook for 2010<br />
As a whole we expect the markets in<br />
Europe to continue to face challenging<br />
trading conditions throughout 2010.<br />
In Greece the significant economic<br />
challenges faced by the new government<br />
are expected to lead to a contraction in the<br />
economy and further declines in the market.<br />
We will focus on effective marketing, model<br />
differentiation and price competitiveness in<br />
vehicle sales and aftersales.<br />
In Belgium with the biannual Motor Show<br />
in January and an improving economic<br />
climate we expect the market to remain<br />
broadly stable.A continued focus on driving<br />
customer traffic, superior customer service<br />
and a growth in aftersales will be our aim.<br />
In both Greece and Belgium we will<br />
capitalise on the launch of the upgraded<br />
Toyota Rav4, the Auris and the Yaris.We<br />
will continue to grow aftersales through<br />
service reminder programmes and vehicle<br />
health checks.<br />
In Finland we expect an improving economy<br />
and therefore the industry to stabilise.We<br />
intend to leverage the new Mazda model<br />
launches and current model extensions to<br />
improve our competitive position.<br />
Franchised retail centres<br />
21<br />
www.inchcape.com 27
Business review<br />
Strategy<br />
Operating review continued<br />
North Asia<br />
Brand partners<br />
Patrick Lee<br />
Managing Director<br />
<strong>Inchcape</strong> North Asia<br />
Our North Asia segment contains the Group’s<br />
vertically integrated retail (VIR) operations in<br />
Hong Kong,Macau,Guam and Saipan.<br />
Key financial highlights<br />
Contribution to<br />
Group sales<br />
Contribution to<br />
Group profit<br />
Financial highlights<br />
Year ended Year ended % change<br />
31.12.2009 31.12.2008 in constant<br />
£m £m % change currency<br />
Sales<br />
Distribution 312.2 378.5 (17.5)% (31.3)%<br />
Like for like sales<br />
Distribution 301.0 352.7 (14.7)% (29.0)%<br />
Trading profit<br />
Distribution 19.9 38.7 (48.6)% (57.2)%<br />
Like for like trading profit<br />
Distribution 19.2 35.0 (45.1)% (54.3)%<br />
Trading margin<br />
Distribution 6.4% 10.2% (3.8)ppt (3.9)ppt<br />
Cash generated from operations<br />
Distribution 50.1 35.6 40.7%<br />
5.6% 10.3%<br />
Sales<br />
£312.2m 17.5%*<br />
2008: £378.5m<br />
Trading profit<br />
£19.9m 48.6%*<br />
2008: £38.7m<br />
Operational highlights for the year<br />
• Maintained market leadership position<br />
• Strong growth in aftersales through<br />
innovative marketing programmes<br />
• <strong>Inchcape</strong> in Hong Kong awarded<br />
the Toyota Triple Crown for 17<br />
consecutive years<br />
*at actual exchange rates<br />
More online at www.inchcape.com/ourbusinessmodel/regions<br />
28<br />
<strong>Inchcape</strong> plc ¦ <strong>Annual</strong> <strong>Report</strong> and Accounts 2009
Section<br />
One<br />
Business<br />
review<br />
The market<br />
While the market in Hong Kong declined<br />
by 28.3% versus 2008, an improvement was<br />
seen with the fourth quarter being 40%<br />
higher than the same period in 2008, as<br />
general sentiment improved in line with<br />
economic conditions.<br />
In Guam and Saipan the markets followed<br />
a similar pattern to Hong Kong with<br />
improving conditions leading to growth<br />
in the fourth quarter. However overall the<br />
markets were 9.9% and 20.4% down<br />
respectively on 2008.<br />
Business model and strategy<br />
In Hong Kong and Macau, we are the<br />
distributor for Toyota, Lexus, Hino Trucks,<br />
Daihatsu, Jaguar and Mazda.We operate<br />
VIR for these brand partners in this market.<br />
<strong>Inchcape</strong> has been market leader in Hong<br />
Kong for over 20 years and has won the<br />
Triple Crown award (in recognition of<br />
outstanding customer service, retail<br />
excellence and innovation) from Toyota<br />
Motor Corporation for 17 consecutive years,<br />
the only company in the world to have<br />
done so over such an extended period.<br />
In Guam we are the market leading<br />
distributor and retailer for Toyota, Lexus,<br />
Chevrolet and Scion and in Saipan we are<br />
distributor and retailer for Toyota and Lexus.<br />
Our operating performance<br />
However, our North Asia segment delivered<br />
strong cash flow which at £50.1m was 40.7%<br />
better than 2008, driven by a reduction in<br />
working capital.<br />
Outlook for 2010<br />
We expect the markets in this segment to<br />
continue their gradual recovery in 2010.<br />
In Hong Kong and Macau we will leverage<br />
another strong year of new product<br />
launches from Toyota, Lexus, Mazda and<br />
Jaguar to strengthen our competitive<br />
position. Further we will continue our growth<br />
momentum in aftersales performance<br />
through innovative marketing programmes<br />
and added value packages whilst<br />
maintaining a tight control on costs.<br />
Franchised retail centres<br />
21<br />
<strong>Inchcape</strong>’s market share in Hong Kong of<br />
28.9% was lower than the previous year as<br />
a result of aggressive pricing promotions by<br />
European competitors who were destocking<br />
earlier in the year, a weak performance<br />
of the commercial vehicle segment and<br />
supply issues in the fourth quarter.<br />
These extremely challenging trading<br />
conditions particularly in Hong Kong led<br />
to a sales decline of 31.3% with trading<br />
profit falling by 57.2% and a trading margin<br />
of 6.4%.<br />
www.inchcape.com 29
Business review<br />
Strategy<br />
Operating review continued<br />
South Asia<br />
Brand partners<br />
Koh Ching Hong<br />
Managing Director<br />
<strong>Inchcape</strong> South Asia<br />
The South Asia segment contains the Group’s<br />
VIR operations in Singapore and Brunei.<br />
Key financial highlights<br />
Contribution to<br />
Group sales<br />
Contribution to<br />
Group profit<br />
Financial highlights<br />
Year ended Year ended % change<br />
31.12.2009 31.12.2008 in constant<br />
£m £m % change currency<br />
Sales<br />
Distribution 548.2 536.0 2.3% (11.7)%<br />
Like for like sales<br />
Distribution 548.2 535.9 2.3% (11.7)%<br />
Trading profit<br />
Distribution 55.9 63.0 (11.3)% (23.4)%<br />
Like for like trading profit<br />
Distribution 55.9 62.9 (11.1)% (23.3)%<br />
Trading margin<br />
Distribution 10.2% 11.8% (1.6)ppt (1.6)ppt<br />
Cash generated from operations<br />
Distribution 71.6 67.9 5.4%<br />
9.8% 28.8%<br />
Sales<br />
£548.2m 2.3%*<br />
2008: £536.0m<br />
Trading profit<br />
£55.9m 11.3%*<br />
2008: £63.0m<br />
Operational highlights for the year<br />
• Strengthened our market leadership<br />
position and gained 3.7ppts to 21.4%<br />
market share<br />
• Innovative marketing programmes<br />
drove excellent aftersales<br />
performance<br />
*at actual exchange rates<br />
More online at www.inchcape.com/ourbusinessmodel/regions<br />
30<br />
<strong>Inchcape</strong> plc ¦ <strong>Annual</strong> <strong>Report</strong> and Accounts 2009
Section<br />
One<br />
Business<br />
review<br />
The market<br />
In Singapore, the market declined against<br />
the previous year by 27.9%, due in part to<br />
the continued slowdown in de-registrations,<br />
reduced quota levels from the Singapore<br />
government and consistently higher<br />
Certificate of Entitlement prices throughout<br />
the year. Parallel importers share of the<br />
market declined by 10.8ppts against 2008.<br />
The Brunei vehicle market fell by 5% in 2009.<br />
Business model and strategy<br />
In Singapore, <strong>Inchcape</strong> is the distributor for<br />
Toyota, Lexus, Hino Trucks and Suzuki.We<br />
have represented Toyota in Singapore since<br />
1967 and been Singapore’s market leading<br />
retailer by sales for seven consecutive years<br />
since 2002.We have held the Suzuki<br />
distribution franchise since 1977.<br />
In Brunei we are the distributor and retailer<br />
for both Toyota and Lexus.<br />
Outlook for 2010<br />
2010 will be another challenging year in<br />
Singapore.We expect the market to continue<br />
its decline as a result of the lower quota<br />
sizes announced in October 2009 by the<br />
Singapore government and the expected<br />
continued slowdown in de-registrations.<br />
Our priority will be to strengthen our market<br />
leadership position by capitalising on new<br />
product launches and special editions and<br />
continue to outperform the aftersales market<br />
through enhanced customer management.<br />
Franchised retail centres<br />
10<br />
Our operating performance<br />
<strong>Inchcape</strong> strengthened its market<br />
leading position and grew market share<br />
by 3.7ppts, to achieve a market share of<br />
21.4%.This was largely driven by new<br />
products, the effectiveness of our value for<br />
money marketing programmes and the<br />
weakening of parallel importers due to<br />
the strengthening of the Yen versus the<br />
Singapore Dollar.<br />
Aftersales outperformed the market<br />
through targeted marketing programmes<br />
for vehicles out of warranty.<br />
Our business in Brunei performed well<br />
retaining its market leading position.<br />
Sales fell 11.7%, but in actual terms sales<br />
grew by 2.3% resulting in a trading profit<br />
of £55.9m.<br />
Cash generated from operations for the<br />
region was 5.4% above 2008 at £71.6m,<br />
driven by working capital reductions.<br />
www.inchcape.com 31
Business review<br />
Strategy<br />
Operating review continued<br />
United Kingdom<br />
Brand partners<br />
Connor McCormack<br />
Chief Executive Officer<br />
<strong>Inchcape</strong> UK<br />
In the UK,we have a significant retail business<br />
with 128 franchised retail centres and a focus<br />
on core premium and premium-volume brand<br />
partners.<br />
Financial highlights<br />
Sales<br />
Year ended Year ended % change<br />
31.12.2009 31.12.2008 in constant<br />
£m £m % change currency<br />
Retail 2,055.7 2,319.4 (11.4)% (11.4)%<br />
Distribution 30.0 20.7 44.9% 44.9%<br />
Like for like sales<br />
Retail 1,938.0 2,017.6 (3.9)% (3.9)%<br />
Distribution 30.0 20.7 44.9% 44.9%<br />
Trading profit/(loss)<br />
Retail 42.8 28.8 48.6% 48.6%<br />
Distribution 3.9 (5.7) 168.4% 168.4%<br />
Like for like trading profit/(loss)<br />
Retail 42.8 31.8 34.6% 34.6%<br />
Distribution 3.9 (5.7) 168.4% 168.4%<br />
Trading margin<br />
Retail 2.1% 1.2% 0.9ppt 0.9ppt<br />
Distribution 13.0% (27.5)% 40.5ppt 40.5ppt<br />
Cash generated from operations<br />
Retail 44.9 116.5 (61.5)%<br />
Distribution 10.2 (2.6) 492.3%<br />
Key financial highlights<br />
Contribution to<br />
Group sales<br />
Contribution to<br />
Group profit<br />
37.4% 24.1%<br />
Sales<br />
£2,085.7m 10.9%<br />
2008: £2,340.1m<br />
Trading profit<br />
£46.7m 102.2%<br />
2008: £23.1m<br />
Operational highlights for the year<br />
• <strong>Inchcape</strong> outperformed the market,<br />
gaining share through strong<br />
customer funnel management<br />
• Effective capitalisation on the<br />
government scrappage scheme<br />
• Successfully leveraged demand in the<br />
used car market<br />
• Aftersales proved resilient<br />
More online at www.inchcape.com/ourbusinessmodel/regions<br />
32<br />
<strong>Inchcape</strong> plc ¦ <strong>Annual</strong> <strong>Report</strong> and Accounts 2009
Section<br />
One<br />
Business<br />
review<br />
The market<br />
The government scrappage incentive,<br />
announced in early 2009 (and extended<br />
into early 2010) has had a significant<br />
impact on the 2009 market resulting in a full<br />
year decline of 6.4%, significantly better than<br />
early expectations.Since its introduction, the<br />
scrappage scheme has accounted for over<br />
a fifth of all new car registrations; excluding<br />
the scrappage registrations the market<br />
declined 19.6%.The demand for private<br />
vehicles was better than expected, up<br />
13.7% buoyed by scrappage and<br />
consumers taking advantage of reduced<br />
VAT rates before 31 December 2009.<br />
Business model and strategy<br />
We have scale operations in the core<br />
regions of the South East, Midlands, North<br />
and North East of England with a<br />
streamlined portfolio which focuses on<br />
premium and premium-volume brands.<br />
We aim to create significant differentiation<br />
by delivering an outstanding level of<br />
customer service through our <strong>Inchcape</strong><br />
Advantage programme and to drive growth<br />
in aftersales and car finance penetration.<br />
Our fleet leasing business, <strong>Inchcape</strong> Fleet<br />
Solutions (IFS), offers fleet management<br />
and leasing services to corporate and<br />
government customers.With over 50 years’<br />
experience in the automotive industry, IFS<br />
has a combined fleet size of approximately<br />
41,000 vehicles.This makes up the<br />
distribution element of our UK results.<br />
Our operating performance<br />
We continue to outperform our competitors.<br />
In a market which declined by 6.4%, our<br />
retail business delivered a decline in like for<br />
like sales of 3.9%. Margins in the used car<br />
market were strong on the back of a general<br />
shortage of quality part exchange vehicles.<br />
The solid performance in our used and new<br />
car business together with cost savings<br />
generated by our restructuring have resulted<br />
in a strong trading profit of £42.8m which<br />
was 48.6% higher than 2008, and trading<br />
margin of 2.1%, 0.9ppts better than 2008.<br />
IFS delivered a solid trading profit of £3.9m<br />
following a loss of £5.7m in 2008 in part due<br />
to recovery in used car prices.<br />
Cash generated from operations was £55.1m.<br />
Franchised retail centres<br />
128<br />
Outlook for 2010<br />
2010 will be another challenging year for<br />
the UK car market and our expectation is<br />
for an overall decline versus 2009.<br />
The market has had a significant boost<br />
in 2009 from the scrappage scheme which<br />
is expected to end in March 2010 and<br />
from ‘pull forward’ of orders into the last<br />
quarter of 2009 ahead of the VAT rise on<br />
1 January 2010.<br />
Our priority for 2010 is to continue to grow<br />
market share through superior Customer 1st<br />
processes and capitalising on strong new<br />
product launches from our brand partners.<br />
We will further develop our achievements in<br />
aftersales through prospecting, conversion<br />
and retention programmes.<br />
We will maintain our significant<br />
achievements in working capital reduction<br />
through stock control.<br />
www.inchcape.com 33
Business review<br />
Strategy<br />
Operating review continued<br />
Russia and Emerging Markets<br />
Brand partners<br />
Immo Rupf<br />
Managing Director<br />
<strong>Inchcape</strong> Russia<br />
Bertrand Mallet<br />
Managing Director<br />
Emerging Markets and<br />
Group Strategy Director<br />
Jean Van der Hasselt<br />
Managing Director<br />
Nordics, South America<br />
and Africa<br />
The Russia and Emerging Markets segment<br />
contains the Group’s operations in Russia,<br />
the Balkans,the Baltics,Poland,China,South<br />
America and Africa.<br />
Financial highlights<br />
Sales<br />
Year ended Year ended % change<br />
31.12.2009 31.12.2008 in constant<br />
£m £m % change currency<br />
Retail 612.3 631.2 (3.0)% (1.6)%<br />
Distribution 256.4 425.5 (39.7)% (45.9)%<br />
Like for like sales<br />
Retail 440.6 612.6 (28.1)% (26.8)%<br />
Distribution 227.0 364.7 (37.8)% (44.0)%<br />
Trading profit<br />
Retail 4.0 18.8 (78.7)% (76.2)%<br />
Distribution 1.0 23.7 (95.8)% (96.2)%<br />
Like for like trading (loss)/profit<br />
Retail (1.4) 19.1 (107.3)% (108.1)%<br />
Distribution 8.1 22.1 (63.3)% (65.3)%<br />
Trading margin<br />
Retail 0.7% 3.0% (2.3)ppt (2.1)ppt<br />
Distribution 0.4% 5.6% (5.2)ppt (4.9)ppt<br />
Cash generated from operations<br />
Retail 28.2 0.5 5540.0%<br />
Distribution 56.7 (25.0) 326.8%<br />
Key financial highlights<br />
Contribution to<br />
Group sales<br />
Contribution to<br />
Group profit<br />
15.6% 2.6%<br />
Sales<br />
£868.7m 17.8%*<br />
2008: £1,056.7m<br />
Trading profit<br />
£5.0m 88.2%*<br />
2008: £42.5m<br />
Operational highlights for the year<br />
• Strengthened positions in emerging<br />
markets and well placed to take<br />
advantage of the upturn<br />
• Market share gains in St Petersburg<br />
and Moscow supported by strong<br />
new product launches<br />
• Retained market leadership in South<br />
America and Ethiopia<br />
*at actual exchange rates<br />
More online at www.inchcape.com/ourbusinessmodel/regions<br />
34<br />
<strong>Inchcape</strong> plc ¦ <strong>Annual</strong> <strong>Report</strong> and Accounts 2009
Section<br />
One<br />
Business<br />
review<br />
The market<br />
With the exception of Poland and China,<br />
2009 saw significant declines in most of the<br />
emerging markets. In Russia the market<br />
declined by 49.5% on 2008.The Balkan<br />
markets of Romania and Bulgaria declined<br />
by 53%.The Baltics saw considerable<br />
declines in the market for the full year, down<br />
to 67%. <strong>Inchcape</strong>’s South American markets<br />
fell by 10% in the premium sector and the<br />
Ethiopian market also declined.The new car<br />
market in China is one of the few globally<br />
to have grown in 2009, and became the<br />
largest car market in the world. Despite<br />
these challenging market conditions<br />
<strong>Inchcape</strong> retained or gained market share<br />
in these markets.<br />
Business model and strategy<br />
We operate 20 retail businesses in<br />
St Petersburg and Moscow.<br />
In St Petersburg, we own and operate one<br />
of the largest car retailing businesses in the<br />
city with Toyota, Lexus,Audi and Peugeot.<br />
In 2008, we acquired a 75.1% shareholding<br />
in Musa Motors in Moscow, one of the<br />
largest car retail groups in Russia, providing<br />
the Group with scale presence in the<br />
Moscow region representing eight brands.<br />
We are the distributor for Toyota and Lexus in<br />
Bulgaria and Romania. In Bulgaria we have<br />
increased our presence in Sofia with the<br />
opening of a new retail centre for Toyota in<br />
2009. In addition, we are the distributor for<br />
Toyota and Lexus in Macedonia and Albania.<br />
In Poland, we retail BMW and MINI in<br />
Warsaw and Wroclaw.<br />
In the Baltics, we operate VIR for Mazda,<br />
Jaguar and Land Rover.We are also the<br />
retailer for BMW, Mitsubishi and Hyundai<br />
in these markets.We have market leading<br />
positions in Latvia and in Lithuania.<br />
In China, we have scale Toyota and Lexus<br />
retail centres in Shaoxing.A third scale retail<br />
centre,for Lexus,opened in 2009 in Shanghai.<br />
In Ethiopia we operate VIR for Toyota<br />
through four sites.<br />
In Chile we operate VIR for BMW and retail<br />
for Honda. In Peru we operate VIR for BMW.<br />
Our operating performance<br />
The extremely challenging market<br />
conditions led to a retail sales decline of<br />
1.6% and a distribution sales decline of<br />
45.9%.This resulted in a trading profit of<br />
£4.0m in retail and a trading profit of £1.0m<br />
in distribution. Included in the distribution<br />
trading profit was a one off impairment<br />
charge for land value in Romania of £4.2m.<br />
In Russia we improved our competitive<br />
position as we gained share and remained<br />
profitable with a trading profit of £9.1m.<br />
Our business in Poland continues to perform<br />
ahead of our expectations.We capitalised<br />
on our successful BMW business by opening<br />
a new retail centre in the second half.<br />
In the Balkans we experienced a significant<br />
market decline and pressure on margin, as<br />
all brand partners focused on liquidating<br />
stock throughout the year.<br />
In the Baltics, the extremely low level of<br />
demand through the year and the need<br />
to liquidate stock has also resulted in<br />
margin pressure.<br />
In the combined regions of the Baltics<br />
and Balkans we enjoyed a stronger margin<br />
performance in the second half as we<br />
benefited from our cost restructuring and<br />
the end of our destocking campaigns.<br />
Our performance in China has been<br />
encouraging following the recent opening<br />
of our third showroom for Lexus in Shanghai.<br />
In our business in Ethiopia a focus on<br />
strengthening our core business through the<br />
implementation of customer management,<br />
growing aftersales and prudent cost control<br />
has delivered another good performance.<br />
The market driven declines in new vehicle<br />
sales in our South American markets<br />
were partially compensated for by an<br />
improved sales performance on used<br />
vehicles and aftersales.<br />
Outlook for 2010<br />
With the exception of China we expect<br />
all of these markets to continue to face very<br />
challenging trading conditions in 2010.<br />
We will continue to improve our competitive<br />
position through superior operating and<br />
customer facing processes.<br />
We will benefit from strong new product<br />
launches from our brand partners and will<br />
leverage these with effective marketing<br />
campaigns.<br />
We will continue to grow aftersales through<br />
programmes to drive traffic, improved sales<br />
skills and vehicle health checks.<br />
We will continue our rigorous focus on<br />
product margin, overhead management<br />
and control of working capital.<br />
Franchised retail centres<br />
66<br />
www.inchcape.com 35
Business review<br />
Strategy<br />
Financial review<br />
Delivering solid results above our<br />
expectations despite the unprecedented<br />
global decline in the car industry.<br />
The Group has produced results above<br />
expectations. In addition to the segmental<br />
results, detailed below are the financial<br />
implications of our operational activities.<br />
Central costs<br />
Unallocated central costs for the full year<br />
are £18.8m before exceptional items (2008-<br />
£9.6m). The year on year increase is due to<br />
our extremely low cost base in 2008 as we<br />
did not pay any management bonuses<br />
and benefited from a credit from long-term<br />
share based awards.<br />
Included in central costs is a net gain of<br />
£0.1m from the currency call options taken<br />
out in February 2009 to hedge the currency<br />
impact from a potential strengthening of<br />
Sterling. All options have now been exercised<br />
or lapsed at the end of December 2009.<br />
Joint ventures and associates<br />
The share of profit after tax from joint<br />
ventures decreased by £1.5m to £0.7m in<br />
2009. This is mainly due to the start up costs<br />
of our joint venture in Moscow and lower<br />
profit from our joint venture leasing business<br />
in Belgium.<br />
Exceptional items<br />
The exceptional costs of £18.4m remain the<br />
same as those reported at the half year. We<br />
have taken a prudent view on prospects in<br />
Latvia based on the continued challenging<br />
trading conditions and have taken an<br />
impairment of £10.3m on the carrying value<br />
of the land and buildings. All of the goodwill<br />
relating to Latvia was written off in 2008.<br />
Further restructuring costs of £5.1m were<br />
incurred relating to restructuring in Finland,<br />
the Baltics and Russia and the streamlining<br />
of our European management.<br />
We have also made a provision of £3.0m<br />
related to an onerous lease commitment<br />
on land which was part of the <strong>Inchcape</strong><br />
Automotive business which was sold to<br />
Camden Motors. Camden went into<br />
administration during the first half of the<br />
year. The Group remains responsible for the<br />
head lease on this property.<br />
Net financing costs<br />
Net financing costs of £20.8m are £31.2m<br />
lower than last year, as we benefited from<br />
lower interest rates in the majority of our<br />
markets, reduced debt following the use<br />
of the net proceeds from the Rights Issue<br />
and the cash generated from operations<br />
as a result of significantly lower working<br />
capital. The proceeds from the Rights Issue<br />
were used to pay down US$114m higher<br />
rate US$ loan notes at par, resulting in a<br />
one off benefit of £4.0m from the hedging<br />
arrangements in place for the US$ Private<br />
Placement. The balance was used to pay<br />
down revolving debt. Overall, the hedging<br />
arrangements in place for the US$ Private<br />
Placement resulted in a net gain of £0.9m,<br />
including the £4.0m realised benefit<br />
referred to above.<br />
Tax<br />
The effective tax rate before exceptional<br />
items for the year is 28% compared to 26%<br />
in 2008. This increase arises due to the mix<br />
of profits across the territories in which we<br />
operate. The rate is expected to be similar<br />
in 2010 based on our current assumptions<br />
of profit mix.<br />
Minority interests<br />
Profits attributable to minority interests<br />
reduced to £3.0m from £3.9m in 2008. This<br />
was largely a result of lower profits in our<br />
Lithuanian business and the annualised<br />
impact of the acquisition in the first quarter<br />
of 2008 of the remaining 24.9% interest in<br />
our St Petersburg businesses. At the year<br />
end the Group’s minority interests principally<br />
comprise a 33% minority holding in UAB<br />
Vitvela in Lithuania, a 30% share in NBT<br />
Brunei and a 10% share of Subaru Australia.<br />
Foreign currency<br />
During 2009, the Group benefited by £16.7m<br />
from translation of its overseas profits before<br />
tax into Sterling at the 2009 average<br />
exchange rate.<br />
36<br />
<strong>Inchcape</strong> plc ¦ <strong>Annual</strong> <strong>Report</strong> and Accounts 2009
Section<br />
One<br />
Business<br />
review<br />
Cash flow and net debt<br />
The Group’s operations have proven to be<br />
significantly cash generative in 2009, in spite<br />
of the downturn, with cash generated from<br />
operations of £336.7m. The continued tight<br />
management of working capital, one of the<br />
Group’s five key operating priorities, with<br />
particular focus on inventory and supply<br />
chain management, has been a factor in<br />
the delivery of this result. The Group invested<br />
a total of £50.1m in capital expenditure<br />
across the Group and in addition raised<br />
£234.3m in a successful Rights Issue in April<br />
2009. This has enabled the Group to report<br />
£0.8m of net cash at the end of 2009 versus<br />
£407.8m of net debt at the end of 2008.<br />
In line with the Group’s objectives<br />
announced as part of the Rights Issue<br />
process no interim dividend was paid and<br />
the Board is not recommending a final<br />
dividend for 2009.<br />
we have continued to make strategic<br />
investments by opening nine greenfield<br />
sites across the Group.<br />
The Group also continued with its<br />
implementation plan for a global SAP<br />
system for its operating business with the<br />
first live site in the UK. The next phase of<br />
implementations planned in 2010 are<br />
in the UK and Russia.<br />
John McConnell<br />
Group Finance Director<br />
9 March 2010<br />
Pensions<br />
Following the successful Rights Issue in April<br />
2009 the Group has reviewed and agreed<br />
a revised funding programme with the<br />
Trustees and as a result the Group made<br />
contributions to the UK defined benefit<br />
schemes amounting to £34.7m in 2009, an<br />
increase on 2008. A revision of market and<br />
actuarial assumptions for the UK defined<br />
benefit schemes has resulted in a closing<br />
deficit on Group schemes of £74.8m<br />
compared to a surplus of £6.0m in 2008.<br />
Acquisitions and disposals<br />
The Group agreed on the earn out<br />
payment for the 75.1% acquisition of Musa<br />
Motors business in Moscow and made<br />
a payment of US$35m in October 2009.<br />
A further US$5m is to be made in 2010. The<br />
remaining 24.9% is due to be acquired in<br />
early 2011 for a payment dependent on<br />
2010 EBITA. The Group accounts for Musa<br />
Motors as if it is a wholly owned subsidiary.<br />
Capital expenditure<br />
The Group has worked closely with its<br />
brand partners to minimise the level of<br />
capital expenditure, while maintaining the<br />
required operational standards, and as a<br />
result capital additions reduced from<br />
£117.8m in 2008 to £49.9m in 2009. However<br />
www.inchcape.com 37
Business review<br />
Strategy<br />
Principal risks<br />
The Group applies an effective<br />
system of risk management which<br />
identifies, monitors and mitigates<br />
risks. Further details of the Group’s<br />
risk management process can be<br />
found on pages 60-61.<br />
Risk is a part of doing business; the risk<br />
management system aims to provide<br />
assurance to all stakeholders of the<br />
effectiveness of our control framework in<br />
managing risk against a background of<br />
highly diverse and competitive markets.<br />
The key benefits of the system include<br />
maximised resource efficiency through<br />
controlled prioritisation of issues,<br />
benchmarking between business units,<br />
sharing best practice and effective<br />
crisis management.<br />
The following provides an overview of<br />
the principal business risk areas facing<br />
the Group along with the mitigating<br />
actions in place.<br />
Strategy<br />
Description of risk<br />
Failure to deliver on our five key<br />
areas of strategic focus: growing<br />
market share; growing aftersales;<br />
reducing costs; managing<br />
working capital and controlling<br />
capital expenditure<br />
Impact<br />
We do not increase our profits,<br />
revenues and margins. There may<br />
be an impact on our relationships<br />
with the brand partners whom<br />
we represent<br />
Mitigation<br />
• The Group is investing in its <strong>Inchcape</strong><br />
Advantage and Customer 1st<br />
programmes to ensure that we win<br />
new customers and retain existing<br />
ones – with particular emphasis upon<br />
retaining customer loyalty in respect<br />
of older vehicles<br />
• Group-wide focus on working capital<br />
(particularly aged stock) reduction<br />
• Obtaining favourable credit terms<br />
and making improvements in supply<br />
chain management<br />
• Thorough reviews of all proposed<br />
capital expenditure<br />
Brand partners<br />
and key<br />
relationships<br />
Description of risk<br />
Not sustaining current<br />
relationships with brand partners<br />
Impact<br />
Impact on our ability to retain<br />
existing businesses on contract<br />
renewal and to take on new<br />
opportunities<br />
Mitigation<br />
• Constant focus on performance,<br />
effective communication and<br />
ensuring that our objectives<br />
are closely linked to those of our<br />
brand partners<br />
People<br />
Description of risk<br />
Failure to attract, develop and<br />
retain talent<br />
Impact<br />
Unable to develop business<br />
Employees who lack motivation<br />
Mitigation<br />
• Talent review process<br />
• Internal annual employee<br />
engagement survey<br />
• External benchmarking of<br />
remuneration<br />
• Succession plans in place for<br />
key positions<br />
Reputation<br />
Description of risk<br />
Corporate responsibility risk<br />
Impact<br />
Loss of reputation as a good<br />
corporate citizen<br />
Mitigation<br />
• Global corporate responsibility<br />
programme<br />
38<br />
<strong>Inchcape</strong> plc ¦ <strong>Annual</strong> <strong>Report</strong> and Accounts 2009
Section<br />
One<br />
Business<br />
review<br />
Treasury<br />
Description of risk<br />
Funding and liquidity risk<br />
Impact<br />
Unable to meet obligations within<br />
available committed facilities<br />
Mitigation<br />
• The Group maintains sufficient<br />
committed facilities to meet forecast<br />
debt requirements and ensure<br />
adequate headroom is maintained<br />
Description of risk<br />
Currency risk<br />
Impact<br />
Transactional foreign<br />
exchange exposures<br />
Mitigation<br />
• A significant proportion of<br />
Group trading is denominated<br />
in local currency<br />
• Where possible, foreign exchange<br />
exposures are matched internally<br />
before hedging externally<br />
• Where businesses are billed in<br />
a foreign currency, committed<br />
transactional exposures are hedged<br />
back to the reporting currency<br />
Description of risk<br />
Interest rate risk<br />
Impact<br />
Increase in net interest<br />
Mitigation<br />
• Continuous monitoring of short and<br />
long term rates<br />
• Group policy permits the fixing of gross<br />
borrowings at fixed interest rates if<br />
deemed appropriate by management<br />
Description of risk<br />
Counterparty risk<br />
Impact<br />
Credit losses<br />
Mitigation<br />
• Approved credit parties and limits<br />
with regular review<br />
Legal and<br />
regulatory<br />
Description of risk<br />
Litigation and regulatory risk<br />
Impact<br />
Litigation or breaching the<br />
laws or regulations of the<br />
countries in which we operate<br />
could have a financial and/or<br />
reputational impact<br />
Mitigation<br />
• The Group ensures that it obtains<br />
timely information about forthcoming<br />
changes in legislation and that it<br />
has robust procedures in place to<br />
minimise any risk of detriment or<br />
non-compliance<br />
• Processes are in place which are<br />
aimed at reducing the potential for<br />
litigation and for escalating any<br />
problems which do arise with a view to<br />
managing the exposure appropriately<br />
Pensions<br />
Description of risk<br />
Risk arising out of the Group’s<br />
defined benefit pension funds<br />
Impact<br />
Increase in contributions in the<br />
event of adverse change in the<br />
schemes’ financial position or to<br />
fund increases in future benefits<br />
Mitigation<br />
• The Group maintains an open<br />
dialogue between the Company<br />
and Trustees<br />
• The Group employs specialist staff that<br />
manage the ongoing compliance<br />
and financial health of the schemes<br />
• The schemes’ funding position is<br />
monitored quarterly<br />
www.inchcape.com 39
Business review<br />
Strategy<br />
Corporate responsibility<br />
Corporate responsibility (CR) is very<br />
important to the <strong>Inchcape</strong> Group<br />
and we continue to be committed<br />
to integrating socially responsible<br />
behaviour into every aspect of how<br />
we operate and define ourselves.<br />
Introduction<br />
At <strong>Inchcape</strong>, we recognise that corporate<br />
responsibility (CR) is a long term programme,<br />
constantly building on the foundations of<br />
a global approach to CR that is making<br />
responsible, economic, environmental and<br />
social behaviour intrinsic to the way we work.<br />
<strong>Inchcape</strong>’s CR programme is recognised<br />
by our continued inclusion in the FTSE 4<br />
Good index.We also take part in the<br />
Carbon Disclosure Project’s review.<br />
Our responsibilities<br />
This section of the <strong>Annual</strong> <strong>Report</strong> sets out the<br />
Group’s key principles of its CR programme<br />
and how we have taken further steps in our<br />
CR journey.<br />
CR responsibility is delegated by the Board<br />
to the CR Committee, which has primary<br />
oversight for the programme and for setting<br />
and managing the CR agenda.<br />
At <strong>Inchcape</strong>, we take responsibility for the<br />
impact of our activities on four core areas<br />
and key developments during 2009 have<br />
focused on these:<br />
• our people<br />
• our customers<br />
• our environment<br />
• our communities<br />
In particular, building on our 2008 pilot,<br />
throughout 2009 we have been collecting<br />
data to enable us to measure the Group’s<br />
CO 2 footprint and we discuss these steps on<br />
page 48.We have been developing our CR<br />
initiatives for our customers and our people.<br />
Finally, we have provided highlights of some<br />
of our achievements in respect of the<br />
Group’s impact on the communities within<br />
which the many businesses operate.<br />
Governance and management<br />
Good governance is a fundamental<br />
element of CR.We have clear goals, which<br />
are effectively communicated and have<br />
demonstrated strong leadership, strong<br />
performance management and transparent<br />
reporting.As a UK listed company, we are<br />
required to comply with a variety of<br />
legislation including the Combined Code.<br />
Details on our approach and how we have<br />
complied are set out on pages 56-67.We<br />
have standards that are set for members<br />
of the Group globally within the Subsidiary<br />
Governance Manual defining our policies<br />
and procedures establishing the <strong>Inchcape</strong><br />
‘way of doing business’.<br />
Subsidiary governance<br />
The Group has in place minimum<br />
compliance standards across all of its<br />
subsidiaries.These standards are set out in<br />
the Group’s Subsidiary Governance Manual<br />
and compliance is verified annually<br />
through the year end reporting processes<br />
and through the Internal Audit reviews.<br />
These policies, recognising that there may<br />
be variances in local laws, require that each<br />
subsidiary complies to at least the standard<br />
set out in the Group policy and to a more<br />
stringent standard where required by local<br />
law. In this way, the Group can ensure that<br />
despite variances there is a consistent<br />
approach to business taken across all core<br />
functional activities, including legal,<br />
governance, tax, treasury, finance and HR.<br />
Financial<br />
Financial stability and viability are essential<br />
to the operation of the Company and<br />
therefore the sustainability of the Group and<br />
all its initiatives.As set out on pages 16-17,<br />
we are focusing on our five key priorities.This<br />
will allow us to be efficient with our resources<br />
and to benefit from the growth opportunities<br />
in emerging markets.<br />
Ethical behaviour<br />
The Group’s business ethics policy defines<br />
the core ethical behaviours expected of<br />
employees. In particular, the Group:<br />
• has zero tolerance of bribes or<br />
facilitation payments;<br />
• has zero tolerance of fraud or theft;<br />
• has a strict limit on the value of<br />
corporate hospitality given or received,<br />
including the provision or receipt of gifts;<br />
• does not make political donations<br />
or incur political expenditure;<br />
• seeks to avoid actual or perceived<br />
conflicts of interest;<br />
• prohibits the misuse of information;<br />
• conducts appropriate due diligence<br />
in the selection of our joint venture<br />
and other partners.<br />
Verification and assurance<br />
The Board is responsible for the strategic<br />
direction of all CR and all its initiatives as<br />
part of the risk management programme.<br />
The Board is ultimately accountable to<br />
our shareholders for our CR Programme.<br />
Management of the CR Programme has<br />
been delegated to the CR Committee.<br />
Above all, the CR Committee’s role is to<br />
ensure that our day to day business<br />
operations respond to the opportunities,<br />
and avoid the risks, posed by CR issues.<br />
Through a network of locally based CR<br />
Champions, employees with global and<br />
local responsibilities support the work of the<br />
CR Committee. Our activities are focused<br />
through our CR Aware campaign.<br />
Health and safety is reviewed by Group<br />
health and safety officers and as part of<br />
the Internal Audit Programme.<br />
Human resources data is reviewed<br />
and verified ultimately by the Group HR<br />
Director. Community engagement data<br />
is reviewed by the CR Committee and<br />
the Executive Committee.<br />
Other information presented is reviewed<br />
by the relevant functional experts.<br />
40<br />
<strong>Inchcape</strong> plc ¦ <strong>Annual</strong> <strong>Report</strong> and Accounts 2009
Section<br />
One<br />
Business<br />
review<br />
Progress against<br />
our 2009 goals<br />
Recognising that<br />
CR is a long term<br />
programme,in 2009<br />
we focused on a small<br />
number of core steps<br />
that would cement the<br />
foundations of our CR<br />
Programme and allow<br />
us to develop a world<br />
class approach in the<br />
future.We not only<br />
met,but exceeded<br />
all our goals.<br />
Objective What we did Goal attainment<br />
Build a database from<br />
which to determine CO 2<br />
reduction policies<br />
Collate <strong>Inchcape</strong> CR best<br />
practice policies<br />
• Collated 18 months data<br />
• Reviewed the six month pilot data to ensure that<br />
the methodologies complied with best practice<br />
and industry standards (e.g. as regards conversion<br />
methodologies and approach)<br />
• Refined the data collection process including<br />
key elements<br />
• Validated the data<br />
• Measured CO 2 impact<br />
• Highlighted anomalies and initial trends for review<br />
and additional focus<br />
• Collated best practice from our top six markets<br />
– UK,Belgium,Greece,Australia,Hong Kong,Singapore<br />
• Shared best practices from our core markets<br />
• Expanded the review to include all markets by<br />
verifying and enhancing the best practices with<br />
our global CR Champions<br />
• Developed Group wide best practice policies – what we<br />
can do today and setting ourselves targets for what we<br />
can do in the future<br />
• Rolled out Group wide policies to all markets<br />
• Focused on implementing all the‘what we can do<br />
today’ practices in all markets<br />
Learn about our 2010<br />
objectives on p 49<br />
Refresh CR section of the<br />
<strong>Inchcape</strong> website to raise<br />
awareness across the Group<br />
• Published Group wide policies on the website<br />
• Published information on community projects<br />
• Shared best practice from our global CR Champions<br />
Our CR journey<br />
CR is an evolving journey.We have taken a number of steps which have resulted in significant progress in raising our awareness of<br />
CR issues and in changing the way that we operate and how we can help our customers.We believe that CR is an important part<br />
of our future and we are committed to building on the good work that has been done to date.<br />
The past<br />
160 years<br />
2007<br />
2008<br />
2009<br />
<strong>Inchcape</strong> has a<br />
heritage of integrity<br />
and a history of<br />
caring for its local<br />
markets,its people<br />
and its customers<br />
New Customer 1st<br />
‘strengthen and<br />
expand’corporate<br />
strategy defined<br />
Focus on encouraging<br />
community support<br />
Core purpose<br />
defined,values<br />
refreshed<br />
New people strategy<br />
announced<br />
CR strategy<br />
implemented and<br />
KPIs listed<br />
Focus on CO 2<br />
emissions tracking<br />
for the Group<br />
www.inchcape.com 41
Business review<br />
Strategy<br />
Corporate responsibility continued<br />
Driven by our values<br />
We believe it is the enthusiasm and spirit of our people that will shape and empower<br />
<strong>Inchcape</strong>’s CR culture.We combine the local knowledge,enthusiasm and expertise<br />
of our employees worldwide with our clearly defined values,standards and policies<br />
to enable us to contribute responsibly and sustainably to society.<br />
Our areas of focus<br />
We believe in a focused approach to CR,to<br />
perform the acts that will make a difference<br />
to our people,our communities,our<br />
customers and our environment.<br />
Respect for<br />
each other<br />
Winning<br />
together<br />
Treating every<br />
£ as our own<br />
Integrity without<br />
compromise<br />
Pioneering<br />
new ideas<br />
Passionate<br />
about<br />
customers<br />
Caring for our<br />
environment<br />
People are at the heart of who we are,how we think and how<br />
we act; <strong>Inchcape</strong> is successful because of‘us’.We celebrate<br />
diversity,we value and learn from each other and feel proud to<br />
be working with the best.We have faith in each other and show<br />
each other real loyalty.<br />
We are strong as individuals,but we’re even stronger as a team.<br />
We are part of a rich global network and together we achieve<br />
great things.We enjoy working with each other and always<br />
achieve more when we do.<br />
This is our company and we feel proud to be part of it.We see<br />
cost as a good thing,as long as it creates value.What we hate<br />
is waste,so we think before we spend.<br />
We have no‘hidden agendas’.We have an uncompromising<br />
commitment to transparency and ethical principles.We believe<br />
in a straight talking,human approach.We take personal<br />
responsibility for what we say and do.In an industry not famed<br />
for trust,customers choose us for our clarity,honesty and realism.<br />
An intrepid spirit is the essence of <strong>Inchcape</strong>.We lead our<br />
industry by example.We liberate talent and prize initiative.<br />
We are prepared to take risks drawing on our powerful global<br />
resources of creativity and insight.<br />
We are committed to putting the customer first every time,every<br />
day,everywhere.We are energised by making our customers<br />
feel special,which we do by delivering Brilliant Basics and<br />
creating Magic Moments.<br />
Each one of us plays our part in addressing global concerns<br />
through our local,everyday actions.We integrate an awareness<br />
of our environmental impact with responsible business<br />
decision-making and advance opportunities to reduce our<br />
industry’s bearing upon our planet.<br />
Our customers<br />
We provide our customers with the<br />
information that they need to make an<br />
informed choice.We support our customers<br />
CR goals through our green driving initiatives.<br />
See more on page 43<br />
Our people<br />
Developing our people is key to us in order<br />
to ensure we have engaged employees in<br />
winning teams.<br />
See more on page 44<br />
Our communities<br />
We support our local communities<br />
through a range of initiatives,to provide<br />
the most relevant help in the markets<br />
in which we operate.<br />
See more on pages 46-47<br />
Our environment<br />
We are making great progress on<br />
understanding our impact on the<br />
environment so we are best placed<br />
to contribute to a sustainable future.<br />
See more on pages 48-49<br />
42<br />
<strong>Inchcape</strong> plc ¦ <strong>Annual</strong> <strong>Report</strong> and Accounts 2009
Section<br />
One<br />
Business<br />
review<br />
Our customers<br />
We place emphasis on the quality of our customer service and in 2007 we launched the Customer 1st initiative as part of the<br />
<strong>Inchcape</strong> Advantage programme to deliver outstanding customer service‘every time,every day,everywhere’.<br />
Following extensive consumer research, we<br />
developed and implemented Customer 1st<br />
processes, training and systems throughout<br />
our retail centres. In particular, this has<br />
allowed local management to set targets<br />
for each centre based on customer<br />
satisfaction measured through Net Promoter<br />
Score (NPS) and sales and service funnel<br />
management analysis. In 2008 the<br />
programme was expanded to include our<br />
aftersales operations.This is described in<br />
more detail on pages 14-15 of this <strong>Report</strong>.<br />
We have introduced a system for tracking<br />
daily customer information for both sales<br />
and aftersales operations including retail<br />
centre traffic, sales leads, test drives and<br />
vehicle and service orders. Results are<br />
collected and monitored daily through<br />
a dedicated award winning portal on<br />
the Group’s intranet.This information is<br />
aggregated overnight, providing reports<br />
and comparisons against brand, country,<br />
region and across time periods.This allows<br />
us to measure, for example, the number<br />
of orders taken as a percentage of leads<br />
and to set targets accordingly and gives<br />
management a strong knowledge of the<br />
automotive industry and detailed insight<br />
into particular markets.<br />
Our customer understanding is facilitated<br />
both by our mystery shop in each of our<br />
retail centres’ sales and aftersales<br />
operations and by quantitative analysis<br />
of our NPS results. On a monthly basis,<br />
each retail centre submits feedback<br />
from 20 buyers and a further 20 visitors<br />
about their experience at the centre<br />
together with feedback for at least 20<br />
aftersales customers.<br />
Guidance on best practice and detailed<br />
recommendations on opportunities to<br />
improve customer service are accessible<br />
to all retail centre employees via our portal.<br />
We use the Customer 1st programme to<br />
monitor both our own performance as the<br />
retailer for our brand partners and the<br />
performance of our third party retailers<br />
where we manage the retail networks as<br />
the distributor.<br />
We believe that this focus on customer<br />
service and sales technology will help<br />
us deliver a superior retail service to our<br />
customers. Further, an improved customer<br />
experience sets us apart from our<br />
competitors and builds loyalty, resulting<br />
in stronger relationships with our brand<br />
partners and leaving the Group better<br />
positioned to grow market share.<br />
Customer 1st in 2009<br />
• We carried out approximately 2,800<br />
mystery shop exercises in 240 retail<br />
centre showrooms across the Group.<br />
• We carried out approximately 2,200<br />
mystery shop exercises in 225 service<br />
centres across the Group.<br />
• We talked to 44,500 vehicle buyers and<br />
45,500 showroom visitors for our vehicle<br />
sales NPS.<br />
• We talked to over 54,400 service<br />
customers for our aftersales NPS.<br />
Our NPS position has improved across the<br />
Group in 2009.<br />
Supporting our customers<br />
We are committed to providing clear<br />
information to our customers to help<br />
support them in their vehicle purchase<br />
choices.This is provided in our showrooms<br />
and on our websites.<br />
As part of providing a customer focused<br />
aftersales service, we offer our customers<br />
an environmental vehicle health check<br />
which includes:<br />
• tyre pressure check<br />
• CO 2 test and emissions test<br />
• air condition check<br />
• engine lubricant test<br />
• emissions test<br />
In some of our retail centres, customers are<br />
offered a free ‘Green Test Drive’ when they<br />
visit us for a vehicle service.The Green Test<br />
Drive shares tips with the customer on how<br />
to drive more efficiently, how to improve their<br />
environmental impact and ultimately how<br />
to reduce their vehicle running costs.<br />
We also have accessories available that<br />
help our customers manage their<br />
environmental footprint including low rolling<br />
resistance tyres, which can reduce CO 2<br />
emission by around 2% and lower engine<br />
friction lubricants which can reduce CO 2<br />
emissions by around 1%.<br />
Our brand partners<br />
We carefully select the brand partners<br />
that we represent in each market.The<br />
automotive industry has made significant<br />
progress in reducing vehicle emissions<br />
and we fully support the investment that is<br />
being made by our brand partners in this<br />
area. In the UK, average new car emissions<br />
have fallen by over 13% in the last 10 years.<br />
The biggest impact that motorists could<br />
have on the environment is replacing<br />
older high emission vehicles and having<br />
their cars regularly serviced. Improvements<br />
in CO 2 emissions have been achieved<br />
in all product segments.As an industry<br />
leader, <strong>Inchcape</strong> stays close to CO 2<br />
technological developments.<br />
Improvements in CO 2 emissions<br />
2009 2008<br />
Industry average<br />
CO 2 g/km 149.8 158.7<br />
Improvement 5.6%<br />
<strong>Inchcape</strong> weighted<br />
average CO 2 g/km 148.9 160.9<br />
Improvement 7.5%<br />
www.inchcape.com 43
Business review<br />
Strategy<br />
Corporate responsibility continued<br />
Our people<br />
At <strong>Inchcape</strong> we believe that to really achieve success it is our people who will make the difference.<br />
During 2009, as a consequence of our<br />
need to reduce costs in response to the<br />
economic downturn, we reduced the<br />
number of roles across our Group by<br />
around 14%. Despite this, we were able to<br />
maintain employee engagement and<br />
customer satisfaction at high levels.We<br />
believe that this is a direct result of our<br />
conviction that it is our people who make<br />
the difference and the actions arising<br />
from this.<br />
Our people strategy has the ultimate goal<br />
of having ‘Engaged People in Winning<br />
Teams’.We believe this goal will be achieved<br />
through four areas of priority:<br />
• the right people – by becoming a magnet<br />
for talented people who live our values<br />
and enjoy working in winning teams<br />
delivering outstanding results;<br />
• the right learning – by equipping our<br />
people to excel today and provide<br />
exciting development opportunities for the<br />
future,aligned to our business ambition;<br />
• the right reward – by recognising,<br />
celebrating and rewarding the contribution<br />
our people and teams make to delivering<br />
our challenging business ambition;<br />
• the right culture – by creating a great<br />
place to work where people choose to<br />
make a real difference and deliver the<br />
ultimate customer experience.<br />
Our employee base is diverse and reflects<br />
the different cultures and markets within<br />
which we operate.This diversity creates<br />
a range of perspectives that allow us to<br />
constantly challenge and improve the<br />
way we do things as we work towards our<br />
goal of putting the customer at the centre<br />
of our business.<br />
Talent and performance<br />
management<br />
Talent planning and performance<br />
management sit at the heart of our people<br />
strategy as we look to ensure we have the<br />
right people in every role.Whilst our processes<br />
are continuous there is a more detailed<br />
review and planning session conducted<br />
within each of our markets and at the centre,<br />
at least once a year. 2009 was the third year<br />
of this process.The process is designed to<br />
ensure that we constantly upgrade our talent<br />
and look to create the right development<br />
opportunities for all our people.<br />
Arising out of the talent planning process<br />
we have made several key people<br />
decisions, including secondments,<br />
promotions, lateral development moves,<br />
mentoring, and in many cases enhanced<br />
the development plans of the individual on<br />
the job.As a global business we are also<br />
able to provide international opportunities<br />
to our people and this allows us to<br />
create even more stimulating career<br />
paths and personal growth for many<br />
of our talented people. In 2009 we have<br />
made several changes within the Group<br />
Executive Committee and each of these<br />
changes was a consequence of this<br />
talent planning process.<br />
Our analysis continues to validate our belief<br />
that talented people who are aligned with<br />
our Company’s leadership skills and values<br />
yield higher levels of customer satisfaction<br />
and profit.<br />
Going forward we will continue to focus<br />
our efforts on ensuring that each of our<br />
employees has a meaningful development<br />
plan that takes into account their strengths,<br />
development areas and aspirations as well<br />
as the needs of the business.We recognise<br />
that development is personal to each<br />
individual and is core to the growth of the<br />
individual and through that, the growth<br />
of the Group.<br />
<strong>Inchcape</strong> operates in a constantly<br />
changing, evolving environment where<br />
employees meet new challenges regularly.<br />
We know we can only achieve success if<br />
each of us is growing, learning, developing<br />
and succeeding in our roles.<br />
Our employee survey results have told us<br />
that we need to do more to support<br />
employee personal development.We have<br />
therefore launched ‘Grow with <strong>Inchcape</strong>’<br />
our guide to helping individuals better<br />
understand what development planning is,<br />
how it applies to everyone and what we<br />
can do to really prepare for our future and<br />
reach our potential.‘Grow with <strong>Inchcape</strong>’<br />
demonstrates <strong>Inchcape</strong>’s commitment to<br />
people development.<br />
Employee communications<br />
During 2009, more than ever before, we<br />
have communicated with our employees<br />
regularly to ensure they were always well<br />
informed of the forces acting on us as a<br />
company, the state of the automotive<br />
industry in general, and to be transparent<br />
44<br />
<strong>Inchcape</strong> plc ¦ <strong>Annual</strong> <strong>Report</strong> and Accounts 2009
Section<br />
One<br />
Business<br />
review<br />
in accordance with our values with the<br />
actions we were taking.Through the various<br />
forums and channels of communication we<br />
were able to create much higher levels of<br />
involvement with our people on the<br />
business priorities.This was done in several<br />
ways including CEO roadshows, monthly<br />
employee meetings in several markets, a<br />
monthly Group wide newsletter, weekly<br />
sharing of customer letters,and by cascading<br />
messages through the line management.<br />
Employee survey<br />
Our annual Heartbeat survey is an<br />
important part of our overall employee<br />
engagement programme.We encourage<br />
our line managers to use the results of the<br />
survey to create action plans that will help<br />
their teams increase the levels of their<br />
engagement.We were delighted that over<br />
90% of our entire Group wide employee<br />
population participated in the second<br />
wave of Heartbeat in 2009.We have seen<br />
an increase in the levels of engagement<br />
in our people and going forward we intend<br />
to continue this process.<br />
Employee reward<br />
We recognise that it is our culture, our<br />
values, and the opportunities we provide<br />
our people that attract talented individuals<br />
to us. However we also recognise the need<br />
to have well benchmarked, stretching yet<br />
stimulating reward opportunities for<br />
everyone.All of our reward programmes are<br />
aligned directly to the strategic requirements<br />
and expectations of our business and are<br />
designed to reward for high levels of<br />
performance. Our management incentive<br />
programmes have elements relating to<br />
customer satisfaction in addition to financial<br />
measures. Share awards and option plans<br />
are detailed on pages 69-70. In addition we<br />
have several local and Group wide<br />
schemes aimed at recognising people<br />
for high levels of performance and for<br />
demonstrating our values.<br />
Employee safety<br />
The safety of our people is of paramount<br />
importance to us. Many of our people<br />
handle hazardous substances and work<br />
with heavy machinery.We monitor and<br />
report accidents and lost time incidents to<br />
ensure that the safety of our staff and<br />
customers remains at the top of our<br />
agenda.We regularly review our policies<br />
and procedures for our people and have<br />
appropriate training programmes in place.<br />
The 2009 position is to the right.There is no<br />
specific trend or consistency of accident<br />
that has occurred either in a given location<br />
or across the Group.<br />
Spotlight on Health,Safety and Environment (HSE): Australia<br />
To support <strong>Inchcape</strong>’s vision of becoming<br />
the world’s most customer centric automotive<br />
retail group, many of our businesses are<br />
working towards creating an HSE culture<br />
of best practice and zero harm to people,<br />
property and our environment.There are<br />
many examples of excellent HSE initiatives<br />
around the Group. For example, <strong>Inchcape</strong><br />
Australia, improved its HSE performance<br />
significantly over the last year through a<br />
strategic focus on cultural change.<br />
Their 2009 HSE strategy was so successful<br />
it resulted in several excellent outcomes,<br />
including a 30% year on year reduction in<br />
number of ‘Lost Time Injuries’ in December<br />
2009, and a 20% year on year reduction in<br />
number of injuries and days lost. <strong>Inchcape</strong><br />
Australia was also able to reduce workers’<br />
compensation premiums by AU$ 600,000 by<br />
improving injury management systems and<br />
processes.The rollout of online systems, such<br />
as the ‘contractor induction system’ and<br />
the ‘incident reporting system’ and the<br />
development of safe work procedures, have<br />
also contributed to these fantastic results.<br />
Group accident statistics 2009<br />
Number of<br />
Location Group % accidents 2009<br />
Australasia 16 27<br />
Europe 5 8<br />
North Asia 18 30<br />
South Asia 6 10<br />
Russia and Emerging Markets 13 9<br />
UK 42 70<br />
Overall, there has been an improved level<br />
of compliance at all our <strong>Inchcape</strong> Australia<br />
sites, with HSE measures now incorporated<br />
into core business KPIs.Monthly meetings are<br />
held with senior management to provide<br />
updates regarding HSE performance for<br />
their business units.<br />
The hardworking HSE team are passionate<br />
about safety and, following a year of great<br />
achievement in 2009, are now focused<br />
on further plans for the next two years.<br />
In consultation with the business, they<br />
have developed an HSE strategy aimed<br />
at moving beyond compliance to best<br />
practice and zero harm in the workplace<br />
and look forward to continuing to drive<br />
HSE leadership and culture change.<br />
www.inchcape.com 45
Business review<br />
Strategy<br />
Corporate responsibility continued<br />
Our communities<br />
With our extensive international interests,<strong>Inchcape</strong> firmly believes in supporting the<br />
many different communities and cultures within which we operate,often through<br />
sponsorship and support of local charities for local people.We have highlighted some<br />
of the work that we have been undertaking in our communities.<br />
4<br />
1 <strong>Inchcape</strong> plants trees in Singapore<br />
Borneo Motors is collaborating with the South West Community<br />
Development Council to plant more than one million trees in<br />
the Pandan Gardens in Jurong East in Singapore by 2020.The<br />
previous target of 100,000 trees was surpassed in November<br />
2009. It is hoped that the new greenery will be able to absorb<br />
some 22,000kg worth of CO 2 annually.<br />
6<br />
3<br />
2<br />
2 <strong>Inchcape</strong> supports school project in Ethiopia<br />
<strong>Inchcape</strong> supports the Mother and Child Rehabilitation Centre<br />
(MCRC) in Ethiopia.Taking in extremely disadvantaged<br />
children from Addis Ababa and beyond, the centre provides<br />
shelter, food, education, medical care and therapy for children<br />
and their parents. MCRC aims to help them recover from past<br />
traumas and equip them through employment and<br />
professional training with the means to be independent and<br />
successful in the future. Over 2009, our staff donated money,<br />
clothes and toys to this fantastic cause, while <strong>Inchcape</strong> plc<br />
sponsored a fundraising video about the school.These ongoing<br />
contributions help ensure the programme continues to provide<br />
support and hope to these children and their mothers.<br />
46<br />
<strong>Inchcape</strong> plc ¦ <strong>Annual</strong> <strong>Report</strong> and Accounts 2009
Section<br />
One<br />
Business<br />
review<br />
3 Toyota Balkans is awarded<br />
‘best partner of the WWF<br />
Earth Hour’<br />
On 28th March 4,000 towns in 88 countries<br />
switched off the lights as part of the global<br />
Earth Hour campaign organised by World<br />
Wildlife Fund (WWF). <strong>Inchcape</strong>’s business<br />
in Bulgaria,Toyota Balkans, and its dealer<br />
network helped promote the campaign<br />
to staff and customers and took part by<br />
switching off electricity to their showrooms<br />
during Earth Hour. Our business was given<br />
a special recognition award for being the<br />
WWF’s best business partner for this project.<br />
4 <strong>Inchcape</strong> Fleet Solutions (IFS)<br />
wins Green Apple Award<br />
Our UK vehicle leasing and management<br />
company was the only one in its sector to win<br />
this in 2009.The award recognised a newly<br />
launched ISO 14001 accredited<br />
environmental management system that<br />
supports environmental management for<br />
clients.This includes a number of innovative<br />
online tools to help customers reduce their<br />
carbon footprint including: a CO 2 tracking<br />
tool that helps select lower impact and lower<br />
cost vehicles,enhanced vehicle comparison<br />
tools with vehicle-specific environmental<br />
impact tagging integrated within online<br />
quote system‘E-Quotes’and enhancements<br />
to its Grey Fleet driver management system<br />
providing guidance on how to cut fuel<br />
emissions and fuel use.<br />
1<br />
5<br />
5 <strong>Inchcape</strong> Australia’s employee<br />
volunteering programme<br />
In 2009, <strong>Inchcape</strong> Australia launched<br />
‘<strong>Inchcape</strong> in the Community’, an employee<br />
volunteering programme where staff receive<br />
an extra day of paid leave per year to<br />
dedicate to a community project.<br />
‘<strong>Inchcape</strong> in the Community’ is an<br />
opportunity for employees to get involved<br />
and ‘give back’ to the community through<br />
engaging in an activity for any of the<br />
following charities:The Smith Family Hospice,<br />
The Salvation Army, Conservation Volunteers<br />
or Cancer Council Australia.<br />
6 Toyota Hellas in Greece takes<br />
part in Green Month Campaign<br />
For the fifth year, <strong>Inchcape</strong> took part in<br />
events in support of Toyota’s Green Month.<br />
The first activity was an Eco-Driving seminar<br />
for staff to help reduce fuel consumption<br />
and CO 2 emissions.<br />
The second activity involved 50 <strong>Inchcape</strong><br />
volunteers successfully cleaning a beach<br />
in Aspropyrgos in cooperation with the<br />
Mediterranean SOS Network and<br />
Aspropyrgos Municipality.<br />
www.inchcape.com 47
Business review<br />
Strategy<br />
Corporate responsibility continued<br />
Our environment<br />
In 2008,the Group commenced collecting data on its CO 2 footprint,measured<br />
against three core Key Performance Indicators (KPIs).<br />
Energy<br />
Transport<br />
Flights<br />
This KPI measures our global electricity and gas usage.<br />
For the last six months of 2008,and during 2009 data has been<br />
collated on the basis of megawatt hours for electricity and<br />
cubic metres for gas.<br />
This KPI measures the movement of cars and parts from<br />
the point of ownership (which means legal or contractual<br />
ownership) to the point we cease to have legal ownership.<br />
This includes test drives.We calculate our CO 2 footprint by<br />
car or parts kilometres depending on the mode of transport<br />
with a CO 2 multiplier.<br />
This KPI measures the impact of the movement of our people.<br />
We have recorded the number of flights (each flight leg counts<br />
as one unit) and calculated our flight CO 2 emissions with a<br />
multiplier by flight kilometre.<br />
In January 2009, following an internal<br />
review of the data collected and the<br />
collection process, it was agreed that the<br />
processes should be refined to maximise<br />
their robustness and enable independent<br />
verification, as appropriate.<br />
Since that review, we have continued<br />
to collect data from our markets against<br />
all three core KPIs.This data has begun<br />
to provide us with insights into our CO 2<br />
footprint. However, we consider that<br />
additional data collection is required in<br />
order to provide meaningful guidance.<br />
Namely:<br />
• additional CO 2 data is required in order<br />
to understand if seasonality has an<br />
impact on our data usage;<br />
• whilst there are early indications of trend<br />
patterns in the data, there is insufficient<br />
data to establish if these are actual or<br />
perceived trends;<br />
• verification of the robustness of our data.<br />
We are ensuring that from the start of the<br />
process we are building in sufficient<br />
control points so that our data is<br />
capable of independent verification as<br />
part of our overall planning process for<br />
this element of our CR programme.<br />
Early conclusions that can be<br />
drawn are:<br />
By recycling rainwater, using ground source heating pumps and solar power to heat<br />
water, <strong>Inchcape</strong> Honda in Romford, UK uses around 30% less energy than a standard<br />
car showroom.<br />
Analysing our CO 2 footprint is providing us<br />
with data from which we can evaluate how<br />
we can manage emissions and reduce<br />
costs in the supply chain. For example,<br />
in some markets we rely on air freight to<br />
support our business, particularly around<br />
the import of critical supplies which can be<br />
dependent on aftersales requirements.We<br />
will use the data to analyse if changes are<br />
appropriate to support our business<br />
requirements, reduce our CO 2 footprint<br />
and reduce costs, thereby benefiting our<br />
customers and our stakeholders alike.<br />
Additionally, measuring our direct<br />
costs using a CO 2 metric will present<br />
opportunities to work closely with our<br />
brand partners as we can support their<br />
CR values and vice versa, ensuring that<br />
there is a consistent approach throughout<br />
all elements of the supply chain.<br />
48<br />
<strong>Inchcape</strong> plc ¦ <strong>Annual</strong> <strong>Report</strong> and Accounts 2009
Section<br />
One<br />
Business<br />
review<br />
We have reviewed our travel policy and<br />
have used alternative communications<br />
where practicable, such as conference<br />
calls, video conferencing and virtual offsites.<br />
We will continue to implement these<br />
measures in 2010 as part of our CR<br />
programme. Moreover, the cultural changes<br />
in our ways of working have been<br />
implemented positively.<br />
We have already introduced a number of<br />
measures to protect our environment within<br />
our offices such as recycling bins, use of<br />
recycled paper and stationery and water<br />
purification systems.<br />
As <strong>Inchcape</strong> operates three business<br />
models – Distribution, Retail and VIR<br />
(please see page 13 for more detail)<br />
there are variances in our CO 2 footprint.<br />
Direct comparisons between markets<br />
operating different business models are<br />
unlikely to produce meaningful results.<br />
However, we are looking for opportunities<br />
to exploit synergies between the business<br />
models by having a consistent approach<br />
to reduction and offsetting goals and by<br />
sharing best practices.<br />
Our 2010<br />
goals<br />
Having established<br />
solid foundations for our<br />
CR programme,in 2010<br />
we will look to embed<br />
these practices within<br />
our global operations,<br />
particularly focusing on<br />
people and our CO 2<br />
footprint management.<br />
Objective<br />
Raising employee<br />
engagement through the<br />
various initiatives from our<br />
people strategy including<br />
significant reward and<br />
development plans<br />
Extending our employee<br />
survey to the rest of our global<br />
employee base<br />
Extending best practice in<br />
health and safety to our<br />
operations worldwide<br />
How we will do this<br />
• All employees to be part of the appraisal process<br />
• All senior employees to be part of the talent review process<br />
• All senior employees to have individual development plans<br />
• Continuing to implement Heartbeat across the Group<br />
• Ensuring that follow up action plans are in place and implemented<br />
• Reviewing time lost through accidents and continuing to monitor<br />
impact on business<br />
Supporting our communities<br />
in which we operate through<br />
focused initiatives<br />
• Continued focus on local initiatives<br />
Continued collection of CO 2<br />
data in order to establish<br />
trends and seasonal variations<br />
and eliminate practices which<br />
do not support both our CO 2<br />
and business strategies<br />
• Promote best practices throughout the business<br />
• Perform analysis for trends etc as sufficient robust and verifiable<br />
data is collated<br />
Identification of CO 2 reduction<br />
and/or offset opportunities for<br />
our core markets<br />
• Based on above, review the opportunities that positively impact our<br />
CO 2 footprint to support our objectives, our shareholders, our brand<br />
partners, our customers and employees<br />
www.inchcape.com 49
Aftersales again proved<br />
resilient in 2009 and<br />
represents c.50% of our<br />
Group gross margin<br />
Our BMW Cooper Croydon retail<br />
centre in the UK has a 19 bay<br />
workshop, including two dedicated<br />
diagnostic bays and a ‘smart<br />
repair’ bay. The Integrated Service<br />
Information Server provides an<br />
online technical link direct to the<br />
BMW factory to aid our highly<br />
trained technicians through all<br />
diagnostic activities, re-coding<br />
and programming of vehicles.<br />
50<br />
<strong>Inchcape</strong> plc ¦ <strong>Annual</strong> <strong>Report</strong> and Accounts 2009
Section<br />
Two<br />
Governance<br />
Governance<br />
52 Board of Directors<br />
54 Executive Committee<br />
56 Corporate governance report<br />
68 Remuneration report<br />
75 Directors’ report<br />
www.inchcape.com<br />
51
Governance<br />
Board of Directors<br />
1 2<br />
6<br />
7<br />
1 Ken Hanna<br />
Position: Chairman<br />
Appointment to Board: September 2001<br />
Committee Membership(s): Nominations<br />
Committee<br />
Experience: Ken joined the Board as a<br />
Non-Executive Director in September 2001<br />
and accepted the position of Chairman in<br />
May 2009. Prior to joining <strong>Inchcape</strong>, Ken<br />
was an Executive Director and Chief<br />
Financial Officer of Cadbury plc. He was<br />
previously a Partner of Compass Partners<br />
International and Group Finance Director<br />
and Chief Executive of Dalgety (now<br />
Sygen Group plc) and had previous<br />
experience with Guinness plc (now<br />
Diageo plc), Avis Europe and Black &<br />
Decker. Ken is a Non-Executive Director<br />
of Tesco plc.<br />
2 André Lacroix<br />
Position: Group Chief Executive<br />
Appointment to Board: September 2005<br />
Committee Membership(s): Nominations<br />
Committee<br />
Experience: André is Chairman of Good<br />
Restaurants AG and a Non-Executive<br />
Director of Reckitt Benckiser Group plc. He<br />
was previously Chairman and Chief<br />
Executive Officer of Euro Disney S.C.A. Prior<br />
to this he was the President of Burger King<br />
International, previously part of Diageo.<br />
3 Will Samuel<br />
Position: Deputy Chairman and Senior<br />
Independent Non-Executive Director<br />
Appointment to Board: January 2005<br />
Committee Membership(s): Audit<br />
Committee, Remuneration Committee<br />
and Nominations Committee<br />
Experience: Will is Chairman of Galiform<br />
plc (previously known as MFI Group) and<br />
Ecclesiastical Insurance Group. He is Vice<br />
Chairman of Lazard & Co, a Non-Executive<br />
Director of the Edinburgh Investment Trust<br />
plc and a Director of the All Churches Trust.<br />
He was previously a Director of Schroders<br />
plc, Co-Chief Executive Officer of Schroder<br />
Salomon Smith Barney (a division of<br />
Citigroup Inc.) and Vice Chairman,<br />
European Investment Bank of Citigroup<br />
Inc and Chairman of H.P. Bulmer plc. Will is<br />
a chartered accountant.<br />
4 John McConnell<br />
Position: Group Finance Director<br />
Appointment to Board: October 2009<br />
Committee Membership(s): None<br />
Experience: John was appointed as<br />
Group Finance Director of <strong>Inchcape</strong> plc<br />
in October 2009, having worked with the<br />
Group since 1999. John joined <strong>Inchcape</strong><br />
Australasia as Chief Financial Officer<br />
before moving to the role of Chief<br />
Executive Officer of Australasia. Prior to<br />
joining <strong>Inchcape</strong> he worked with Reckitt<br />
and Colman (now Reckitt Benckiser) for<br />
13 years in a variety of senior financial<br />
roles in the UK, Germany and Australia.<br />
5 Alison Cooper<br />
Position: Non-Executive Director<br />
Appointment to Board: July 2009<br />
Committee Membership(s): Audit<br />
Committee<br />
Experience: Alison is Chief Operating<br />
Officer and Chief Executive designate of<br />
Imperial Tobacco Group PLC. Alison joined<br />
Imperial Tobacco Group in 1999 and has<br />
held a number of senior roles including<br />
Director of Finance and Planning, Regional<br />
Director Western Europe and Corporate<br />
Development Director. Previously she was<br />
with PricewaterhouseCoopers LLP.<br />
6 David Scotland<br />
Position: Non-Executive Director<br />
Appointment to Board: February 2005<br />
Committee Membership(s): Audit<br />
Committee, Remuneration Committee<br />
and Nominations Committee<br />
Experience: David is a Trustee and Director<br />
of Winston’s Wish, a child bereavement<br />
registered charity. He was previously an<br />
Executive Director of Allied Domecq plc<br />
and a Non-Executive Director of Photo-Me<br />
International plc, Brixton plc, Cobra Beer<br />
Ltd and Thompson Travel Group plc.<br />
52<br />
<strong>Inchcape</strong> plc ¦ <strong>Annual</strong> <strong>Report</strong> and Accounts 2009
Section Two<br />
Two<br />
Governance<br />
4<br />
5<br />
3<br />
8<br />
9<br />
7 Michael Wemms<br />
Position: Non-Executive Director<br />
Appointment to Board: January 2004<br />
Committee Membership(s): Audit<br />
Committee, Remuneration Committee<br />
and Nominations Committee<br />
Experience: Michael is a Non-Executive<br />
Director of Galiform plc and<br />
Moneysupermarket.com Group plc. He<br />
was previously an Executive Director of<br />
Tesco plc and Chairman of the House of<br />
Fraser plc and British Retail Consortium. He<br />
also held Non-Executive Director positions<br />
with Cole-Meyer Ltd, Majid Al Futtaim<br />
Group LLC and A&D Pharma Holding S.R.L.<br />
8 Nigel Northridge<br />
Position: Non-Executive Director<br />
Appointment to Board: July 2009<br />
Committee Membership(s): Remuneration<br />
Committee, Audit Committee<br />
Experience: Nigel is Chairman of Paddy<br />
Power plc and Debenhams plc. He is also<br />
Senior Independent Non-Executive Director<br />
of Aggreko plc. He spent 32 years with<br />
Gallaher Group plc in sales and marketing<br />
roles, becoming the Group Chief Executive<br />
in 2000. He was previously a Non-Executive<br />
Director of Thomas Cook plc.<br />
9 Graham Pimlott<br />
Position: Non-Executive Director<br />
Appointment to Board: March 2008<br />
Committee Membership(s): Audit<br />
Committee<br />
Experience: Graham is Chairman of<br />
Grosvenor Limited and a Non-Executive<br />
Director and Chairman of the Audit<br />
Committee at Tesco Personal Finance plc.<br />
He was a member of the Auditing Practices<br />
Board until March 2010. He was previously<br />
Chairman of the Export Credit Guarantee<br />
Department and a Non-Executive Director<br />
and Chairman of the Audit Committees of<br />
Tesco plc, Hammerson plc and Provident<br />
Financial plc.<br />
Members of the Audit Committee<br />
Date of appointment:<br />
Graham Pimlott – Chairman – 14 May 2009<br />
(Member – 28 March 2008)<br />
Will Samuel – 26 January 2005<br />
Michael Wemms – 29 January 2004<br />
David Scotland – 24 February 2005<br />
Alison Cooper – 1 July 2009<br />
Nigel Northridge – 5 March 2010<br />
Members of the Remuneration Committee<br />
Date of appointment:<br />
Michael Wemms – Chairman – 13 May 2004<br />
(Member – 29 January 2004)<br />
Will Samuel – 26 January 2005<br />
Ken Hanna – 27 September 2001<br />
David Scotland – 24 February 2005<br />
Nigel Northridge – 1 July 2009<br />
Members of the Nominations Committee<br />
Date of appointment:<br />
Ken Hanna – Chairman – 14 May 2009<br />
(Member – 26 February 2004)<br />
Will Samuel – 1 April 2005<br />
Michael Wemms – 29 July 2004<br />
David Scotland – 29 November 2005<br />
André Lacroix – 1 January 2006<br />
www.inchcape.com 53
Governance<br />
Executive Committee<br />
1 2 3 4 5 6 7 8<br />
1 André Lacroix<br />
Position: Group Chief Executive<br />
Appointment to Executive Committee:<br />
February 2006<br />
See page 52 for full biography<br />
2 John McConnell<br />
Position: Group Finance Director<br />
Appointment to Executive Committee:<br />
February 2006<br />
See page 52 for full biography<br />
3 Aris Aravanis<br />
Position: Chairman and Managing Director<br />
Toyota Hellas<br />
Appointment to Executive Committee:<br />
July 2009<br />
Skills and experience: During his tenure with<br />
<strong>Inchcape</strong>, Aris has led the establishment and<br />
development of Tefin, a finance company that<br />
was constituted by Toyota Hellas and EFG<br />
Eurobank, to the top of the automotive financing<br />
market in Greece.<br />
In February 2000, Aris assumed the position of<br />
General Manager of Toyota Hellas and then<br />
became Deputy Managing Director and<br />
member of the Board of Directors. During his<br />
service, Toyota has established solid and clear<br />
leadership in the Greek Market.<br />
Before joining Toyota Hellas and <strong>Inchcape</strong>, Aris<br />
had extensive experience in the finance field<br />
working in various sectors including the food<br />
industry and banking.<br />
4 George Ashford<br />
Position: Chief Executive Officer Toyota Belgium<br />
Appointment to Executive Committee:<br />
October 2006<br />
Skills and experience: George joined <strong>Inchcape</strong><br />
in March 2006 as Director of Implementation,<br />
<strong>Inchcape</strong> Advantage. In this role George led<br />
the implementation of <strong>Inchcape</strong> Advantage,<br />
a company wide strategic programme putting<br />
the customer at the heart of the Group’s service<br />
initiatives. In October 2006, George was<br />
appointed Managing Director European Retail.<br />
In this role he led the implementation of world<br />
class retail operation programmes across the<br />
European retail network. He was also responsible<br />
for the integration of businesses acquired in the<br />
Baltics and the construction and opening of four<br />
greenfield operations in eastern Europe. George<br />
was appointed as Chief Executive Officer Toyota<br />
Belgium in July 2009.<br />
George joined <strong>Inchcape</strong> from Yum Restaurants<br />
International (previously Pepsi Restaurants<br />
International), where he spent 10 years holding<br />
several senior management positions.<br />
5 Dale Butcher<br />
Position: Group Development Director<br />
Appointment to Executive Committee:<br />
February 2006<br />
Skills and experience: Dale joined <strong>Inchcape</strong><br />
in 1986 and has been involved in numerous<br />
restructuring and reorganisation projects as<br />
the Group rationalised its portfolio, and in all<br />
acquisitions and disposals since <strong>Inchcape</strong><br />
became an automotive only Group.<br />
Prior to joining <strong>Inchcape</strong>, Dale worked for<br />
British Timken as a financial analyst from<br />
November 1980 to 1982 before joining<br />
Alghanim Industries in Kuwait as a financial<br />
controller, where he worked in their motors<br />
and construction divisions.<br />
Dale is a member of the London CBI council<br />
and is a Freeman of the City of London.<br />
6 Claire Chapman<br />
Position: General Counsel and Group Company<br />
Secretary<br />
Appointment to the Executive Committee:<br />
March 2007<br />
Skills and experience: Claire joined <strong>Inchcape</strong><br />
in March 2007 and is responsible for the<br />
Group’s legal and compliance programmes,<br />
mergers and acquisitions, major contracts,<br />
corporate projects and restructurings and<br />
effective corporate governance and Board<br />
management.<br />
Claire was formerly a solicitor at Freshfields<br />
Bruckhaus Derringer from 1991 to 1995 before<br />
joining the legal team at the Reuters Group PLC<br />
from 1995 to 2007. Claire held various roles whilst<br />
at Reuters, working for their UK, European and US<br />
businesses. She was General Counsel for the UK<br />
from 2000 to 2003 and General Counsel for<br />
Europe, Middle East and Africa from 2004 to<br />
2007, advising on a range of matters from major<br />
commercial and IT contracts, global projects,<br />
integration and key corporate projects.<br />
Additionally she advised on company<br />
secretariat matters from 2004 to 2007.<br />
Claire is a qualified solicitor for England and<br />
Wales and Attorney, New York and has a Masters<br />
in International Law.<br />
7 Koh Ching Hong<br />
Position: Managing Director<br />
<strong>Inchcape</strong> South Asia<br />
Appointment to Executive Committee:<br />
August 2009<br />
Skills and experience: Ching Hong joined Borneo<br />
Motors as its Managing Director in January 2008.<br />
He was appointed as Managing Director,<br />
<strong>Inchcape</strong> South Asia in August 2009 and is<br />
responsible for Borneo Motors and Champion<br />
Motors in Singapore and NBT in Brunei.<br />
Prior to joining the Group, Ching Hong was<br />
Managing Director of Fuji Xerox Singapore, an<br />
Executive member of the Fuji Xerox Asia Pacific<br />
Senior Management from 1996 to 2008. In these<br />
roles he led the transformation and restructuring<br />
of its business model and business approach,<br />
thereby increasing market share, doubling<br />
revenue and leading the organisation into the<br />
prestigious Singapore Quality Class, achieving<br />
a high customer satisfaction index.<br />
8 Tony George<br />
Position: Group Human Resources Director<br />
Appointment to the Executive Committee:<br />
February 2007<br />
Skills and experience: Tony joined the Group<br />
in February 2007. He has over 22 years of<br />
experience in Human Resources and General<br />
Management in International FMCG, chemicals,<br />
telecommunications and customer service<br />
oriented retail companies. In his previous role<br />
he was HR Director, Corporate Functions for<br />
Vodafone plc and prior to that, SVP International<br />
Partner Resources for Starbucks Coffee<br />
Company based in the US. He has also worked<br />
with ICI in India and Diageo plc where, at the<br />
time of the formation of the Company, he was<br />
the first Global Management Development<br />
Director UDV in the UK and latterly was the SVP<br />
International HR for the Burger King business.<br />
During his career Tony has lived and worked<br />
in India, UK, USA and Australia.<br />
54<br />
<strong>Inchcape</strong> plc ¦ <strong>Annual</strong> <strong>Report</strong> and Accounts 2009
Section Two<br />
Two<br />
Governance<br />
9 10 11 12 13<br />
14 15<br />
9 Ken Lee<br />
Position: Group Communications Director<br />
Appointment to Executive Committee:<br />
November 2006<br />
Skills and experience: Ken joined <strong>Inchcape</strong><br />
Retail as Marketing Director in September 2003,<br />
where he led the development of a pioneering<br />
customer experience programme. In early 2006<br />
he was appointed Customer Strategy Director to<br />
lead the Group wide identification of customer<br />
insights to drive the company’s <strong>Inchcape</strong><br />
Advantage programme. In late 2006 he was<br />
appointed to the Executive Committee as<br />
Group Communications Director with<br />
responsibility for Group wide internal and<br />
external communications.<br />
Prior to joining <strong>Inchcape</strong>, Ken held the position<br />
of Group Marketing Director at the RAC from<br />
1999 to 2003 and was part of the team that<br />
acquired and then led the business post<br />
demutualisation. During his tenure the company<br />
moved from a car breakdown organisation to a<br />
customer focused motoring services group.<br />
Before joining the RAC Ken worked for Lex Service<br />
plc, where as Marketing Director he successfully<br />
established the Hyundai brand in the UK.<br />
10 Patrick S Lee<br />
Position: Managing Director<br />
<strong>Inchcape</strong> North Asia<br />
Appointment to Executive Committee:<br />
November 2006<br />
Skills and experience: Patrick is in charge of our<br />
VIR operations in Hong Kong, Macau and<br />
Guam. Representing Toyota in all three markets,<br />
Toyota has maintained the No.1 position for<br />
several years.<br />
Before joining <strong>Inchcape</strong>, Patrick was the Group<br />
General Manager, Sales and Marketing of Kerry<br />
Beverages Ltd from 1998 to 2006. Kerry Beverages<br />
owned and operated 11 Coca-Cola bottling<br />
plants in China.<br />
Patrick’s experience in auto retailing came from<br />
a Toronto Honda dealership where he worked for<br />
three years and was awarded the highest<br />
honour “Sales Master” by Honda Canada for two<br />
consecutive years. Patrick started his career in<br />
brand marketing with Procter & Gamble and<br />
has worked in various locations including<br />
Canada, Switzerland, Thailand and Hong Kong.<br />
Patrick holds a BBA and an MBA from the<br />
Chinese University of Hong Kong.<br />
11 Spencer Lock<br />
Position: Chief Executive Officer <strong>Inchcape</strong><br />
Australasia<br />
Appointment to Executive Committee:<br />
February 2006<br />
Skills and experience: Spencer joined <strong>Inchcape</strong><br />
in 1998 and has held various senior operational<br />
roles within the UK Retail business, culminating<br />
in his appointment as Chief Executive Officer<br />
of <strong>Inchcape</strong> Retail in 2007. Spencer has been<br />
responsible for the development of the premium<br />
brand core partner strategy and the acquisition<br />
and integration of both European Motor<br />
Holdings and Lind Automotive Group. In<br />
November 2009, Spencer was appointed Chief<br />
Executive Officer of <strong>Inchcape</strong> Australasia.<br />
Prior to joining <strong>Inchcape</strong>, Spencer was responsible<br />
for franchise development in Nissan GB and<br />
previously worked for Ford Motor Company.<br />
12 Bertrand Mallet<br />
Position: Managing Director Emerging Markets<br />
and Group Strategy Director<br />
Appointment to Executive Committee:<br />
July 2008<br />
Skills and experience: Bertrand is responsible for<br />
the Emerging Markets region, encompassing all<br />
of our retail and distribution activities in China,<br />
Poland and the Balkans. He oversees both<br />
current operations and the definition of our<br />
future expansion plans in these markets. He also<br />
serves as the Group Strategy Director, a role in<br />
which he manages the Corporate Strategic<br />
Planning process and key strategic projects for<br />
the Group.<br />
Before joining <strong>Inchcape</strong>, Bertrand spent over six<br />
years with Euro Disney in both Strategy and Sales<br />
roles, most recently as Managing Director for the<br />
French market. During his tenure, a new sales<br />
and marketing approach was defined and<br />
implemented. Prior to Euro Disney, he spent five<br />
years as a senior consultant with Bain and<br />
Company, both in France and in the US. His main<br />
areas of focus were around retail and distribution.<br />
Bertrand began his career in Sales and<br />
Marketing with Automobiles Peugeot in Sweden.<br />
13 Connor McCormack<br />
Position: Chief Executive Officer <strong>Inchcape</strong> UK<br />
Appointment to Executive Committee:<br />
November 2009<br />
Skills and experience: Connor has been with<br />
the Group since July 2005, having initially joined<br />
<strong>Inchcape</strong> as Finance Director UK Retail. Connor<br />
has led the business through the acquisitions<br />
and integrations of the Lind Automotive Group<br />
and European Motor Holdings, as well as playing<br />
an instrumental part in the right sizing of the UK<br />
business in the second half of 2008, as the<br />
global economy entered the downturn. Connor<br />
was appointed Chief Executive Officer of the UK<br />
business in November 2009.<br />
Prior to <strong>Inchcape</strong>, Connor held senior positions<br />
with B&Q plc, Kingfisher plc, the L’Oreal Group<br />
and the Gillette Company.<br />
14 Jean Van der Hasselt<br />
Position: Managing Director Nordics,<br />
South America and Africa<br />
Appointment to Executive Committee:<br />
June 2009<br />
Skills and experience: Jean joined <strong>Inchcape</strong> in<br />
2003 as Chief Executive Officer of Toyota Belgium,<br />
having been in the automotive industry since<br />
1985. During this tenure the network has been<br />
successfully restructured, leading to fewer and<br />
better retailers whilst improving market share<br />
and maximising the profitability for Toyota<br />
Belgium. The successful run out campaign of<br />
Toyota’s best selling model in 2006 led to an<br />
overall best market share performance.<br />
Prior to <strong>Inchcape</strong>, Jean held several Director<br />
positions within the Volvo organisation and was<br />
Managing Director for the Volvo Cars operations<br />
in Belgium, actively contributing to the set up of<br />
the PAG structure, leading to effective synergies<br />
within Ford’s luxury brand cluster.<br />
15 Immo Rupf<br />
Position: Managing Director<br />
<strong>Inchcape</strong> Russia<br />
Appointment to Executive Committee:<br />
March 2006<br />
Skills and experience: Immo joined <strong>Inchcape</strong><br />
as Director of Group Strategy in March 2006<br />
and led major strategic initiatives, most<br />
significantly the <strong>Inchcape</strong> Customer 1st<br />
transformation. On 1 August 2008, Immo was<br />
appointed as Managing Director for <strong>Inchcape</strong>’s<br />
Russian businesses. Since then Immo has<br />
been leading the integration of our acquired<br />
Russian businesses.<br />
Prior to joining <strong>Inchcape</strong>, Immo was a Partner<br />
and Vice President of the Boston Consulting<br />
Group (BCG) in Munich, Shanghai and Paris<br />
from 1989 to 2003 and Group Chief Financial<br />
Officer for Alcoa Asia and Latin America from<br />
2004 to 2006. His main focus at BCG and<br />
Alcoa was on business strategy, corporate<br />
development and performance management<br />
for automotive and consumer businesses.<br />
www.inchcape.com 55
Governance<br />
Corporate governance report<br />
Letter from the Chairman<br />
Ken Hanna<br />
Chairman<br />
Dear Shareholder<br />
I succeeded Peter Johnson as Chairman of <strong>Inchcape</strong> after the<br />
AGM on 14 May 2009. During his tenure as Chairman, Peter<br />
championed good governance practices and a continued focus<br />
on the highest governance standards remains high on my agenda.<br />
We, as a Board, firmly believe these are vital to the effective<br />
operation and growth of our Company.<br />
High standards of governance help strengthen management<br />
and underpin the decisions made by the Board and the Executive<br />
Committee to help us to lead the Group forward to deliver on our<br />
objectives and performance goals whilst having regard to the<br />
interests of our stakeholders. Making governance integral to our<br />
business enables the Board to be focused on strategy and enables<br />
the Executive Committee to manage the operations effectively.<br />
During 2009 we remained committed to ensuring the highest<br />
standards of Board performance and delivery and to this end have<br />
again performed an evaluation of the Board. Our particular focus<br />
has been on ensuring that the refinements we have made to our<br />
Board processes are working effectively and that the members of<br />
the Board that joined us in 2009, as well as the existing members,<br />
have full access to our business along with all relevant information<br />
and training to allow them to discharge their duties. Our evaluation<br />
has reviewed how the changes made have facilitated discussion<br />
of the key issues as well as considering the alignment to best<br />
corporate governance practices following recommendations<br />
made by various reports including the Walker <strong>Report</strong> and the<br />
Financial <strong>Report</strong>ing Council.<br />
Our corporate governance report explains how the Board and its<br />
Committees operate within a framework of effective controls and<br />
how the Directors have discharged their duties to our Company.<br />
Yours sincerely<br />
2009 highlights<br />
• Successful Rights Issue<br />
• Board composition review<br />
• Successful roll out of the Group Subsidiary<br />
Governance Manual<br />
2010 objectives<br />
• Share consolidation<br />
• Continued focus on corporate responsibility<br />
• Effective implementation of applicable<br />
recommendations from key governance reviews<br />
• Focus on Board balance, development and<br />
performance evaluation<br />
Ken Hanna<br />
Chairman<br />
Governance framework<br />
In accordance with the Companies Act 2006 and the principles of<br />
good governance,the Board is collectively responsible for promoting<br />
the success of the Company and for providing strong leadership<br />
within a framework of prudent and effective controls.The Board is<br />
committed to ensuring that the Group delivers shareholder value in<br />
the long term and recognises that good governance will facilitate<br />
the achievement of sustainable growth.<br />
The Board has established good governance practices by ensuring<br />
that the Board is well balanced and has structured and effective<br />
Committees to assist with the running of the Company.<br />
The following sections explain how the Company has complied<br />
with the main and supporting principles of the Combined Code<br />
(Code). It is the Board’s view that it has been fully compliant with<br />
the Code throughout the year.<br />
More online at www.inchcape.com/aboutus/corporategovernance<br />
56<br />
<strong>Inchcape</strong> plc ¦ <strong>Annual</strong> <strong>Report</strong> and Accounts 2009
Section Two<br />
Two<br />
Governance<br />
<strong>Inchcape</strong> plc<br />
Audit<br />
Committee<br />
Remuneration<br />
Committee<br />
Executive<br />
Committee<br />
Nominations<br />
Committee<br />
Corporate<br />
Responsibility<br />
Committee<br />
Delegated authorities:<br />
Financial <strong>Report</strong>ing<br />
Risk Management<br />
Internal Control<br />
Delegated authorities:<br />
Remuneration policy<br />
Incentive plans<br />
Performance targets<br />
Delegated authorities:<br />
Group strategy<br />
Operational<br />
Management<br />
Delegated authorities:<br />
Balance of the Board<br />
Leadership of the Group<br />
Succession planning<br />
Delegated authorities:<br />
Oversight of the Group<br />
CR programme<br />
Delegated authorities:<br />
Risk oversight<br />
Business Risk Assessment<br />
Control processes<br />
Risk<br />
Management<br />
Strategy Group<br />
Group<br />
Capital<br />
Committee<br />
Delegated authorities:<br />
Oversight of Group<br />
capital expenditure<br />
A statement of the Directors responsibilities for preparing the<br />
consolidated Financial statements and a statement regarding the<br />
status of the Company as a going concern is on page 76.<br />
The Board of Directors<br />
The Board comprises a Non-Executive Chairman, six Non-Executive<br />
Directors and two Executive Directors.<br />
The Chairman, Ken Hanna, is responsible for the leadership of<br />
the Board and the balance of its membership.The Group Chief<br />
Executive,André Lacroix, is responsible for leading and managing<br />
the business with support from the Executive Committee.<br />
Will Samuel is the Deputy Chairman and Senior Independent<br />
Non-Executive Director.The Committee Chairmen are:<br />
• Michael Wemms – Remuneration Committee;<br />
• Graham Pimlott – Audit Committee;<br />
• Ken Hanna – Nominations Committee;<br />
• David Scotland – Corporate Responsibility Committee.<br />
The biographical details of the Directors (including details of<br />
other directorships held) and the Executive Committee can be<br />
found on pages 52-55.<br />
Articles of Association<br />
Article 74 requires that every Director will seek re-election to the<br />
Board at least every three years,subject to election by shareholders<br />
at their first AGM.Articles 70 to 72 provide for the appointment<br />
and removal of Directors by the Board.All Directors are subject to<br />
the provisions of the Companies Act 2006 in relation to the removal<br />
of Directors.<br />
Under Articles 82 and 83 the Board may authorise any conflicts of<br />
interest. If a Director becomes aware of a conflict he/she must notify<br />
the Board in writing at the next Board meeting.A register of conflicts<br />
is kept by the Group Company Secretary. It is the duty of the<br />
Directors to inform the Board of any updates to their conflicts.<br />
No such conflicts have been reported during 2009.<br />
Board operation<br />
The Board is responsible for setting the strategic agenda for<br />
the Company and for ensuring that its values and standards<br />
are applied throughout the Group’s businesses. Day to day<br />
management is delegated to the Executive Committee, however<br />
matters which require Board approval include:<br />
• budget;<br />
• capital expenditure, acquisitions and disposals;<br />
• group policies;<br />
• financial results;<br />
• board and Company Secretary appointments;<br />
• corporate and capital structure;<br />
• internal controls and risk management.<br />
The full schedule of Matters Reserved for the Board can be found<br />
on the Company’s website at<br />
www.inchcape.com/aboutus/corporategovernance.<br />
Specific responsibilities are delegated to the Board’s Committees.<br />
The reports for the Audit, Nominations and Remuneration<br />
Committees are on pages 64-67.<br />
www.inchcape.com 57
Governance<br />
Corporate governance report continued<br />
Board Audit Committee Remuneration Committee Nominations Committee<br />
Number of meetings Number Attended Number Attended Number Attended Number Attended<br />
Raymond Ch’ien* 7 3 – – – – – –<br />
Alison Cooper* 7 3 3 2 – – – –<br />
Karen Guerra* 7 2 – – 3 2 – –<br />
Ken Hanna 7 7 3 3 3 3 3 3<br />
Peter Johnson* 7 4 – – – – 3 1<br />
Nigel Northridge* 7 2 – – 3 0 – –<br />
André Lacroix 7 7 – – – – 3 3<br />
John McConnell* 7 2 – – – – – –<br />
Graham Pimlott 7 7 3 3 – – – –<br />
Barbara Richmond* 7 4 – – – – – –<br />
Will Samuel 7 7 3 3 3 3 3 3<br />
David Scotland 7 7 3 3 3 3 3 3<br />
Michael Wemms 7 7 3 3 3 3 3 3<br />
* Raymond Ch’ien,Karen Guerra and Peter Johnson left on 14 May 2009.Barbara Richmond left on 30 June 2009.Alison Cooper and Nigel Northridge joined on 1 July 2009.<br />
John McConnell joined on 1 October 2009.<br />
Other key Committees include the Risk Management Strategy<br />
Group which reports ultimately into the Audit Committee and the<br />
Executive Committee, Group Capital Committee and Corporate<br />
Responsibility Committee which report to the Board of Directors.<br />
The Corporate Responsibility <strong>Report</strong> can be found of pages 40-49.<br />
Board meetings and attendance<br />
The Board held seven scheduled meetings during 2009. In addition<br />
the Board attended a Strategy Review day where the Board and<br />
members of the Executive Committee agreed the strategic agenda<br />
for the coming years.The Strategy Review day gives the Non-<br />
Executive Directors and the Executive Committee members an<br />
opportunity to engage in detailed discussions regarding the<br />
operations of the business and establish the framework for the<br />
future strategic direction of the Group.The Board also met for ad<br />
hoc meetings to deal with specific issues.<br />
Board meetings were held at retail centres and operations within<br />
the Group which provides valuable additional insight into the<br />
business for Non-Executive Directors and gives the Board an<br />
opportunity to meet colleagues around the world. During 2009,<br />
Directors’industry background experience<br />
in contrast with previous years and in recognition of the difficult<br />
economic climate, the Board did not hold an overseas Board<br />
meeting but instead attended a meeting at BMW Croydon, a UK<br />
retail centre. It is intended that the Board will meet at our operations<br />
in Belgium in 2010.<br />
Where a Director is unable to attend a meeting,he/she is advised in<br />
advance of the matters to be discussed and given an opportunity to<br />
make his/her views known to the Chairman,Committee Chairman<br />
or Group Company Secretary before the meeting. Nigel Northridge<br />
was unable to attend one meeting due to commitments that<br />
existed before he became a Non-Executive Director.<br />
If any Director were to have any concerns regarding the running<br />
of the Company or a proposed action, such concerns would be<br />
recorded in the Board minutes. If a Director were to resign over an<br />
unresolved issue,the Chairman would bring the issue to the attention<br />
of the Board. No such issues or concerns arose during the year.<br />
The Non-Executive Directors also met during the year without the<br />
Executive Directors.<br />
Balance of Executive/Non-Executive Directors<br />
Chairman<br />
11%<br />
Retail<br />
44%<br />
Financial<br />
56%<br />
Executive<br />
Directors<br />
22%<br />
Non-Executive<br />
Directors<br />
67%<br />
58<br />
<strong>Inchcape</strong> plc ¦ <strong>Annual</strong> <strong>Report</strong> and Accounts 2009
Section Two<br />
Two<br />
Governance<br />
Board balance and independence<br />
All the Non-Executive Directors are considered to be independent<br />
under the criteria set out in rule A.3.1 of the Combined Code.<br />
Ken Hanna became Chairman after the AGM on 14 May 2009.<br />
Ken was considered independent upon appointment under rule<br />
A.3.1 of the Combined Code.<br />
Will Samuel and Michael Wemms are both Non-Executive Directors<br />
of Galiform PLC. Ken Hanna and Graham Pimlott are both Non-<br />
Executive Directors of Tesco PLC or its subsidiaries. Having regard<br />
to all the circumstances, including the independence they have<br />
demonstrated as Non-Executive Directors of the Company and the<br />
fact that there are no cross-shareholdings or business relationships<br />
between either Galiform PLC or Tesco PLC and the Company, the<br />
Board is satisfied and has determined that they are independent<br />
in respect of these roles additionally.<br />
It is important to the Company to maintain a strong skills base<br />
across the Board in order to bring a depth of knowledge and<br />
experience to the matters under discussion.Alison Cooper and<br />
Nigel Northridge were both appointed during the year.They bring<br />
considerable retail,operational and international experience adding<br />
to and enhancing the balance of the Board. John McConnell<br />
joined as Group Finance Director transferring from our business<br />
in Australia. John’s in depth knowledge of our business as well as<br />
technical knowledge gives him a particular insight into strategic<br />
issues.All the Directors bring an individual judgement to bear on<br />
issues of strategy,performance,resources and standards of conduct.<br />
Further details on new appointments to the Board can be found<br />
in the Nominations Committee report on page 65-66.<br />
Information,training and development<br />
Information supplied<br />
Each Director receives information on the Group’s operating<br />
businesses; regulatory and legislative environment; and<br />
corporate governance.<br />
Additional support<br />
The Directors have access to external advisors for additional<br />
information and/or training as appropriate.This ensures that the<br />
Directors’ skills, knowledge and familiarity are kept up to date.<br />
Board meetings<br />
Using the information supplied the Directors are able to<br />
participate in informed and valuable discussions during the<br />
Board meetings.<br />
Responsibility<br />
The Group Company Secretary is responsible for the flow of<br />
information to Non-Executive Directors.The receipt of quality,<br />
timely and relevant information is important to the effective<br />
decision making of the Board.<br />
Induction programme for new Non-Executive Directors<br />
In order to understand the Group’s operations both new Non-<br />
Executive Directors participated in a detailed induction programme.<br />
They met with the Chairmen of the Audit and Remuneration<br />
Committees to acquire an understanding of the Board’s processes<br />
and they visited UK retail centres with the Chief Executive Officer<br />
of the UK retail business to provide an insight into the Group’s<br />
operational business.They also spent time with members of the<br />
Executive Committee, the Director of Corporate Affairs, Group Head<br />
of Tax and the Group Financial Controller to gain further knowledge<br />
of how the Company operates. Externally they met with the<br />
Company’s brokers to enable them to gain an understanding<br />
of the Group’s position within the market place.<br />
The broad scope of the induction plan is designed to give the new<br />
Non-Executive Directors an understanding of the business and the<br />
arena in which it operates.<br />
Performance evaluation<br />
Process<br />
Led by the Chairman and supported by the Group Company<br />
Secretary, a performance evaluation questionnaire was used,<br />
covering the effectiveness of the Board, each Committee’s<br />
performance against objectives, preparation for and<br />
performance at meetings and corporate governance matters.<br />
An internal review was considered most appropriate in 2009 to<br />
allow changes in composition and operation to bed down.<br />
Focus<br />
The change in Chairman and composition of the Board in<br />
2009 provided an opportunity to review how the Board<br />
processes supported the effective discharge by the Board<br />
of its duties. In conjunction with this review, we have:<br />
• re-issued the schedule of Board meetings, with six to eight<br />
meetings per year held over two successive days;<br />
• increased the number of scheduled Audit Committee<br />
meetings.<br />
Identification of actions<br />
Following the evaluation, the Board members concluded<br />
that appropriate actions have been identified to address<br />
areas that could be improved and that, overall the Board<br />
and Committees continued to perform effectively.<br />
Performance evaluation<br />
The Chairman evaluates the performance of the Non-Executive<br />
Directors and met each of them individually to discuss<br />
performance.The Non-Executive Directors met without the<br />
presence of the Chairman to evaluate his performance.<br />
Conclusion<br />
Following the performance evaluation process, the Chairman<br />
has confirmed that the Non-Executive Directors standing for<br />
election at this year’s AGM continue to perform effectively and<br />
demonstrate commitment to their roles.The Board will continue<br />
to review performance annually. In addition to the annual<br />
review process the Board receives regular updates on best<br />
practice and will, as appropriate, adopt changes in practice<br />
during the course of the year.<br />
www.inchcape.com 59
Governance<br />
Corporate governance report continued<br />
Internal control framework<br />
Board level<br />
Group<br />
management<br />
level<br />
Corporate<br />
governance<br />
Performance<br />
management process<br />
• Strategy process<br />
• Business planning<br />
• Management<br />
reporting<br />
• Performance reviews<br />
• Individual discussions<br />
• Investment process<br />
Control<br />
environment<br />
Information and<br />
communications<br />
Operations level<br />
and Corporate<br />
functions<br />
Business and<br />
support processes<br />
Follow-up<br />
(e.g.business control,<br />
internal and external audit)<br />
Values and code of conduct<br />
Internal controls<br />
The Board is responsible for the establishment and review of the<br />
Company’s internal operational and compliance control systems.<br />
The internal control systems are designed to ensure:<br />
• effective and efficient operations;<br />
• quality of internal and external reporting; and<br />
• internal control and compliance with appropriate laws<br />
and regulations.<br />
The implementation of internal control systems is the responsibility<br />
of the Executive Committee.<br />
In compliance with provision C.2.1 of the Code and the Turnbull<br />
guidance the Board annually reviews the effectiveness of the<br />
Company’s internal control systems and reports to shareholders.<br />
The Board has ensured that a process for managing significant<br />
risk has been in place during the year.The process is designed to<br />
manage rather than eliminate risk in general, not just risk of not<br />
meeting objectives. In establishing and reviewing the system of<br />
internal control the Directors have regard to the nature and extent<br />
of relevant risks; the likelihood of loss being incurred and the costs<br />
of control.<br />
The system can only provide a reasonable but not absolute<br />
assurance against any material mis-statement or loss and cannot<br />
eliminate business risk.<br />
The Board has delegated the responsibility of monitoring the<br />
effectiveness of the Company’s internal control systems to the<br />
Audit Committee.The Committee reports its findings to the Board<br />
as a whole so that a view can be taken.<br />
Risk identification,assessment and management<br />
To assist the Board and the Audit Committee in managing internal<br />
controls the Group operates a Risk Management Strategy Group<br />
(RMSG) which is chaired by the Group Chief Executive. Membership<br />
throughout the year comprised the Group Finance Director, the<br />
General Counsel and Group Company Secretary, the Group<br />
Corporate Affairs Director and the Director of Audit and Risk.<br />
The RMSG meets six times per year,aligned with the Audit Committee<br />
schedule to review risk management and control processes. Its<br />
review covers matters such as responses to significant risks that<br />
have been identified, output from monitoring processes (including<br />
internal audit reports) and changes to be made to the internal<br />
control systems. It also follows up on areas that require improvement<br />
and reports back to the Audit Committee.<br />
Risk management programme<br />
The Company has relaunched its risk management programme<br />
known as <strong>Inchcape</strong> Peace of Mind (iPOM).This is a programme<br />
bringing together the various risk management projects and<br />
initiatives under one systematic and collective approach.<br />
iPOM aims to maximise opportunities to improve performance<br />
and meet strategic goals with an integrated, simple approach<br />
to risk management.Through iPOM we will constantly seek to instill<br />
the right behaviours across the organisation and to ensure that<br />
compliance continues to be embedded within the Group’s way<br />
of operating.<br />
60<br />
<strong>Inchcape</strong> plc ¦ <strong>Annual</strong> <strong>Report</strong> and Accounts 2009
Section Two<br />
Two<br />
Governance<br />
iPOM – 7 Key steps<br />
Step<br />
1 Written<br />
compliance<br />
standards and<br />
procedures<br />
2 Oversight<br />
responsibilities<br />
assigned to<br />
appropriate<br />
personnel<br />
3 Appropriate<br />
delegation<br />
of authority<br />
4 Training and<br />
education<br />
5 Routine<br />
monitoring,<br />
reporting<br />
and auditing<br />
6 Enforcement<br />
and discipline<br />
7 Response<br />
and prevention<br />
Purpose<br />
What are the rules<br />
Who is in charge<br />
What employee education is in place<br />
regarding the rules and standards<br />
How do we know the rules are<br />
being followed<br />
What happens if the rules and<br />
standards are not being followed<br />
Examples of key projects for 2009, including key initiatives that were<br />
either introduced or reinforced were:<br />
• compliance certificates signed by all Managing Directors and<br />
Finance Directors as part of the year end process confirming<br />
that all key controls had been complied with and there were no<br />
outstanding issues to be resolved.<br />
• the Group Risk Register process continued, with a bottom up top<br />
down approach used to identify the key Group and market risks<br />
and to look at the impact of mitigating actions that had been<br />
implemented.The Business Risk Assessment forms part of the<br />
scheduled <strong>Annual</strong> Operating Plan process and monthly market<br />
review meetings as well as being a key agenda item for review<br />
at the RMSG and Audit Committee meetings;<br />
• a Group Subsidiary Governance Manual was rolled out to all<br />
markets in 2009.This sets out the policies that all operations<br />
within the Group are required to comply with, covering a number<br />
of areas including tax, treasury, finance, legal, company<br />
secretariat and HR.<br />
The RMSG is supported by market risk committees that share<br />
the common risk agenda, and which report to the RMSG on<br />
a regular basis.<br />
Control procedures and monitoring systems<br />
A Group Risk Register,which identifies the key risks,the impact should<br />
they occur and actions being taken to manage these risks at the<br />
desired level, is produced for each business unit. In addition, actions<br />
to be taken in the event that such risks crystallise and proposed<br />
improvements to the way they are managed are also included.<br />
The Group Risk Register is approved by the RMSG and the Executive<br />
Committee and discussed by the Audit Committee at its meetings.<br />
The Group also monitors its control procedures in the following<br />
key areas:<br />
Financial reporting<br />
There is a comprehensive system with an annual budget approved<br />
by Directors. Monthly actual results are reviewed and reported<br />
against budget and, where appropriate, revised forecasts are<br />
presented at Board meetings.<br />
Investment appraisal<br />
The Group has clearly defined policies for capital expenditure.<br />
These include annual budgets and detailed appraisal and<br />
review procedures.<br />
Internal Audit<br />
The adequacy and effectiveness of the Group’s internal control<br />
systems are monitored by the Internal Audit team who report to the<br />
Audit Committee on a regular basis. Internal Audit also works closely<br />
with management and the external auditors.<br />
Business Unit Controls<br />
Each business in the Group is required to identify its key risks and the<br />
control procedures in place to mitigate those risks.This evaluation<br />
takes place twice a year as part of the preparation and update of<br />
the business plans.<br />
During 2009, the Managing Director and Finance Director of each<br />
business unit in the Group signed a compliance certificate to<br />
confirm:<br />
• the accuracy and completeness of the accounts submitted<br />
for consolidation;<br />
• compliance with local laws and regulations;<br />
• the absence of fraud;<br />
• the absence of conflicted directorships; and<br />
• compliance with <strong>Inchcape</strong> policies.<br />
www.inchcape.com 61
Governance<br />
Corporate governance report continued<br />
Investor relations<br />
Shareholder profile<br />
As at 31 December 2009 the Company had 8,837 holdings on our<br />
register of ordinary shareholders (2008: 7,745).<br />
The distribution of holdings by size are shown in the table below:<br />
<strong>Inchcape</strong> share register at 31 December 2009<br />
By size Number Number<br />
of investment of holdings % of shares %<br />
Up to 1,000,000 8,530 96.5 206,912,103 4.5<br />
1,000,001 – 10,000,000 227 2.6 772,669,526 16.7<br />
10,000,001 – 25,000,000 44 0.5 692,329,511 14.9<br />
25,000,001 – 50,000,000 14 0.2 438,432,426 9.5<br />
50,000,001 – 100,000,000 13 0.1 888,199,855 19.2<br />
Over 100,000,000 9 0.1 1,632,171,553 35.2<br />
Total 8,837 100.0 4,630,714,974 100.0<br />
Source: Computershare<br />
Further analysis of the share register at the year end is shown in the<br />
pie charts below.As at 31 December 2009, 69% of the total share<br />
register was held on behalf of investment institutions such as<br />
pension funds, mutual funds, insurance funds and funds managed<br />
for private individuals.The majority of funds are managed from the<br />
UK including 7% in Scotland.<br />
Share register analysis by holder<br />
Other<br />
31%<br />
Private<br />
investor<br />
6%<br />
Insurance<br />
companies<br />
9%<br />
Share register analysis by geography<br />
Israel<br />
7%<br />
Europe<br />
5%<br />
USA<br />
13%<br />
Source: JP Morgan Cazenove<br />
Rest of World<br />
13%<br />
Pension funds<br />
14%<br />
Unit trusts and<br />
mutual funds<br />
40%<br />
UK<br />
62%<br />
Significant shareholdings<br />
As at 9 March 2010, the following notifications of substantial interests<br />
in the Company’s issued ordinary share capital had been received<br />
pursuant to the provisions of the Companies Act 2006 and DTR5:<br />
Holding No. of shares % Holding<br />
Mr George Horesh 414,877,810 8.99<br />
Prudential plc 388,519,165 8.43<br />
BlackRock Inc 299,768,603 6.51<br />
Axa SA 238,435,478 5.18<br />
Schroders plc 229,421,483 4.98<br />
F&C Asset Management plc 228,273,216 4.96<br />
FIL Limited 226,777,954 4.92<br />
Legal & General Group plc 184,091,394 3.99<br />
Aviva plc 181,563,408 3.94<br />
Source:TR-1 notifications received since the Rights Issue was completed.These are updated<br />
on the Company’s website.<br />
Communication with shareholders<br />
The Board recognises the importance of maintaining good<br />
communication with its shareholders to ensure a mutual<br />
understanding of the Company’s objectives and performance and<br />
in order to understand their issues and concerns.A comprehensive<br />
investor relations programme has been in place for many years.This<br />
is managed by the Group Chief Executive, Group Finance Director<br />
and Director of Corporate Affairs who meet with existing and<br />
prospective institutional investors on a regular basis.The Chairman<br />
and Non-Executive Directors are also given the opportunity to meet<br />
institutional shareholders.The Senior Independent Non-Executive<br />
Director is available to shareholders if contact through normal<br />
channels is inappropriate. Other meetings are held for investors and<br />
analysts that cover a wide range of issues including strategy,<br />
performance and governance. In total, during the year, members<br />
of the Board, and Investor Relations met over 170 existing or<br />
prospective shareholders or their representatives at these meetings,<br />
roadshows and at conferences.<br />
During the year shareholders are kept informed of the progress of<br />
the Company through the Preliminary announcement,AGM, Interim<br />
announcement, Interim Management Statements and of any other<br />
significant developments through press releases.These are made<br />
available to the London Stock Exchange and simultaneously<br />
available on the Company’s website www.inchcape.com along<br />
with other information about the Company.<br />
Presentations were held for analysts on the days of the release of<br />
our annual and half year results. Recorded conference calls are<br />
also held on the release of Interim Management Statements for<br />
analysts.These presentations and calls are recorded and published<br />
on the Company website so that all investors may access them.<br />
The Board is equally concerned with the views of private<br />
shareholders.The Group Company Secretary manages day to day<br />
communication with these shareholders and they are actively<br />
encouraged to give their views using the prepaid reply form issued<br />
each year with the AGM documentation.This is particularly useful<br />
for shareholders unable to attend the AGM in person or engage<br />
with the Directors and shareholders are invited to raise any matters<br />
62<br />
<strong>Inchcape</strong> plc ¦ <strong>Annual</strong> <strong>Report</strong> and Accounts 2009
Section Two<br />
Two<br />
Governance<br />
of interest to them.At the meeting the Company complies with the<br />
Code as it relates to voting, the separation of resolutions and the<br />
attendance of Committee Chairmen. In line with the Code, details<br />
of proxy voting by shareholders, including votes withheld, are made<br />
available on the Company’s website following the meeting.<br />
The Board is provided with regular updates on the views and issues<br />
raised by the Company’s investors. During the year, the Board<br />
received external presentations from advisors, including the<br />
Company’s brokers, on shareholder and market perception of the<br />
Company’s strategy.<br />
Analyst coverage<br />
We are aware of 12 analysts who have regularly published notes<br />
on <strong>Inchcape</strong> during 2009 and we provide names of these analysts,<br />
their firms and contact details on our website.<br />
Total shareholder return (TSR)<br />
The following graph illustrates the Group’s TSR over a five year<br />
period, relative to the performance of the total return index of the<br />
FTSE mid-250 group of companies (excluding investment trusts).TSR<br />
is essentially share price growth plus re-invested dividends.The FTSE<br />
mid-250 has been chosen as the most suitable comparator group<br />
as it is the general market index in which the Company appears.<br />
Historical TSR performance<br />
200<br />
150<br />
represents an average of 0.54% of the Company’s shares traded each<br />
day (2008: 0.49% adjusted for the bonus element of the Rights Issue).<br />
Share price by volume during 2009<br />
Volume<br />
900,000<br />
800,000<br />
700,000<br />
600,000<br />
500,000<br />
400,000<br />
300,000<br />
200,000<br />
100,000<br />
Apr<br />
09<br />
Source: Datastream<br />
May<br />
09<br />
Jun<br />
09<br />
Jul<br />
09<br />
Share consolidation<br />
On 10 March 2010, we proposed a 1 for 10 share consolidation to<br />
lessen the volitility the current level of share price generates and to<br />
decrease the cost of dealing in shares.This will reduce the shares in<br />
issue from approximately 4.6bn with a nominal value of 1.0p to<br />
approximately 460m shares with a nominal value of 10.0p.The<br />
share consolidation is subject to approval by shareholders at the<br />
<strong>Annual</strong> General Meeting to be held on 13 May 2010.<br />
Aug<br />
09<br />
Sep<br />
09<br />
Oct<br />
09<br />
Nov<br />
09<br />
Price (p)<br />
35<br />
Dec<br />
09<br />
30<br />
25<br />
20<br />
15<br />
10<br />
5<br />
100<br />
50<br />
0<br />
Dec 04<br />
Dec 05<br />
Dec 06<br />
Dec 07<br />
<strong>Inchcape</strong> FTSE mid 250 excluding investment trust<br />
Source: Datastream<br />
Dec 08<br />
Dec 09<br />
Growth in the value of a hypothetical £100 Holding over five years<br />
FTSE 250 (excluding investment companies) comparison based on<br />
30 trading day average values.<br />
Electronic communications<br />
<strong>Inchcape</strong> is committed to reducing its impact on the<br />
environment and the Company would like to encourage<br />
shareholders to receive communications electronically<br />
reducing printing and paper usage.<br />
Shareholders can register for email alerts at<br />
www.inchcape.com/email<br />
However investors are able to receive communications in<br />
the form most appropriate to their needs and are entitled<br />
to change the way in which they receive shareholder<br />
communications at any time.<br />
Dealing in <strong>Inchcape</strong> shares<br />
The Company’s ordinary shares are listed on the London Stock<br />
Exchange. Prices are reported daily in the Financial Times and on<br />
our website. For further information please call Computershare<br />
Investor Services on +44 (0) 870 707 1076.<br />
The share price by volume during 2009 graph shows the steady<br />
growth in the share price since the Rights Issue closing at 29.85p<br />
as at 31 December 2009.The Company’s shares trade within<br />
the FTSE 250 index and at the year end was ranked 136 in the<br />
FTSE 350 index by market capitalisation (2008: 342).The Company’s<br />
market capitalisation at 31 December 2009 was £1,374.3m, an<br />
increase of over eight times its market capitalisation of £169.2m<br />
at 31 December 2008.The average number of shares traded on<br />
the London Stock Exchange daily was 24.7m (2008: 22.5m).This<br />
www.inchcape.com 63
Governance<br />
Corporate governance report continued<br />
Graham Pimlott<br />
Audit Committee<br />
Chairman<br />
2009 highlights<br />
• From 2010, increase the number of scheduled Audit<br />
Committee meetings to allow a balanced focus on financial<br />
and non-financial risks and controls.<br />
2010 objectives<br />
• Continued focus on compliance and risk management<br />
Members From To<br />
Graham Pimlott – Chairman 14 May 2009 To date<br />
Will Samuel 26 January 2005 To date<br />
Michael Wemms 29 January 2004 To date<br />
David Scotland 24 February 2005 To date<br />
Alison Cooper 1 July 2009 To date<br />
Nigel Northridge 5 March 2010 To date<br />
Audit Committee <strong>Report</strong><br />
Governance<br />
The Audit Committee is chaired by Graham Pimlott who was a<br />
member of the Auditing Practices Board until March 2010. Graham<br />
took over the role as Chairman from Ken Hanna on 14 May 2009.All<br />
the members are Non-Executive Directors.Will Samuel is a chartered<br />
accountant and the Board has determined that Will has recent and<br />
relevant financial experience.<br />
The Audit Committee met three times during 2009, to coincide with<br />
the key dates in the Company’s financial calendar.Attendance is<br />
shown on page 58. In addition to the scheduled meetings the Audit<br />
Committee meets with the external auditors twice a year.The Audit<br />
Committee reviewed its way of working and the balance of focus on<br />
financial and non-financial risks and agreed that from 2010,the Audit<br />
Committee will meet four times per year in order to give the<br />
Committee more time to consider the key activities delegated to it.<br />
No one other than the Audit Committee Chairman and its members<br />
are entitled to attend the meetings however, the Chairman, Group<br />
Chief Executive, Group Finance Director, Group Audit and Risk<br />
Director and the external auditors attend by invitation.<br />
The Audit Committee may take external legal, accounting or other<br />
advice at the Company’s expense when it believes it necessary to<br />
do so. Other than discussions with the Company’s external auditors,<br />
none was taken during 2009.<br />
The primary responsibilities of the Audit Committee are financial<br />
reporting; internal control and risk management systems; internal<br />
audit and external audit.The Audit Committee discharged all its<br />
responsibilities, as set out in its Terms of Reference, during the year.<br />
The full Terms of Reference can be found at<br />
www.inchcape.com/aboutus/corporategovernance.<br />
Activities<br />
During 2009, the principal activities of the Audit Committee<br />
included the following:<br />
• review and approval of interim and full year results and any other<br />
formal announcement relating to financial performance;<br />
• review of the internal audit plan and the results of the internal<br />
auditors’ work, including monitoring management’s<br />
responsiveness to findings and recommendations;<br />
• review of the Company’s internal financial controls and the<br />
internal control and risk management system;<br />
• approval of the terms of engagement with the external auditor at<br />
the start of each audit and the scope of the audit to be provided;<br />
• review of the audit plan with the external auditor at the planning<br />
and reporting stages;<br />
• effectiveness of the internal and external audit function;<br />
• whistleblowing provisions;<br />
• relevant disclosures in this <strong>Report</strong>; and<br />
• review of its Terms of Reference.<br />
As part of the approval process for the appointment of the external<br />
auditor, the Committee is responsible for monitoring the objectivity,<br />
independence and performance of the external auditor.The<br />
Committee is satisfied that the external auditor continues to be<br />
effective.The Committee recommends the Board propose a<br />
resolution to re-appoint the auditors at the AGM.<br />
PricewaterhouseCoopers LLP have been the Company’s auditors for<br />
over ten years.The Audit Committee considers that the relationship<br />
with the auditors is working well and remains satisfied with their<br />
effectiveness.Accordingly, it has not considered it necessary to<br />
require the firm to tender for the audit work.The external auditors are<br />
required to rotate the audit partners responsible for the Group audit<br />
every five years. In accordance with best practice guidelines the<br />
current audit partner will step down during 2010 and his<br />
responsibilities will be transferred to another partner.There are no<br />
contractual obligations restricting the Company’s choice of<br />
external auditor.<br />
64<br />
<strong>Inchcape</strong> plc ¦ <strong>Annual</strong> <strong>Report</strong> and Accounts 2009
Section Two<br />
Two<br />
Governance<br />
In addition to the above activities, the Audit Committee reviewed its<br />
policy regarding the scope and extent of any non audit services<br />
provided to it by its auditors.The purpose of the policy is to ensure<br />
that the external auditors remain objective and independent.<br />
A procedure is in place which must be complied with prior to the<br />
external auditors being engaged in non audit work which is<br />
approved by the Audit Committee.There is a clear division of<br />
responsibility between audit and non audit staff and restrictions are<br />
imposed on permitted areas of non audit work.The Company has<br />
acted in compliance with this policy during 2009.<br />
The Company has a guideline that the auditors should not<br />
normally earn more for non audit services than for audit services.<br />
In 2009, the audit fees were just less than the aggregate of the fees<br />
earned by the auditors for other work. During the year the auditors<br />
were heavily engaged in work relating to the Rights Issue which<br />
closely related to their function as auditors.Also, the auditors<br />
advised on a number of tax matters which are expressly permitted<br />
under the policy.A full statement of the fees paid for audit and non<br />
audit services is provided in note 3d on page 104.The Company<br />
does not consider that this work, or the fees earned, have<br />
compromised the independence of the auditors.<br />
The Company’s whistleblowing policy is communicated to<br />
employees on a global basis.The policy enables employees to raise<br />
concerns with the Disclosure Response Team in cases where<br />
conduct may be deemed to be contrary to the Company’s values.<br />
Nominations Committee <strong>Report</strong><br />
Governance<br />
The Nominations Committee is chaired by Ken Hanna who is<br />
Chairman of the Board of Directors. It comprises three independent<br />
Non-Executive Directors and the Group Chief Executive.<br />
Only members of the Nominations Committee have the right to attend<br />
Committee meetings. However, other individuals such as the Group<br />
Human Resources Director and external advisors may be invited to<br />
attend for all or part of any meeting, as and when appropriate.<br />
The Nominations Committee formally met three times during 2009.<br />
Attendance of these meetings is shown on page 58.<br />
The responsibilities of the Nominations Committee include the<br />
balance of Board membership; leadership needs of the Group<br />
and succession planning.The Nominations Committee<br />
discharged its responsibilities as set out in its Terms of Reference<br />
during the year.The full Terms of Reference can be found at<br />
www.inchcape.com/aboutus/corporategovernance.<br />
Activities<br />
The principal activities during 2009 were:<br />
• review of the size and composition of the Board;<br />
• succession planning for the Board and key management;<br />
• appointments of Non-Executive Directors; and<br />
• election and re-election of Directors.<br />
As set out in last year’s <strong>Annual</strong> <strong>Report</strong>, Peter Johnson retired at the<br />
2009 AGM and was succeeded by Ken Hanna as Chairman of the<br />
Group and the Nominations Committee.Graham Pimlott took over<br />
Ken’s role as Chairman of the Audit Committee.<br />
During 2009, the Nominations Committee reviewed the Board’s<br />
composition and the types of skills it considered would benefit the<br />
Ken Hanna<br />
Nominations Committee<br />
Chairman<br />
2009 highlights<br />
• Change of Chairman<br />
• New appointments to the Board<br />
2010 objectives<br />
• Composition of the Board<br />
• New corporate responsibility committee<br />
Members From To<br />
Ken Hanna – Chairman 14 May 2009 To date<br />
Will Samuel 1 April 2005 To date<br />
Michael Wemms 29 July 2004 To date<br />
David Scotland 29 November 2005 To date<br />
André Lacroix 1 January 2006 To date<br />
Group in the future and to enhance the balance of the Board.An<br />
external recruitment company identified Alison Cooper and Nigel<br />
Northridge as suitable candidates and following a rigorous interview<br />
process they were appointed on 1 July as recommended by the<br />
Nominations Committee.Each received a formal letter of appointment<br />
setting out clearly what is expected in terms of time commitment,<br />
committee service and involvement outside Board meetings.<br />
John McConnell was promoted to Group Finance Director from Chief<br />
Executive of <strong>Inchcape</strong> Australasia with effect from 1 October 2009.<br />
The Nominations Committee made recommendations for the<br />
election and re-election, by shareholders, of Directors retiring at the<br />
2010 AGM. No Director was present when his or her election or reelection<br />
was considered. In particular, the Nominations Committee<br />
www.inchcape.com 65
Governance<br />
Corporate governance report continued<br />
Michael Wemms<br />
Remuneration Committee<br />
Chairman<br />
2009 highlights<br />
• Review of remuneration policy during the challenging<br />
environment<br />
• Shareholder consultation<br />
2010 objectives<br />
• Remuneration strategy for 2010<br />
• Review of remuneration policy for 2011 onwards<br />
Members From To<br />
Michael Wemms – Chairman 13 May 2004 To date<br />
Will Samuel 26 January 2005 To date<br />
Ken Hanna 27 September 2001 To date<br />
David Scotland 24 February 2005 To date<br />
Nigel Northridge 1 July 2009 To date<br />
reviewed the continued service of any Non-Executive Director who<br />
has served six or more years to ensure that Board members<br />
continue to possess the skills deemed appropriate for the needs of<br />
the Company and its stakeholders.The Nominations Committee<br />
annually reviews the re-election of any Board member who has<br />
served for longer than nine years on the Board. Ken Hanna had<br />
completed eight years service as a Non-Executive Director prior to<br />
his appointment as Chairman on 14 May 2009.There were no other<br />
Directors with more than six years service during 2009.<br />
Remuneration Committee <strong>Report</strong><br />
Governance<br />
Michael Wemms is the Chairman of the Remuneration<br />
Committee.Throughout the year, the Committee was comprised<br />
wholly of independent Non-Executive Directors and continues<br />
to be so.The Chairman, Group Chief Executive, Group Company<br />
Secretary and Group Human Resources Director advise the<br />
Remuneration Committee internally and attend meetings upon<br />
invitation. No Director or Executive is involved in deciding his or<br />
her own remuneration.<br />
During 2009 the Remuneration Committee held three scheduled<br />
meetings.Attendance at these meetings is shown in the table on<br />
page 58.<br />
To ensure that the Remuneration Committee receives independent<br />
advice,Towers Watson was appointed by the Remuneration<br />
Committee as its external advisor.Towers Watson also provides<br />
advice to the Board on Non-Executive Directors’ fees and to the<br />
Group in connection with IFRS 2 Share-based payments.Towers<br />
Watson has no other connection with the Company other than<br />
as remuneration consultants.<br />
The responsibilities of the Remuneration Committee include setting<br />
the remuneration policy; the remuneration of the Chairman; sharebased<br />
incentive schemes and share performance targets.The<br />
Remuneration Committee is satisfied it discharged its responsibilities<br />
as set out in its Terms of Reference during the year.The full Terms of<br />
Reference can be found at<br />
www.inchcape.com/aboutus/corporategovernance.<br />
Activities<br />
The Remuneration Committee undertakes an annual review of the<br />
remuneration policy to ensure that it remains relevant and<br />
competitive. In addition, the Remuneration Committee reviews:<br />
• policy for all employee share schemes;<br />
• policy for long term incentive plans including level of individual<br />
grants and performance conditions;<br />
• award of bonuses;<br />
• policy and scope of pension arrangements for Executive Directors;<br />
• Executive Directors’ and senior executives’ salaries;<br />
• Chairman’s fees and terms and conditions of employment; and<br />
• Terms of Reference.<br />
During 2009 the Remuneration Committee carried out a<br />
consultation with its major shareholders in respect of the proposed<br />
changes to the remuneration policy.The Committee felt it<br />
appropriate to discuss its plans due to the difficult trading conditions.<br />
<strong>Full</strong> details can be found in the Directors Remuneration <strong>Report</strong>.<br />
The Remuneration Committee prepares the Directors Remuneration<br />
<strong>Report</strong> on behalf of the Board of Directors.The report is split into<br />
unaudited and audited sections and can be found on pages 68-74.<br />
66<br />
<strong>Inchcape</strong> plc ¦ <strong>Annual</strong> <strong>Report</strong> and Accounts 2009
Section Two<br />
Two<br />
Governance<br />
Chairman’s remuneration<br />
The Chairman’s remuneration was determined by the<br />
Remuneration Committee, taking advice from Towers Watson on<br />
best practice and competitive levels and, taking into account<br />
responsibilities and time commitment. Life assurance is provided<br />
under the <strong>Inchcape</strong> Group (UK) Pension Scheme but the<br />
appointment is not pensionable, nor is the Chairman eligible for<br />
pension scheme membership or participation in the Company’s<br />
bonus, share option or other incentive plan.<br />
Non-Executive Directors’ remuneration<br />
The remuneration for Non-Executive Directors consists of fees for<br />
services in connection with Board and Committee meetings. Fees<br />
for Non-Executive Directors are determined by the Board, within the<br />
restrictions contained in the Articles of Association. Non-Executive<br />
Directors fees are reviewed annually, taking advice from Towers<br />
Watson on best practice and competitive levels.The levels of<br />
remuneration for the Non-Executive Directors reflect the time<br />
commitment and responsibilities of the role.The Non-Executive<br />
Directors are not involved in deciding their fees.<br />
Non-Executive Directors are not eligible for pension scheme<br />
membership or participation in the Company’s bonus, share option<br />
or other incentive schemes.<br />
Details of the fees paid to the Chairman and Non-Executive<br />
Directors are shown on page 71.<br />
Policy on external appointments<br />
The Company recognises that its Executive Directors may be invited<br />
to become Non-Executive Directors of other companies and that<br />
this additional experience is likely to benefit the Company. Executive<br />
Directors are generally allowed to accept one Non-Executive<br />
appointment as long as it is not likely to lead to conflicts of interest<br />
or undue time commitments.The Group Chief Executive is<br />
permitted to hold two such appointments.The policy in respect of<br />
Executive Directors commitments is kept under review by the<br />
Nominations Committee.Any fees received for these duties may be<br />
retained by the Executive Director.<br />
André Lacroix is a Non-Executive Chairman of Good Restaurants AG<br />
for which he did not receive a fee and a Non-Executive Director of<br />
Reckitt Benckiser for which he received a fee of £85,000.<br />
www.inchcape.com 67
Governance<br />
Remuneration report<br />
Compliance<br />
This report complies with the Directors’ Remuneration <strong>Report</strong><br />
Regulations 2002 and other relevant requirements of the FSA Listing<br />
Rules. The Remuneration Committee believes that the Company<br />
has complied with the provisions regarding the remuneration<br />
matters contained within the Code.<br />
Details of those who served on the Remuneration Committee<br />
during the year and information on Towers Watson, who acted<br />
as remuneration consultants, can be found in the Remuneration<br />
Committee report on pages 66-67.<br />
Remuneration policy<br />
The current remuneration policy was introduced in October 2007.<br />
In establishing the policy the Remuneration Committee had regard<br />
to the need to:<br />
• continue to align with and support the Company’s<br />
business strategy;<br />
• allow the Company to motivate and retain its executive<br />
management whilst having regard to pay and conditions<br />
throughout the Group;<br />
• recruit executives of high quality; and<br />
• safeguard interests of shareholders by aligning the remuneration<br />
package of executives with shareholder interests.<br />
The key elements of the remuneration policy are:<br />
Element of Package<br />
Base salary<br />
<strong>Annual</strong> bonus plan<br />
Long-term incentives<br />
(share options and<br />
co-investment plan)<br />
Pension and<br />
other benefits<br />
Policy<br />
• competitive (i.e. at or around median)<br />
when compared with those organisations<br />
of similar size, complexity and type;<br />
• link between the level of remuneration<br />
and the performance of the Group and<br />
the individual;<br />
• sufficient to attract and motivate talent;<br />
• reviewed annually.<br />
• relevant financial performance criterion;<br />
• Net Promoter Score;<br />
• stretching personal objectives.<br />
• link to long-term growth;<br />
• aligned to shareholders interests;<br />
• personal financial commitment.<br />
• market competitive.<br />
At the beginning of 2009 the Company was faced with an<br />
unprecendented global downturn in the car industry that started in<br />
the fourth quarter of 2008 and quickly spread throughout the world.<br />
The Remuneration Committee has monitored the remuneration<br />
policy carefully to ensure that it has remained appropriate for the<br />
challenging environment.<br />
The Remuneration Committee felt that whilst the overall<br />
remuneration policy was sound, actions were necessary to help<br />
drive the Company’s recovery and support the business in 2009.<br />
In summary it was agreed that:<br />
• there were no increases to Executive Directors’ and Executive<br />
Committee members’ salaries;<br />
• the co-investment plan was suspended; and<br />
• no bonus payments were made in 2009 against 2008 targets<br />
for Executive Directors.<br />
In addition, due to the market conditions and the critiera that had<br />
been set, executive share options and restricted share awards that<br />
had been due to vest for Executive Directors lapsed as the<br />
performance conditions were not met.<br />
Shareholder consultation<br />
The Remuneration Committee consulted with shareholders and<br />
shareholder representative bodies in April 2009 to explain the<br />
Company’s position and the need to support the underlying<br />
strategy as well as to understand shareholders’ respective views.<br />
In particular, it was considered necessary to amend the<br />
performance criteria for short and long term incentives to ensure<br />
alignment with the needs of recovery. The three year plan (2009 –<br />
2011) which was the base for the executive share option grant of<br />
2009 was developed at the beginning of 2009 whilst the Group<br />
was implementing its recovery strategy.<br />
The Group successfully completed its Rights Issue in April 2009<br />
thanks to the strong support of its shareholders. To mitigate the<br />
effects of the downturn from an operational perspective,<br />
management focused on the execution of five priorities: growing<br />
market share, growing aftersales, reducing costs, managing working<br />
capital and selective capital expenditure investments. The<br />
execution of these self help initiatives has delivered excellent results<br />
as the Group was able to extract more costs than planned and<br />
managed to reduce working capital faster than expected.<br />
Moreover the Group outperformed its competitors in the market<br />
place by gaining market share in most markets and by improving<br />
customer service. The trading performance also benefited from a<br />
stronger performance in the second half of the year in Hong Kong,<br />
Australia and the UK.<br />
In light of these challenging market conditions and mindful of<br />
the need to encourage the right behaviours to best position the<br />
Company to manage the downturn and to take advantage of<br />
any upturn, the Remuneration Committee refined elements of the<br />
remuneration policy for this period. In particular the Remuneration<br />
Committee reviewed its position on executive share option grants<br />
to senior management and the Group Chief Executive.<br />
2009 summary<br />
It was decided that:<br />
• the annual bonus would have an operating profit qualifier<br />
and would be based on an internal measure of cash flow from<br />
operating activities (CFOA);<br />
• vesting of executive share options granted in 2009 would be<br />
based on a cumulative three year CFOA growth measure; and<br />
• there would be a one off executive share option award made to<br />
the Group Chief Executive, with additional performance criteria.<br />
Whilst there was a range of views amongst the shareholders<br />
consulted, the consultation was successful overall. As part of this<br />
68<br />
<strong>Inchcape</strong> plc ¦ <strong>Annual</strong> <strong>Report</strong> and Accounts 2009
Section<br />
Two<br />
Two<br />
Governance<br />
process, the Company committed to providing details of the first<br />
year’s CFOA.<br />
The strong trading throughout the year, despite very difficult market<br />
conditions worldwide, enabled the Group to deliver a financial<br />
performance ahead of its plan on all financial metrics (revenue,<br />
margin, cash). The CFOA in 2009, for the purposes of the<br />
remuneration schemes, was £344.2m, 53.2% ahead of last year and<br />
57.8% ahead of first year performance target despite a revenue<br />
decline of 16.6% (all in constant currency) which demonstrates the<br />
significant impact of the management initiatives.<br />
2010 summary<br />
The Remuneration Committee recognises the valuable input<br />
provided by shareholders and has taken into account comments<br />
received in 2009 as part of its 2010 remuneration planning<br />
processes. The Remuneration Committee has decided:<br />
• salaries for Executive Committee members will be frozen during<br />
2010 as in 2009;<br />
• the co-investment plan will be suspended for a second year; and<br />
• changes to the annual bonus plan will be introduced to ensure<br />
there is greater visibility of non-financial measures.<br />
2011 planning<br />
As market conditions improve, the Remuneration Committee<br />
will review its longer term remuneration strategy and it intends to<br />
further consult with shareholders as part of its 2011 remuneration<br />
planning process.<br />
Base salary<br />
As discussed, base salaries were frozen across the Group for 2009.<br />
The Remuneration Committee, supporting the Company’s<br />
commitment to increase cash flow and reduce costs, felt that salary<br />
increases would be inappropriate.<br />
The Remuneration Committee has also decided that salaries<br />
would be frozen during 2010 for members of the Executive<br />
Committee. The Remuneration Committee considered this decision<br />
was in keeping with the need for the Company to continue its focus<br />
on costs and margins.<br />
<strong>Annual</strong> bonus<br />
The bonus plan for 2009 had an operating profit qualifier and was<br />
based on 70% CFOA, 20% Net Promoter Score (NPS) and 10% on<br />
personal objectives.<br />
For 2009, the Company met its performance targets for CFOA and<br />
NPS. The personal objectives relate to the development and<br />
implementation of the Company’s strategy. The goals are based on<br />
relevant qualitative non-financial metrics, the achievement of<br />
strategic milestones and the demonstration of appropriate<br />
leadership behaviours. André Lacroix fully achieved his personal<br />
objectives in 2009. John McConnell also achieved his personal<br />
objectives and will receive a pro-rated bonus for his time as Group<br />
Finance Director. The resultant bonus payments are shown in the<br />
emoluments table on page 71.<br />
For 2010,the Remuneration Committee have made further<br />
amendments to the bonus targets to take into account the evolving<br />
strategic needs of the business and the interests of shareholders<br />
and employees. Accordingly, the 2010 annual bonus plan will<br />
consist of 70% financial measures comprising operating profit and<br />
working capital, and following previous consultation with<br />
shareholders, 30% non-financial measures based on NPS. This<br />
improves the visibility of the non-financial elements of the bonus<br />
scheme by removing the 10% personal objective element.<br />
Executive share option plan<br />
As previously discussed, the Remuneration Committee decided to<br />
use cumulative CFOA for the performance period 2009 – 2011 as<br />
the performance measure for executive share options granted in<br />
2009 rather than the EPS measure used in previous years. The<br />
Committee considered the CFOA performance measure was<br />
appropriate to the Company’s business strategy during the period.<br />
The normal level of grant for Executive Directors of two times base<br />
salary was made. The Group Chief Executive received a one off<br />
grant of an additional two tranches, details of which are given on<br />
page 72. The one off award will only vest if certain additional<br />
performance criteria are met. The first tranche will vest if the share<br />
price achieves a maximum trading price of 25p or more for 20<br />
consecutive days anytime within the period from 20 May 2012 to<br />
20 April 2014. The second tranche will vest if the share price achieves<br />
a minimum trading price of 35p or more for 20 consecutive days<br />
in the same period.<br />
All other options granted in 2009 will vest according to the following<br />
sliding scale:<br />
CFOA growth per annum<br />
Vesting Percentage<br />
Less than 70% of target 0%<br />
70% to 99% of target 25%<br />
100% of target 100%<br />
Between 70% and 100%<br />
Straight line basis<br />
Details of options granted to Executive Directors are shown on<br />
pages 72-74.<br />
Options granted before 2009 will vest according to the following<br />
sliding scale:<br />
EPS growth per annum<br />
Vesting Percentage<br />
Less than RPI+3% 0%<br />
RPI+3% 25%<br />
RPI+8% 100%<br />
Between RPI+3% and RPI+8%<br />
There will be no retesting<br />
Straight line basis<br />
The Remuneration Committee felt that the CFOA performance<br />
measure was essential for the unique circumstances prevailing at<br />
the time for the 2009-2011 executive share option grant. Looking<br />
forward the Remuneration Committee has decided to revert to the<br />
EPS performance measure for options that may be granted in 2010.<br />
Co-investment plan<br />
The co-investment plan was introduced during 2008 after receiving<br />
shareholder approval in 2007. The plan is a voluntary plan for<br />
Executive Directors and certain other senior executives and<br />
replaced the deferred bonus plan. The Group Chief Executive can<br />
invest up to 50%, and the Group Finance Director can invest up to<br />
40%, of post tax salary to obtain ordinary shares in the Company. In<br />
exceptional circumstances the Remuneration Committee may<br />
determine that circumstances justify that up to 100% of post tax<br />
salary can be invested. No such exceptional circumstances have<br />
arisen to date.<br />
www.inchcape.com 69
Governance<br />
Remuneration report continued<br />
The plan has been extended to certain other senior executives<br />
below Board level.<br />
The shares acquired will be matched at the end of the three year<br />
vesting period. The match will be determined by performance<br />
against the cumulative Economic Profit target.<br />
For 2008 awards will vest according to the following sliding scale:<br />
EP growth over three years<br />
Matching shares<br />
Less than RPI+3% 0<br />
RPI+3% 1:1<br />
RPI+12% 2:1<br />
Between RPI+3% and RPI+12%<br />
Straight line basis<br />
The Remuneration Committee decided to suspend the coinvestment<br />
plan during 2009. This decision was taken since the plan<br />
is designed to stretch performance and due to the downturn in the<br />
second half of 2008 and 2009, it was improbable that there would<br />
be any matching element.<br />
The Remuneration Committee has also decided to suspend the coinvestment<br />
plan for 2010. The Remuneration Committee noted the<br />
concerns of shareholders in respect of lower share prices creating<br />
the opportunity for windfall gains. Therefore this decision has been<br />
taken since the existing performance conditions would not be<br />
stretching enough when viewed in context of the recovery phase<br />
of the business.<br />
Deferred bonus plan<br />
The deferred bonus plan was a voluntary plan for Executive Directors<br />
and certain other senior executives. Final awards under this plan<br />
were made in 2007. Details of these awards are shown on page 73.<br />
Participants in the plan were able to invest a minimum of 10% and<br />
maximum of 75% post tax annual bonus to acquire ordinary shares<br />
in the Company. The shares are then matched on a 1:1 basis at the<br />
end of a three year vesting period. For Executive Directors there is a<br />
performance condition attached to the vesting of the award shares<br />
of EPS growth of RPI+3% per annum with no retesting. This<br />
performance target was not achieved for the awards granted in<br />
2007, therefore the award will lapse in full.<br />
Save as you earn (SAYE)<br />
Executive Directors are eligible to participate in the Company’s SAYE<br />
scheme on the same terms as other employees. Participants make<br />
monthly savings, to a maximum of £250 per month, over a three<br />
year period. At the end of the savings period the funds are used to<br />
purchase shares under option. The acquisition of shares under this<br />
scheme is not subject to the satisfaction of a performance target.<br />
Executive share ownership<br />
To emphasise the importance the Remuneration Committee places<br />
on executive share ownership, Executive Directors are required to<br />
hold a fixed number of shares equivalent to 200% of base salary.<br />
Each Executive Director has five years from 2007, or date of<br />
appointment (if later), to reach this shareholding target. As at<br />
31 December 2009, André Lacroix and John McConnell held 181%<br />
and 110% respectively of base salary in shares.<br />
Retirement benefits<br />
The <strong>Inchcape</strong> Group (UK) Pension Scheme (UK Scheme) provides<br />
benefits for Executive Directors and certain senior executives at<br />
normal retirement age of 65, equal to a maximum of two thirds<br />
of final base salary, where salary has scheme specific ceiling of<br />
£123,600 in the 2009/10 tax year, subject to completion of between<br />
20 and 40 years’ service. Pensions in payments are guaranteed to<br />
increase in line with the lesser of 5% and the increase in the RPI.<br />
The UK Scheme requires members who join after March 2005 to<br />
contribute 7% of base salary up to the scheme specific ceiling of<br />
£123,600 in the 2009/10 tax year.<br />
Executive Directors, whose base salary is higher than £123,600,<br />
are paid a monthly cash supplement to enable them to make<br />
additional pension arrangements. Barbara Richmond and John<br />
McConnell received such supplements in 2009. Details of the<br />
amounts paid are shown on page 71. André Lacroix received<br />
a cash supplement of 40% of his base salary in lieu of a formal<br />
pension provision. He is not a member of the UK Scheme except<br />
in respect of the life assurance benefit for death in service.<br />
A lump sum life assurance benefit of four times full base salary<br />
is provided on death in service. For pension scheme members,<br />
a spouse’s pension of either half or two thirds of the prospective<br />
member’s pension may also be payable. Children’s pensions<br />
may also be payable, up to half of the member’s pension.<br />
Taxable and other benefits<br />
These include items such as Company cars, medical care and<br />
life assurance premiums. These benefits are in line with the<br />
remuneration policy framework outlined in this report. These benefits<br />
are non-pensionable.<br />
Total Shareholder Return (TSR)<br />
The TSR graph is shown in the investor relations section of the<br />
Corporate Governance report on page 63.<br />
Service contracts<br />
The Company’s policy is for Executive Directors’ service contract<br />
notice periods to be no longer than 12 months, except in<br />
exceptional circumstances. All current contracts contain notice<br />
periods of 12 months. In the event of termination the Company will<br />
seek fair mitigation of contractual rights. Within legal constraints, the<br />
Remuneration Committee tailors its approach, in the event of early<br />
termination, to the circumstances of each individual case.<br />
Non-Executive Directors are appointed for an initial period of<br />
three years, which may be extended by agreement with the Board.<br />
No Non-Executive Director is engaged on a service contract with<br />
the Company.<br />
Name Date of contract Notice period Unexpired term<br />
André<br />
Lacroix<br />
John<br />
McConnell<br />
By order of the Board<br />
01 September 05 12 months from the<br />
Director;<br />
12 months from the<br />
Company<br />
To normal<br />
retirement age<br />
01 October 09 12 months from the<br />
Director;<br />
12 months from the<br />
Company<br />
To normal<br />
retirement age<br />
Michael Wemms<br />
Chairman of the Remuneration Committee<br />
9 March 2010<br />
70<br />
<strong>Inchcape</strong> plc ¦ <strong>Annual</strong> <strong>Report</strong> and Accounts 2009
Section<br />
Two<br />
Two<br />
Governance<br />
Notes to the Board report on Remuneration<br />
(audited)<br />
1. Individual emoluments for the year<br />
The table below shows a breakdown of remuneration, including taxable and other benefits for each Director. Details of pension<br />
entitlements, share options and other long term incentive plans are shown in notes 2, 3, 4 and 5 on pages 72-74<br />
Company contributions<br />
Taxable and paid in year in respect<br />
Base salary/fees Bonus other benefits (f) of pension arrangements Termination payment Total remuneration (g)<br />
2009 2008 2009 2008 2009 2008 2009 2008 2009 2008 2009 2008<br />
£’000 £’000 £’000 £’000 £’000 £’000 £’000 £’000 £’000 £’000 £’000 £’000<br />
Chairman<br />
Peter Johnson<br />
(left 14 May 2009)(a) 110.6 296.5 – – 0.5 1.6 – – – – 111.1 298.1<br />
Ken Hanna 201.3 54.0 – – 7.3 – – – – – 208.6 54.0<br />
Executive<br />
Directors<br />
André Lacroix (b) 756.0 742.0 907.2 – 18.4 18.4 302.4 296.8 – – 1,984.0 1,057.2<br />
John McConnell (c)<br />
(appointed<br />
1 October 2009) 97.5 – 117.0 – 38.2 – 20.0 – – – 272.7 –<br />
Barbara Richmond (d)<br />
(left 30 June 2009) 225.0 441.4 225.0 – 10.4 19.5 49.4 97.5 572.0 – 1,081.8 558.4<br />
Non-Executive<br />
Directors<br />
Raymond Ch’ien (e)<br />
(left 14 May 2009) 13.3 36.0 – – – 12.9 – – – 13.3 48.9<br />
Alison Cooper (e)<br />
(appointed<br />
1 July 2009) 20.0 – – – – – – – – – 20.0 –<br />
Karen Guerra (e)<br />
(left 14 May 2009) 15.0 40.0 – – – – – – – – 15.0 40.0<br />
Nigel Northridge (e)<br />
(appointed<br />
1 July 2009) 20.0 – – – – – – – – – 20.0 –<br />
Graham Pimlott (e) 44.8 31.7 – – – – – – – – 44.8 31.7<br />
William Samuel (e) 70.0 70.0 – – – – – – – – 70.0 70.0<br />
David Scotland (e) 48.0 48.0 – – – – – – – – 48.0 48.0<br />
Michael Wemms (e) 54.0 54.0 – – – – – – – – 54.0 54.0<br />
Total 1,675.5 1,813.6 1,249.2 – 74.8 52.4 371.8 394.3 572.0 – 3,943.3 2,260.3<br />
Notes on Directors’ emoluments:<br />
a) The Company agreed to extend post retirement medical expenses for Peter Johnson and his wife until 13 May 2011.<br />
b) The payment of £302,400 (2008 – £296,800) was paid directly to André Lacroix to allow him to make his own pension arrangements<br />
outside the Company’s plan. This payment was subject to tax. The salary paid to André in 2008 includes three months at his 2007 salary<br />
level as salary increases are in April of each year. There was no further increase in 2009.<br />
c) The payment of £19,980 (2008 – none) was paid to John McConnell to allow him to make his own pension arrangements outside the<br />
Company’s plan. This payment was subject to tax.<br />
d) Barbara Richmond left the Group on 30 June 2009. In accordance with the terms of her contract she was paid the sum of £402,000,<br />
subject to the deduction of tax in lieu for the balance of her notice together with a payment of £120,000 in lieu of her pension<br />
supplement, a termination payment of £50,000 and a bonus payment of £225,000.<br />
e) The details shown include fees at the rate of £10,000 per annum for the Audit Committee and Remuneration Committee Chairmanships<br />
and at the rate of £4,000 per annum for each of the Audit, Remuneration and Nomination Committee memberships. Raymond Ch’ien,<br />
Karen Guerra and Peter Johnson left the Group on 14 May 2009.<br />
f) Taxable and other benefits comprise such items as company car, medical care, life assurance premiums, petrol allowance and<br />
relocation expenses. All Executive Directors are entitled to such benefits.<br />
g) No Directors waived emoluments in respect of the year ended 31 December 2009 (2008 – none).<br />
www.inchcape.com 71
Governance<br />
Notes to the Board report on Remuneration (audited) continued<br />
2. Directors’ pension entitlements<br />
Transfer value<br />
Increase in Increase in (less director’s Difference in<br />
accrued accrued Accumulated Accumulated contributions) transfer value<br />
pension pension total of total of of the increase Transfer value Transfer value less any<br />
during during accrued accrued in accrued of accrued of accrued contributions<br />
the year the year pension at pension at benefit net benefits at benefits at made in<br />
£’000 (net of inflation) 31.12.08 31.12.09 of inflation 31.12.09 01.01.09 the year<br />
Barbara Richmond 2.5 2.2 10.3 12.8 25.5 152.8 108.6 40.0<br />
John McConnell 1.0 1.0 – 1.0 9.9 12.0 – 9.9<br />
The transfer value has been calculated in accordance with the Retirement Benefits Schemes Transfer Values (GN 11), 6 April 2002.<br />
The transfer values of the accrued benefits represent the value of assets that the pension scheme would need to transfer to another<br />
pension provider on transferring the scheme’s liability in respect of the Director’s pension benefits. The transfer values do not represent sums<br />
payable or due to the individual Directors and therefore cannot be added meaningfully to annual remuneration.<br />
No Directors made any contributions to their pension in respect of the above during the year.<br />
3. Directors’ share options<br />
Held at<br />
Options 01.01.09<br />
held after Granted (or date of<br />
Held at Lapsed Rights Issue during appointment Exercise<br />
31.12.09 during year adjustment the year if later) price (c) Exercise period<br />
André Lacroix 2,054,690 (a) – 2,054,690 (a) – 346,362 (a) 60.34p Sept 2008 – Sept 2015<br />
– 278,442 (a) – – 278,442 (a) 75.07p Mar 2009 – Mar 2016<br />
1,439,354 (a) – 1,439,354 (a) – 242,634 (a) 97.26p Apr 2010 – Apr 2017<br />
2,095,675 (a) – 2,095,675 (a) – 353,271 (a) 72.14p Apr 2011 – Apr 2018<br />
28,053 (b) – 28,053 (b) – 4,729 (b) 34.22p Nov 2011 – May 2012<br />
7,560,000 (a) – – 7,560,000 (a) – 20.00p May 2012 – May 2019<br />
3,780,000 (a) – – 3,780,000 (a) – 20.00p May 2012 – May 2019<br />
3,780,000 (a) – – 3,780,000 (a) – 20.00p May 2012 – May 2019<br />
Barbara Richmond – 2,062,206 (a)2,062,206 (a) – 347,629 (a) 74.67p May 2009 – May 2016<br />
– 854,973 (a) 854,973 (a) – 144,124 (a) 97.26p Apr 2010 – Apr 2017<br />
– 1,247,424 (a)1,247,424 (a) – 210,280 (a) 72.14p Apr 2011 – Apr 2018<br />
– 2,540 (b) – – 2,540 (b) 62.03p Nov 2009 – May 2010<br />
John McConnell 177,468 (a) – – – 177,468 (a) 21.40p Mar 2006 – Mar 2013<br />
284,283 (a) – – – 284,283 (a) 44.16p May 2007 – May 2014<br />
216,442 (a) – – – 216,442 (a) 57.76p Mar 2008 – Mar 2015<br />
204,774 (a) – – – 204,774 (a) 97.26p Apr 2010 – Apr 2017<br />
489,525 (a) – – – 489,525 (a) 72.14p Apr 2011 – Apr 2018<br />
2,227,722 (a) – – 2,227,722 (a) 20.00p May 2012 – May 2019<br />
468,750 (a) – – 468,750 (a) – 32.00p Nov 2012 – Nov 2019<br />
72<br />
<strong>Inchcape</strong> plc ¦ <strong>Annual</strong> <strong>Report</strong> and Accounts 2009
Section<br />
Two<br />
Two<br />
Governance<br />
Notes on share options:<br />
a) Under the <strong>Inchcape</strong> 1999 Share Option Plan.<br />
b) Under the <strong>Inchcape</strong> SAYE Share Option Scheme.<br />
• There were no option exercises by Executive Directors during 2009.<br />
c) Exercise prices are determined in accordance with the rules of the relevant share option scheme.<br />
• All options were granted for nil consideration.<br />
• Exercise prices are shown after adjustment for the Rights Issue.<br />
• The table shows Directors’ options over ordinary shares of 25.0p at 1 January 2009 or date of appointment if later. After the Rights Issue<br />
the options are over ordinary shares of 1.0p as at 31 December 2009. The mid market price for shares at the close of business on<br />
31 December was 29.85p. The price range during 2009 was 11.8 p to 83.5p.<br />
• Options under the <strong>Inchcape</strong> 1999 Share Option Plan are granted on a discretionary basis to certain full time senior executives based<br />
within and outside the UK including Executive Directors of the Company. Such options are normally exerciserable between three and<br />
ten years of grant.<br />
• Details of the performance targets are given on page 69.<br />
• The <strong>Inchcape</strong> SAYE Share Option Scheme is open to employees in the UK with at least three months’ service. Participants make monthly<br />
savings for a three year period. At the end of the savings period options become exercisable within a six month period.<br />
4. Deferred bonus plan/co-investment plan<br />
Ordinary Ordinary<br />
Awarded shares shares Rights Issue Awarded<br />
ordinary lapsed exercised adjustment ordinary<br />
shares during during during shares Date<br />
31.12.09 the year the year the year 01.01.09 (a) of grant Exercise period<br />
André Lacroix – 13,825 – – 13,825 1 Jan 2006 Jan 2009 – Jun 2009<br />
886,360 – – 797,724 88,636 1 Jan 2007 Jan 2010 – Jun 2010<br />
Barbara Richmond – 303,030 – 272,727 30,303 1 Jan 2007 Jan 2010 – Jun 2010<br />
John McConnell 124,130 – – – 124,130 1 Jan 2007 Jan 2010 – Jun 2010<br />
Notes on the deferred bonus plan<br />
(a) As at 1 January 2009 or date of appointment, if later.<br />
• Directors will become entitled to award shares if they remain employed by the Company for three years and retain the shares<br />
purchased with their bonus throughout that period and the performance targets are met. Growth in the Company’s EPS over a three<br />
year period must exceed the increase in RPI over the same period by 3.0% per annum with no opportunity to retest in order for the<br />
award to vest. Special rules apply on termination of employment and change of control.<br />
• Awards granted on 1 January 2006 were purchased at 434.0p each. Awards granted on 1 January 2007 were purchased at 578.0p<br />
• Awards were adjusted on a 9 for 1 basis in line with the Rights Issue.<br />
Ordinary Ordinary<br />
Awarded shares shares Rights Issue Awarded<br />
ordinary lapsed exercised adjustment ordinary<br />
shares during during during shares Date<br />
31.12.09 the year the year the year 01.01.09 (a) of grant Exercise period<br />
André Lacroix 1,905,240 – – 1,714,716 190,524 1 Jan 2008 Jan 2011 – Jun 2011<br />
Barbara Richmond – 840,050 – 756,045 84,005 1 Jan 2008 Jan 2011 – Jun 2011<br />
John McConnell 296,690 – – – 296,690 1 Jan 2008 Jan 2011 – Jun 2011<br />
www.inchcape.com 73
Governance<br />
Notes to the Board report on Remuneration (audited) continued<br />
Notes on the co-investment plan<br />
(a) As at 1 January 2009 or date of appointment, if later<br />
• Directors will be entitled to matching shares if they remain employed by the Company for three years and retain the shares they have<br />
purchased under the Plan throughout that period and the performance targets are met. The Company’s Economic Profit (EP) must<br />
exceed the increase in RPI over the same period by 3.0% per annum to receive a one for one match. If the Company’s EP exceeds the<br />
increase in the RPI over the same period by 12.0% per annum the match is two for one. Special rules apply on termination of<br />
employment and change of control.<br />
• Awards granted on 1 January 2008 were purchased at 396.8p each.<br />
• Awards were adjusted on a 9 for 1 basis in line with the Rights Issue.<br />
5. Incentive plans<br />
Awarded ordinary Awarded ordinary<br />
Awarded ordinary shares lapsed shares exercised Awarded ordinary Market value of<br />
shares at 31.12.09 during year during year shares at 01.01.09 shares awarded Vesting period<br />
AL Incentive Plan – 39,000 – 39,000 357.5p 2008<br />
BR Incentive Plan – 59,612 – 59,612 428.7p 2008<br />
Notes on the incentive plans:<br />
• As reported last year, André Lacroix was the sole participant in the AL Incentive Plan. The final tranche of the AL Incentive Plan did not<br />
meet the performance targets set at the time of grant and lapsed in full.<br />
• As reported last year, Barbara Richmond was the sole participant in the BR Incentive Plan. The final tranche of the BR Incentive Plan did<br />
not meet the performance targets set at the time of grant and lapsed in full.<br />
By order of the Board<br />
Michael Wemms<br />
Chairman of the Remuneration Committee<br />
9 March 2010<br />
74<br />
<strong>Inchcape</strong> plc ¦ <strong>Annual</strong> <strong>Report</strong> and Accounts 2009
Section<br />
Two<br />
Two<br />
Governance<br />
Directors’ report<br />
The Directors present<br />
the <strong>Annual</strong> <strong>Report</strong> and<br />
Accounts and audited<br />
consolidated Financial<br />
statements for the year<br />
ended 31 December 2009.<br />
For the purposes of this report ‘Company’ means <strong>Inchcape</strong> plc<br />
and ‘Group’ means the Company and its subsidiary and<br />
associated undertakings.<br />
Business review<br />
The information that fulfils the requirements of the business review<br />
can be found in the operating review on pages 22-39, which is<br />
incorporated in this <strong>Report</strong> by reference. Information on the<br />
environment, employees, community and social issues is given<br />
in the Corporate Responsibility <strong>Report</strong> on pages 40-49.<br />
Directors<br />
The names of the Directors, including those Directors offering<br />
themselves for election, plus brief biographical details, are given on<br />
pages 52-53. Each Director held office throughout the year except<br />
Alison Cooper and Nigel Northridge (both appointed 1 July 2009)<br />
and John McConnell (appointed 1 October 2009). Karen Guerra,<br />
Raymond Ch’ien and Peter Johnson retired as Directors of the<br />
Company with effect from 14 May 2009.<br />
Alison, Nigel and John will offer themselves for election at the 2010<br />
<strong>Annual</strong> General Meeting.<br />
Principal activities<br />
A description of the principal activities of the Group and likely future<br />
developments and important events occurring since the end of the<br />
year are given in the operating review on pages 22-39.<br />
Results and dividends<br />
The Group’s audited consolidated Financial statements for the year<br />
ended 31 December 2009 are shown on pages 78-136.<br />
Given the significant downturn in the markets in which the Group<br />
operates, the Board does not consider it appropriate to<br />
recommend a final dividend for the year ended 31 December 2009.<br />
Auditors and disclosure of information to auditors<br />
So far as the Directors are aware, there is no relevant audit<br />
information of which the Company’s auditors are unaware.<br />
The Directors have taken all the steps that they ought to have taken<br />
as Directors in order to make themselves aware of any relevant<br />
audit information and to establish that the Company’s auditors are<br />
aware of that information.<br />
Directors’ indemnity<br />
A qualifying third party indemnity (QTPI), as permitted by the<br />
Company’s Articles of Association and sections 309A to 309C of the<br />
Companies Act 2006, has been granted by the Company to each<br />
of the Directors of the Company. Under the provisions of the QTPI the<br />
Company undertakes to indemnify each Director against liability<br />
to third parties (excluding criminal and regulatory penalties) and to<br />
pay Directors’ costs as incurred, provided that they are reimbursed<br />
to the Company if the Director is found guilty or, in an action<br />
brought by the Company, judgement is given against the Director.<br />
Events after the balance sheet date<br />
There have been no events after the balance sheet date.<br />
Directors’ interests<br />
The table below shows the beneficial interests in the ordinary shares<br />
of the Company of the persons who were Directors at 31 December<br />
2009. This excludes share options but includes interests of the<br />
Directors’ family members.<br />
31 Dec 2009 1 Jan 2009<br />
Ken Hanna 700,000 37,000<br />
André Lacroix 4,591,600 459,160<br />
John McConnell 1,438,225 57,840<br />
Alison Cooper 25,000 –<br />
Nigel Northridge 100,000 –<br />
Graham Pimlott 200,000 20,000<br />
Will Samuel 120,000 12,000<br />
David Scotland 112,980 11.298<br />
Michael Wemms 75,640 7,564<br />
There have been no changes to the number of shares held by<br />
Directors between 1 January 2010 and 9 March 2010.<br />
Employee benefit trust<br />
The Executive Directors of the Company, together with other<br />
employees of the Group, are potential beneficiaries of the<br />
<strong>Inchcape</strong> Employee Trust (Trust) and, as such, are deemed to be<br />
interested in any ordinary shares held by the Trust. At 31 December<br />
2009, the Trust’s shareholding totalled 13,797,362 ordinary shares<br />
(1 January 2008 – 2,315,380 ordinary shares)<br />
Between 1 January 2010 and 9 March 2010 the Trust did not<br />
transfer any shares to satisfy the exercise of awards under employee<br />
share plans.<br />
Charitable and political donations<br />
The Company did not make any charitable donations during 2009.<br />
No political donations were made during 2009.<br />
Principal financial risk factors<br />
These risks are shown on pages 38-39.<br />
Authority to purchase shares<br />
At the Company’s <strong>Annual</strong> General Meeting on Thursday 14 May<br />
2009, the Company was authorised to make market purchases<br />
of up to 460,366,500 ordinary shares (representing approximately<br />
10.0% of its issued share capital at that time). No such purchases<br />
were made during 2009. Shareholders will be asked to approve the<br />
renewal of this authority at the Company’s <strong>Annual</strong> General Meeting<br />
on 13 May 2010.<br />
www.inchcape.com 75
Governance<br />
Directors’ report continued<br />
Creditor payment policy<br />
The Company has no trade creditors (2008 – nil). The Group is<br />
responsible for agreeing the terms and conditions including terms<br />
of payment under which business transactions with the Group’s<br />
suppliers are conducted. Whilst the Group does not follow any<br />
single external code or standard, in line with <strong>Inchcape</strong> Group<br />
policy, payments to suppliers are made in accordance with agreed<br />
terms and conditions.<br />
Employees<br />
The Company is committed to a policy of treating all its colleagues<br />
and job applicants equally and to increasing the involvement of<br />
colleagues through engagement activities. <strong>Full</strong> details can be<br />
found in the Corporate Responsibility <strong>Report</strong> on pages 40-49.<br />
We are committed to the employment of people with disabilities<br />
and will interview all those candidates who meet the minimum<br />
selection criteria. We provide training and career development for<br />
our employees, tailored where appropriate to their specific needs,<br />
to ensure they achieve their potential. If an indivdual becomes<br />
disabled while in our employment, we will do our best to ensure<br />
continued employment in their role, including consulting them<br />
about their requirements, making appropriate adjustments and<br />
providing alternative suitable positions.<br />
Going concern<br />
After making enquiries, the Directors have a reasonable<br />
expectation that the Company and the Group have adequate<br />
resources to continue as a going concern for the foreseeable<br />
future. As such, the Company and the Group continue to adopt the<br />
going concern basis in preparing the annual report and accounts.<br />
Directors’ responsibilities<br />
The Directors are responsible for preparing the <strong>Annual</strong> <strong>Report</strong>, the<br />
Directors’ Remuneration <strong>Report</strong> and the Financial statements in<br />
accordance with applicable laws and regulations.<br />
Company law requires the Directors to prepare consolidated<br />
Financial statements for each financial year. Under that law the<br />
Directors have elected to prepare the Group Financial statements<br />
in accordance with International Financial <strong>Report</strong>ing Standards<br />
(IFRSs) as adopted by the European Union, and the parent<br />
company Financial statements in accordance with United<br />
Kingdom Generally Accepted Accounting Practice (United<br />
Kingdom Accounting Standards and applicable law). Under<br />
company law the Directors must not approve the Financial<br />
statements unless they are satisfied that they give a true and fair<br />
view of the state of affairs of the Group and the Company and of<br />
the profit or loss of the Group for that period. In preparing these<br />
Financial statements, the Directors are required to:<br />
• select suitable accounting policies and then apply them<br />
consistently;<br />
• make judgements and accounting estimates that are<br />
reasonable and prudent; and<br />
• state whether IFRSs are adopted by the European Union and<br />
applicable UK Accounting Standards have been followed, subject<br />
to any matieral departures disclosed and explained in the<br />
Group and parent company Financial statements respectively.<br />
The Directors are responsible for keeping adequate accounting<br />
records that are sufficient to show and explain the Company’s<br />
transactions and disclose with reasonable accuracy at any time<br />
the financial position of the Company and the Group and enable<br />
them to ensure that the Financial statements and the Directors’<br />
Remuneration <strong>Report</strong> comply with the Companies Act 2006 and,<br />
as regards the Group Financial statements, Article 4 of the ISAS<br />
Regulation. They are also responsible for safeguarding the assets of<br />
the Company and the Group and hence for taking reasonable steps<br />
for the prevention and detection of fraud and other irregularities.<br />
The Directors are responsible for the maintainance and integrity of<br />
the Company’s website. Legislation in the United Kingdom<br />
governing the preparation and dissemination of Financial<br />
statements may differ from legislation in other jurisdictions.<br />
Each of the Directors, whose names and functions are given on<br />
pages 52-53 confirm that, to the best of their knowledge:<br />
• the Group Financial statements, which have been prepared in<br />
accordance with IFRSs as adopted by the European Union, give<br />
a true and fair view of the assets, liabilities, financial position and<br />
profit of the Group, and<br />
• the operating review on pages 22-39 of the <strong>Annual</strong> <strong>Report</strong><br />
includes a fair review of the development and performance of<br />
the business and the position of the Group, together with a<br />
description of the principal risks and uncertainties that it faces.<br />
Share capital<br />
As at 31 December 2009, the Company’s issued share capital was<br />
£163,245,735.18 comprised of 4,630,714,974 ordinary shares of 1.0p<br />
each and 487,244,106 deferred shares of 24.0p each.<br />
Holders of ordinary shares are entitled to receive the Company’s<br />
<strong>Report</strong> and Accounts; to attend and speak at General Meetings<br />
and to appoint proxies and exercise voting rights. The shares do not<br />
carry any special rights with regard to control of the Company. The<br />
rights are set out in the Articles of Association of the Company.<br />
There are no restrictions or limitations on the holding of ordinary<br />
shares and no requirements for prior approval of any transfers. There<br />
are no known arrangements under which financial rights are held<br />
by a person other than the holder of the shares.<br />
The rights attaching to the Company’s deferred shares are set out<br />
in the Articles of Association of the Company. Holders of deferred<br />
shares have no voting, dividend or capital distribution rights, save<br />
for very limited rights on a winding up; the shares are not<br />
transferable and do not confer any rights of redemption.<br />
Shares acquired through the Company share schemes rank pari<br />
passu with the shares in issue and have no special rights.<br />
Significant shareholdings<br />
Disclosures received pursuant to DTR5 are shown on page 62 and<br />
these disclosures are incorporated by reference in this <strong>Report</strong>.<br />
Share consolidation<br />
As announced on 10 March 2010, the Board intends to propose a<br />
1 for 10 share consolidation of ordinary shares. The purpose of the<br />
share consolidation is to reduce the total number of ordinary shares<br />
now in issue following the Rights Issue undertaken in 2009 and to<br />
increase the likely price of the Company’s shares to a figure more<br />
76<br />
<strong>Inchcape</strong> plc ¦ <strong>Annual</strong> <strong>Report</strong> and Accounts 2009
Section<br />
Two<br />
Two<br />
Governance<br />
appropriate for a listed company of its size and nature in the<br />
UK market. The share consolidation is subject to approval by<br />
shareholders at the <strong>Annual</strong> General Meeting to be held on<br />
13 May 2010.<br />
Articles of Association<br />
The appointment and replacement of Directors are governed<br />
by the Company’s Articles of Association.<br />
Any changes to the Articles of Association must be approved by<br />
the shareholders in accordance with the Companies Act 2006,<br />
by way of special resolution.<br />
The Directors have authority to issue and allot ordinary shares<br />
pursuant to Article 7 of the Articles of Association and shareholder<br />
authority requested at each <strong>Annual</strong> General Meeting of the<br />
Company. The Directors also have authority to make market<br />
purchases of ordinary shares and this authority is also renewed<br />
annually at the <strong>Annual</strong> General Meeting.<br />
Change of control<br />
Save as described in the following paragraphs, the Company is not<br />
party to any significant agreements that would take effect, alter or<br />
terminate upon a change of control of the Company following a<br />
takeover bid.<br />
Certain of the Group’s third party funding arrangements would<br />
terminate upon a change of control of the Company.<br />
The Group’s relationship with its brand partners are managed<br />
at Group level. However, the relevant contracts are entered into<br />
at a local level,with day to day management being led by each<br />
operating business. Certain of the contracts may terminate on<br />
a change of control of the Company.<br />
The Company does not have agreements with any Director or<br />
employee providing compensation for loss of office or employment<br />
that occurs because of a takeover bid, except for provisions in the<br />
rules of the Company’s shares schemes which may result in options<br />
or awards granted to employees to vest on a takeover, except for<br />
Dale Butcher. Dale is entitled to receive an enhanced payment if his<br />
contract is terminated due to a change of control of 12 months’<br />
salary, a bonus payment based on the average of the prior three<br />
years’ bonus payments, a deferred 12 month pension annuity and<br />
a payment in lieu of use of his company car.<br />
Key contractual and other arrangements<br />
Other than arrangements with SAP and certain of its third party<br />
providers of finance, the Company’s contracts are at an operating<br />
level rather than at Group level. As a result no individual supplier or<br />
customer contract is significant to the business.<br />
Transactions with Directors<br />
No transaction, arrangement or agreement required to be<br />
disclosed under the Companies Act 2006 or IAS 24 ‘Related Parties’<br />
was outstanding at 31 December 2009, or was entered into during<br />
the year for any Director and/or connected person (2008 – none).<br />
<strong>Annual</strong> General Meeting<br />
The <strong>Annual</strong> General Meeting will be held at 11.00 a.m. on Thursday<br />
13 May 2010 at J.P Morgan Cazenove, 20 Moorgate, London, EC2R<br />
6DA . The notice convening the meeting and the resolutions to be<br />
put to the meeting, together with the explanatory notes, are set out<br />
in the Circular to all shareholders.<br />
The auditors, PricewaterhouseCoopers LLP, have indicated their<br />
willingness to continue in office. A resolution to reappoint them as<br />
auditors will be proposed at the <strong>Annual</strong> General Meeting.<br />
By order of the Board<br />
Claire Chapman<br />
General Counsel and Group Company Secretary<br />
<strong>Inchcape</strong> plc<br />
www.inchcape.com 77
Financial statements<br />
Consolidated income statement<br />
For the year ended 31 December 2009<br />
Notes<br />
Before<br />
exceptional<br />
items<br />
2009<br />
£m<br />
Exceptional<br />
items<br />
2009<br />
£m<br />
Total<br />
2009<br />
£m<br />
Before<br />
exceptional<br />
items<br />
2008<br />
£m<br />
Exceptional<br />
items<br />
2008<br />
£m<br />
Revenue 1, 3 5,583.7 – 5,583.7 6,259.8 – 6,259.8<br />
Cost of sales (4,757.0) – (4,757.0) (5,358.8) (1.8) (5,360.6)<br />
Gross profit 826.7 – 826.7 901.0 (1.8) 899.2<br />
Net operating expenses 3 (651.5) (18.4) (669.9) (660.5) (80.7) (741.2)<br />
Operating profit 175.2 (18.4) 156.8 240.5 (82.5) 158.0<br />
Share of profit after tax of joint ventures and associates 13 0.7 – 0.7 2.2 – 2.2<br />
Profit before finance and tax 175.9 (18.4) 157.5 242.7 (82.5) 160.2<br />
Finance income 6 52.1 – 52.1 68.4 – 68.4<br />
Finance costs 7 (72.9) – (72.9) (120.4) – (120.4)<br />
Profit before tax 155.1 (18.4) 136.7 190.7 (82.5) 108.2<br />
Tax 2, 8 (43.5) 1.8 (41.7) (49.3) (3.6) (52.9)<br />
Profit for the year 111.6 (16.6) 95.0 141.4 (86.1) 55.3<br />
Profit attributable to:<br />
– Equity holders of the parent 92.0 51.4<br />
– Minority interests 3.0 3.9<br />
95.0 55.3<br />
Basic earnings per share (pence)* 9 2.3p 1.9p<br />
Diluted earnings per share (pence)* 9 2.3p 1.9p<br />
* Earnings per share for 2008 have been restated to reflect the bonus element of the Rights Issue.<br />
Total<br />
2008<br />
£m<br />
78<br />
<strong>Inchcape</strong> plc ¦ <strong>Annual</strong> <strong>Report</strong> and Accounts 2009
Section<br />
Three<br />
Financial<br />
statements<br />
Consolidated statement of comprehensive income<br />
For the year ended 31 December 2009<br />
Profit for the year 95.0 55.3<br />
Other comprehensive income:<br />
Cash flow hedges (126.8) 111.6<br />
Net investment hedge 2.9 (14.4)<br />
Fair value gains / (losses) on available for sale financial assets 0.4 (1.1)<br />
Effect of foreign exchange rate changes (76.6) 205.4<br />
Actuarial losses on defined benefit pension schemes 5 (119.7) (41.3)<br />
Foreign exchange gains recycled through the consolidated income statement – (2.1)<br />
Deferred tax recognised directly in shareholders’ equity 16 60.6 (30.4)<br />
Other comprehensive income for the year, net of tax (259.2) 227.7<br />
Total comprehensive income for the year (164.2) 283.0<br />
Total comprehensive income attributable to:<br />
– Equity holders of the parent (165.8) 273.5<br />
– Minority interests 1.6 9.5<br />
Total comprehensive income for the year (164.2) 283.0<br />
Notes<br />
2009<br />
£m<br />
2008<br />
£m<br />
www.inchcape.com<br />
79
Financial statements<br />
Consolidated statement of financial position<br />
As at 31 December 2009<br />
Non-current assets<br />
Intangible assets 11 545.6 537.4<br />
Property, plant and equipment 12 656.6 708.1<br />
Investments in joint ventures and associates 13 22.3 21.3<br />
Available for sale financial assets 14 17.8 17.9<br />
Trade and other receivables 15 25.4 26.5<br />
Deferred tax assets 16 37.6 11.5<br />
Retirement benefit asset 5 0.8 49.4<br />
Notes<br />
2009<br />
£m<br />
2008<br />
£m<br />
1,306.1 1,372.1<br />
Current assets<br />
Inventories 17 772.7 1,084.1<br />
Trade and other receivables 15 252.9 271.8<br />
Available for sale financial assets 14 0.7 2.0<br />
Derivative financial instruments 23 91.0 306.9<br />
Current tax assets 5.1 6.0<br />
Cash and cash equivalents 18 381.3 458.0<br />
1,503.7 2,128.8<br />
Assets held for sale 19 6.6 5.4<br />
1,510.3 2,134.2<br />
Total assets 2,816.4 3,506.3<br />
Current liabilities<br />
Trade and other payables 20 (939.1) (1,123.9)<br />
Derivative financial instruments 23 (21.8) –<br />
Current tax liabilities (46.4) (48.2)<br />
Provisions 21 (46.7) (50.6)<br />
Borrowings 22 (166.0) (165.3)<br />
(1,220.0) (1,388.0)<br />
Non-current liabilities<br />
Trade and other payables 20 (68.8) (78.1)<br />
Provisions 21 (47.7) (52.0)<br />
Deferred tax liabilities 16 (15.4) (69.1)<br />
Borrowings 22 (299.2) (856.1)<br />
Retirement benefit liability 5 (75.6) (43.4)<br />
(506.7) (1,098.7)<br />
Total liabilities (1,726.7) (2,486.7)<br />
Net assets 1,089.7 1,019.6<br />
Shareholders’ equity<br />
Share capital 24 163.3 121.9<br />
Share premium 126.1 126.1<br />
Capital redemption reserve 16.4 16.4<br />
Other reserves 25 112.4 273.1<br />
Retained earnings 649.5 458.0<br />
Equity attributable to equity holders of the parent 1,067.7 995.5<br />
Minority interests 22.0 24.1<br />
Total shareholders’ equity 1,089.7 1,019.6<br />
The consolidated Financial statements on pages 78 to 135 were approved by the Board of Directors on 9 March 2010 and were signed<br />
on its behalf by:<br />
André Lacroix, Chief Executive Officer<br />
John McConnell, Group Finance Director<br />
80<br />
<strong>Inchcape</strong> plc ¦ <strong>Annual</strong> <strong>Report</strong> and Accounts 2009
Section<br />
Three<br />
Financial<br />
statements<br />
Consolidated statement of changes in equity<br />
For the year ended 31 December 2009<br />
Notes<br />
Share<br />
capital<br />
£m<br />
Share<br />
premium<br />
£m<br />
Capital<br />
redemption<br />
reserve<br />
£m<br />
Other<br />
reserves<br />
£m<br />
Retained<br />
earnings<br />
£m<br />
Equity<br />
attributable<br />
to equity<br />
holders of<br />
the parent<br />
£m<br />
Total<br />
Minority shareholders’<br />
interest equity<br />
£m<br />
£m<br />
At 1 January 2008 121.6 123.4 16.4 12.7 539.5 813.6 24.2 837.8<br />
Total comprehensive income for the year – – – 260.4 13.1 273.5 9.5 283.0<br />
Share-based payments, net of tax 4,16 – – – – (1.3) (1.3) – (1.3)<br />
Net purchase of own shares by<br />
ESOP Trust – – – – (4.2) (4.2) – (4.2)<br />
Share buy back programme 24 – – – – (16.0) (16.0) – (16.0)<br />
Dividends:<br />
– Owners of the parent – – – – (73.1) (73.1) – (73.1)<br />
– Minority interests – – – – – – (2.6) (2.6)<br />
Issue of ordinary share capital 24b 0.3 2.7 – – – 3.0 – 3.0<br />
Acquisition of businesses – – – – – – 0.6 0.6<br />
Acquisition of minority interest – – – – – – (7.6) (7.6)<br />
At 1 January 2009 121.9 126.1 16.4 273.1 458.0 995.5 24.1 1,019.6<br />
Total comprehensive income for the year – – – (160.7) (5.1) (165.8) 1.6 (164.2)<br />
Share-based payments, net of tax 4,16 – – – – 4.4 4.4 – 4.4<br />
Net purchase of own shares by<br />
ESOP Trust – – – – (0.7) (0.7) – (0.7)<br />
Dividends:<br />
– Minority interests – – – – – – (3.7) (3.7)<br />
Issue of ordinary share capital 24b, 24c 41.4 – – – 192.9 234.3 – 234.3<br />
At 31 December 2009 163.3 126.1 16.4 112.4 649.5 1,067.7 22.0 1,089.7<br />
Share-based payments have been stated net of a tax credit of £0.6m (2008 – charge of £0.4m).<br />
Cumulative goodwill of £108.1m (2008 – £108.1m) has been written off against the Retained earnings reserve. In addition, the Retained<br />
earnings reserve includes non-distributable reserves of £5.5m (2008 – £5.5m).<br />
www.inchcape.com<br />
81
Financial statements<br />
Consolidated statement of cash flows<br />
For the year ended 31 December 2009<br />
Cash flows from operating activities<br />
Cash generated from operations 26a 336.7 183.7<br />
Tax paid (58.5) (57.6)<br />
Interest received 7.2 20.0<br />
Interest paid (40.1) (74.0)<br />
Net cash generated from operating activities 245.3 72.1<br />
Cash flows from investing activities<br />
Acquisition of businesses, net of cash and overdrafts acquired (21.1) (135.4)<br />
Net cash inflow from sale of businesses 3.0 27.3<br />
Purchase of property, plant and equipment (50.1) (117.8)<br />
Purchase of intangible assets (14.6) (10.8)<br />
Proceeds from disposal of property, plant and equipment 15.8 26.8<br />
Net disposal of available for sale financial assets 0.1 0.4<br />
Dividends received from joint ventures and associates 0.6 1.3<br />
Net cash used in investing activities (66.3) (208.2)<br />
Cash flows from financing activities<br />
Proceeds from issue of ordinary shares 234.3 3.0<br />
Share buy back programme – (16.0)<br />
Net purchase of own shares by ESOP Trust (0.7) (4.2)<br />
Net cash (outflow) / inflow from borrowings (454.8) 275.2<br />
Payment of capital element of finance leases (3.7) (0.7)<br />
Loans granted to joint ventures (2.3) (1.7)<br />
Settlement of derivatives 10.1 17.5<br />
Equity dividends paid – (73.1)<br />
Minority dividends paid (3.7) (2.6)<br />
Net cash used in financing activities (220.8) 197.4<br />
Net (decrease) / increase in cash and cash equivalents 26b (41.8) 61.3<br />
Cash and cash equivalents at the beginning of the year 312.8 198.6<br />
Effect of foreign exchange rate changes (13.8) 52.9<br />
Cash and cash equivalents at the end of the year 257.2 312.8<br />
Cash and cash equivalents consist of:<br />
Cash at bank and in hand 18 319.6 351.3<br />
Short-term deposits 18 61.7 106.7<br />
Bank overdrafts 22 (124.1) (145.2)<br />
257.2 312.8<br />
Notes<br />
2009<br />
£m<br />
2008<br />
£m<br />
82<br />
<strong>Inchcape</strong> plc ¦ <strong>Annual</strong> <strong>Report</strong> and Accounts 2009
Section<br />
Three<br />
Financial<br />
statements<br />
Accounting policies<br />
The consolidated Financial statements have been prepared in accordance with International Financial <strong>Report</strong>ing Standards (IFRS) as<br />
adopted by the European Union, and International Financial <strong>Report</strong>ing Interpretation Committee (IFRIC) interpretations and with those<br />
parts of the Companies Act 2006 applicable to companies reporting under IFRS.<br />
Accounting convention<br />
The consolidated Financial statements have been prepared on a going concern basis and under the historical cost convention, except<br />
for the retention of certain freehold properties and leasehold buildings at previously revalued amounts (which were treated as deemed<br />
cost on transition to IFRS) and the measurement of certain balances at fair value as disclosed in the accounting policies below.<br />
Going concern<br />
After making enquiries, the Directors have a reasonable expectation that the Group has adequate resources to continue as a going<br />
concern for the foreseeable future.<br />
As such, the Group continues to adopt the going concern basis in preparing the annual report and accounts.<br />
Changes in accounting policy and disclosures<br />
A number of new standards, amendments and interpretations are effective for the first time for 2009. The Group has adopted, with effect<br />
from 1 January 2009, the amendments and revisions to standards noted below:<br />
The Group has adopted IFRS 8, ‘Operating segments’ which replaces IAS 14 ‘Segment reporting’. The new standard requires segmental<br />
reporting to be presented on the same basis as the internal management reporting. This has had no impact on the results or financial<br />
position of the Group. All comparatives have been restated according to the revised segmental disclosure. Further discussion on the<br />
changes can be seen in note 1, page 90.<br />
IAS 1 (Revised), ‘Presentation of financial statements’ has been adopted by the Group, which prohibits the presentation of non-owner<br />
items of income and expense in the consolidated statement of changes in equity. It has had no impact on the results or financial<br />
position of the Group.<br />
The Group has also adopted the amendment to IAS 16, ‘Property, plant and equipment’ on a prospective basis from 1 January 2009.<br />
Group policy states that where an asset is held for rental to others, for a period of longer than 12 months, it is held as property, plant<br />
and equipment and depreciated to residual value over the course of the lease. Upon expiry of the lease, when the asset is held for sale,<br />
it is transferred to inventory at net book value and upon sale of the asset, the subsequent revenue and the net book value are recorded<br />
on a gross basis, through revenue and cost of sales. The adoption of the amendment has not had a material impact on the results or<br />
position of the Group for the period ended 31 December 2009.<br />
Amendment to IFRS 7, ‘Financial instruments: Disclosures’ requires enhanced disclosures in respect of fair value measurements and<br />
liquidity risk. While adopting the amendment, the Group has elected not to provide comparative information for these expanded<br />
disclosures in the current year in accordance with the transitional reliefs offered in the amendment.<br />
The following standards and interpretations have also been adopted by the Group but have not had an impact on the results or<br />
financial position for the period ended 31 December 2009:<br />
– IFRIC 9, ‘Reassessment of embedded derivatives’<br />
– IFRIC 13, ‘Customer loyalty programmes’<br />
– IFRIC 15, ‘Agreements for the construction of real estate’<br />
– IFRIC 16, ‘Hedges of a net investment in a foreign operation’<br />
– IFRIC 17, ‘Distributions of non-cash assets to owners’<br />
– IFRIC 18, ‘Transfers of assets from customers’<br />
– IFRS 2, ‘Share-based payment – Vesting conditions and cancellations’<br />
– IAS 7, ‘Statement of cash flows: Presentation of a statement of cash flows’<br />
– IAS 32 (Amendment), ‘Financial instruments: Presentation’<br />
– IAS 39 (Amendment), ‘Financial instruments: Recognition and measurement’.<br />
At the end of the reporting period, the following revised standards were in issue but were not yet effective. These standards have not<br />
been early adopted by the Group, and will be applied for the Group’s financial years commencing on or after 1 January 2010:<br />
– IAS 27, (Revised) ‘Consolidated and separate financial statements’<br />
– IFRS 3, (Revised) ‘Business combinations’<br />
– IAS 28, ‘Investments in associates’<br />
– IAS 31, ‘Interest in joint ventures’<br />
– IAS 38, ‘Amendment to IAS 38 Intangible assets: Recognition and measurement’<br />
– IAS 17, ‘Amendment to IAS 17 Leases: Transitional provisions’<br />
– IFRS 9, ‘Financial instruments’<br />
– Amendment to IFRS 2, ‘Share-based payments group cash-settled transactions’.<br />
www.inchcape.com<br />
83
Financial statements<br />
Accounting policies continued<br />
Basis of consolidation<br />
The consolidated Financial statements comprise the Financial statements of the parent Company (<strong>Inchcape</strong> plc) and all of its subsidiary<br />
undertakings (defined as where the Group has control), together with the Group’s share of the results of its joint ventures (defined as<br />
where the Group has joint control) and associates (defined as where the Group has significant influence but not control). The results of<br />
subsidiaries, joint ventures and associates are consolidated as of the same reporting date as the parent Company, using consistent<br />
accounting policies.<br />
The results of subsidiaries are consolidated using the purchase method of accounting from the date on which control of the net assets<br />
and operations of the acquired company are effectively transferred to the Group. Similarly, the results of subsidiaries disposed of cease<br />
to be consolidated from the date on which control of the net assets and operations are transferred out of the Group.<br />
Where the Group acquires the minority interest in a subsidiary, the excess of the purchase cost over the book value of the minority<br />
interest is recorded as an addition to goodwill. No fair value exercise is performed for the acquisition of the minority interest.<br />
Where the Group acquires a controlling interest in a subsidiary with a contractual obligation to purchase the remaining minority, the<br />
acquired company is accounted for as a 100% subsidiary, with the liability for the purchase of the remaining minority recorded as<br />
deferred consideration. Subsequent changes to estimates of the deferred consideration are recorded as additions / reductions to<br />
the amount of goodwill arising on acquisition.<br />
Investments in joint ventures and associates are accounted for using the equity method, whereby the Group’s share of post-acquisition<br />
profits or losses are recognised in the consolidated income statement, and its share of post-acquisition movements in shareholders’<br />
equity are recognised in shareholders’ equity. If the Group’s share of losses in a joint venture or associate equals or exceeds its<br />
investment in the joint venture or associate, the Group does not recognise further losses, unless it has contractual obligations or made<br />
payments on behalf of the joint venture or associate.<br />
Foreign currency translation<br />
Transactions included in the results of each of the Group’s entities are measured using the currency of the primary economic<br />
environment in which the entity operates (the functional currency). The consolidated Financial statements are presented in Sterling,<br />
which is <strong>Inchcape</strong> plc’s functional and presentational currency.<br />
In the individual entities, transactions in foreign currencies are translated into the functional currency at the rates of exchange prevailing<br />
at the dates of the individual transactions. Monetary assets and liabilities denominated in foreign currencies are subsequently retranslated<br />
at the rate of exchange ruling at the end of the reporting period. All differences are taken to the consolidated income statement, except<br />
those arising on long-term foreign currency borrowings used to finance or hedge foreign currency investments which on consolidation are<br />
taken directly to shareholders’ equity.<br />
The assets and liabilities of foreign operations are translated into Sterling at the rate of exchange ruling at the end of the reporting period.<br />
The income statements of foreign operations are translated into Sterling at the average rates of exchange for the period. Exchange<br />
differences arising from 1 January 2004 are recognised as a separate component of shareholders’ equity. On disposal of a foreign<br />
operation, any cumulative exchange differences held in shareholders’ equity are transferred to the consolidated income statement.<br />
Revenue, other income and cost of sales<br />
Revenue from the sale of goods and services is measured at the fair value of consideration receivable, net of rebates and any discounts<br />
and includes lease rentals and finance and insurance commission. It excludes sales related taxes and intra-Group transactions.<br />
Revenue is recognised to the extent that it is probable that economic benefits will flow to the Group and the revenue can be reliably<br />
measured. In practice this means that revenue is recognised when vehicles or parts are invoiced and physically dispatched or when<br />
the service has been undertaken. Revenue from commission is recognised when receipt of payment can be assured.<br />
Where a vehicle is sold to a leasing company and a Group company retains a residual value commitment to buy back the vehicle for<br />
a specified value at a specified date, the sale is not recognised on the basis that the value of the asset will be realised over the lease period<br />
and from the disposal of the vehicle at the end of the lease period. These vehicles are retained within ‘property, plant and equipment’ on<br />
the consolidated statement of financial position at cost, and are depreciated to their residual value over the life of the lease. Total revenue<br />
on a leased vehicle comprises the difference between consideration received and residual value. This sits as deferred revenue on the<br />
consolidated statement of financial position and is released to the consolidated income statement on a straight line basis over the life of the<br />
lease. The residual value commitment, which reflects the price at which the vehicle will be bought back, is held within ‘trade and other<br />
payables’, according to the date of the commitment.<br />
Dividend income is recognised when the right to receive payment is established.<br />
Interest income is recognised when it is probable that the economic benefits will flow to the Group and the amount of revenue can be<br />
measured reliably. Interest revenue is accrued on a time basis, by reference to the principal outstanding and at the effective interest<br />
rate applicable.<br />
Cost of sales includes the expense relating to the estimated cost of self-insured warranties offered to customers. These warranties form<br />
part of the package of goods and services provided to the customer when purchasing a vehicle and are not a separable product.<br />
84<br />
<strong>Inchcape</strong> plc ¦ <strong>Annual</strong> <strong>Report</strong> and Accounts 2009
Section<br />
Three<br />
Financial<br />
statements<br />
Share-based payments<br />
The Group operates various share-based award schemes. The fair value at the date at which the share-based awards are granted is<br />
recognised in the consolidated income statement (together with a corresponding increase in shareholders’ equity) on a straight line<br />
basis over the vesting period, based on an estimate of the number of shares that will eventually vest. For equity-settled share-based<br />
awards, the services received from employees are measured by reference to the fair value of the awards granted. With the exception<br />
of the Group ‘Save as you earn’ scheme, the vesting of all share-based awards under all schemes is solely reliant upon non-market<br />
conditions therefore no expense is recognised for awards that do not ultimately vest. Where an employee cancels a ‘Save as you earn’<br />
award, the charge for that award is recognised as an expense immediately, even though the award does not vest.<br />
Finance costs<br />
Borrowing costs which are directly attributable to the acquisition, construction or production of a qualifying asset are capitalised as part<br />
of the cost of that asset from the first date on which the expenditure is incurred for the asset and until such time as the asset is ready for<br />
its intended use. A Group capitalisation rate is used to determine the magnitude of borrowing costs capitalised on each qualifying<br />
asset. This rate is the weighted average of Group borrowing costs, excluding those borrowings made specifically for the purpose of<br />
obtaining a qualifying asset.<br />
All other borrowing costs are recognised as an expense in the period in which they are incurred.<br />
Income tax<br />
The charge for current income tax is based on the results for the period as adjusted for items which are not taxed or disallowed. It is<br />
calculated using tax rates that have been enacted or substantively enacted by the end of the reporting period.<br />
Deferred income tax is accounted for using the liability method in respect of temporary differences arising from differences between<br />
the tax bases of assets and liabilities and their carrying amounts in the consolidated Financial statements.<br />
In principle, deferred tax liabilities are recognised for all taxable temporary differences and deferred tax assets are recognised to the<br />
extent that it is probable that taxable profits will be available against which deductible temporary differences can be utilised. Such<br />
assets and liabilities are not recognised if the temporary difference is due to goodwill arising on a business combination, or to an<br />
asset or liability, the initial recognition of which does not affect either taxable or accounting income.<br />
Deferred tax liabilities are recognised for taxable temporary differences arising on investments in subsidiaries, joint ventures and<br />
associates, except where the Group is able to control the reversal of the temporary difference and it is probable that the temporary<br />
difference will not reverse in the foreseeable future.<br />
Deferred tax is calculated at the tax rates that are expected to apply to the period when the asset is realised or the liability is settled<br />
using rates enacted at the end of the reporting period. Deferred tax is charged or credited in the consolidated income statement,<br />
except when it relates to items credited or charged directly to shareholders’ equity, in which case the deferred tax is also dealt with in<br />
shareholders’ equity.<br />
Deferred tax assets and liabilities are only offset where there is a legally enforceable right of offset and there is an intention to settle<br />
balances net.<br />
Exceptional items<br />
Items which are both material and non-recurring are presented as exceptional items within their relevant consolidated income<br />
statement category. The separate reporting of exceptional items helps provide additional useful information regarding the Group’s<br />
underlying business performance. Examples of events which may give rise to the classification of items as exceptional include gains<br />
or losses on the disposal of businesses, restructuring of businesses, litigation, asset impairments and exceptional tax related matters.<br />
Goodwill<br />
Goodwill represents the excess of the cost of acquisition of a business combination over the Group’s share of the fair value of identifiable<br />
net assets of the business acquired at the date of acquisition. Goodwill is initially recognised at cost and is held in the currency of the<br />
acquired entity and revalued at the closing exchange rate at the end of each reporting period.<br />
After initial recognition, goodwill is measured at cost less any accumulated impairment losses. At the date of acquisition, the goodwill is<br />
allocated to cash generating units for the purpose of impairment testing and is tested at least annually for impairment.<br />
Gains and losses on disposal of a business include the carrying amount of goodwill relating to the business sold in determining the gain<br />
or loss on disposal, except for goodwill arising on business combinations on or before 31 December 1997 which has been deducted<br />
from shareholders’ equity and remains indefinitely in shareholders’ equity.<br />
www.inchcape.com 85
Financial statements<br />
Accounting policies continued<br />
Other intangible assets<br />
Intangible assets, when acquired separately from a business (including computer software), are carried at cost less accumulated<br />
amortisation and impairment losses. Costs comprise purchase price from third parties as well as internally generated development<br />
costs where relevant. Amortisation is provided on a straight line basis to allocate the cost of the asset over its estimated useful life, which<br />
in the case of computer software is three to seven years. Amortisation is recognised in the consolidated income statement within ‘net<br />
operating expenses’.<br />
Intangible assets acquired as part of a business combination (including back orders and customer contracts) are capitalised separately<br />
from goodwill if the fair value can be measured reliably on initial recognition. These intangible assets are amortised over their estimated<br />
useful life, which is generally less than a year.<br />
Property, plant and equipment<br />
Property, plant and equipment is stated at cost less accumulated depreciation and impairment losses. Cost comprises the purchase<br />
price and directly attributable costs of the asset and includes, where relevant, capitalised borrowing costs. Depreciation is based on<br />
cost less estimated residual value and is provided, except for freehold land which is not depreciated, on a straight line basis over the<br />
estimated useful life of the asset. For the following categories, the annual rates used are:<br />
Freehold buildings and long leasehold buildings 2.0%<br />
Short leasehold buildings<br />
shorter of lease term or useful life<br />
Plant, machinery and equipment 5.0% – 33.3%<br />
Interest in leased vehicles<br />
over the lease term<br />
The residual values and useful lives of all assets are reviewed at least at the end of each reporting period.<br />
Impairment<br />
Assets that are subject to amortisation or depreciation are reviewed for impairment whenever events or circumstances indicate that the<br />
carrying amount may not be recoverable.<br />
In addition, goodwill is not subject to amortisation but is tested at least annually for impairment. An impairment loss is recognised for the<br />
amount by which the asset’s carrying amount exceeds its recoverable amount, the latter being the higher of the asset’s fair value less<br />
costs to sell and value in use. Value in use calculations are performed using cash flow projections, discounted at a pre-tax rate which<br />
reflects the asset specific risks and the time value of money.<br />
A provision for impairment of trade receivables is established when there is objective evidence that the Group will not be able to collect<br />
all amounts due according to the original terms of the receivables. The carrying amount of the asset is reduced through the use of an<br />
allowance account, and the amount of the loss is recognised in the consolidated income statement within ‘net operating expenses’.<br />
When a trade receivable is uncollectible, it is written off against the allowance account for trade receivables. Subsequent recoveries of<br />
amounts previously written off are credited against ‘net operating expenses’ in the consolidated income statement.<br />
Inventories<br />
Inventories are stated at the lower of cost and net realisable value. Cost comprises expenditure incurred in bringing inventories to their<br />
present location and condition. Net realisable value represents the estimated selling price less all estimated costs of completion and<br />
costs to be incurred in marketing, selling and distribution. Used vehicles are carried at the lower of cost or fair value less costs to sell,<br />
generally based on external market data available for used vehicles.<br />
Vehicles held on consignment which are deemed in substance to be assets of the Group are included within ‘inventories’ with the<br />
corresponding liability included within ‘trade and other payables’.<br />
Inventory can be held on deferred payment terms. All costs associated with this deferral are expensed in the period in which they<br />
are incurred.<br />
Pensions and other post-retirement benefits<br />
The Group operates a number of retirement benefit schemes.<br />
The major schemes are defined benefit pension funds with assets held separately from the Group. The cost of providing benefits under<br />
the plans is determined separately for each plan using the projected unit credit actuarial valuation method.<br />
The current service cost and gains and losses on settlements and curtailments are included in ‘cost of sales’ or ‘net operating expenses’<br />
in the consolidated income statement. Past service costs are similarly included where the benefits have vested otherwise they are<br />
amortised on a straight line basis over the vesting period. The expected return on assets of funded defined benefit pension plans and<br />
the imputed interest on pension plan liabilities comprise the post-retirement benefit element of finance costs and finance income in the<br />
consolidated income statement.<br />
Differences between the actual and expected return on assets, changes in the retirement benefit obligation due to experience and<br />
changes in actuarial assumptions are included in the consolidated statement of comprehensive income in full in the period in which<br />
they arise.<br />
The Group’s contributions to defined contribution plans are charged to the consolidated income statement in the period to which the<br />
contributions relate.<br />
86<br />
<strong>Inchcape</strong> plc ¦ <strong>Annual</strong> <strong>Report</strong> and Accounts 2009
Section<br />
Three<br />
Financial<br />
statements<br />
The Group also has a liability in respect of past employees under post-retirement healthcare schemes which have been closed to new<br />
entrants. These schemes are accounted for on a similar basis to that for defined benefit pension plans in accordance with the advice<br />
of independent qualified actuaries.<br />
Provisions<br />
Provisions are recognised when the Group has a present obligation in respect of a past event, when it is more likely than not that an<br />
outflow of resources will be required to settle the obligation and where the amount can be reliably estimated. Provisions are discounted<br />
when the time value of money is considered to be material, using an appropriate risk free rate on government bonds.<br />
Disposal group and assets held for sale<br />
Where the Group is actively marketing a business and disposal is expected within one year of the end of the reporting period, the assets<br />
and liabilities of the associated businesses are separately disclosed on the consolidated statement of financial position as a disposal<br />
group. Assets are classified as assets held for sale if their carrying amount is to be recovered principally through a sale transaction rather<br />
than through continuing use. Both disposal groups and assets held for sale are stated at the lower of their carrying amount and fair<br />
value less costs to sell.<br />
Segmental reporting<br />
Segment information is reported in accordance with IFRS 8 ‘Operating segments’, which requires segmental reporting to be presented on<br />
the same basis as the internal management reporting. The Group has identified operating segments, corresponding to the six main regions<br />
in which it operates. These segments are then categorised into the Group’s two distinctive market channels, distribution and retail.<br />
Financial instruments<br />
The Group classifies its financial instruments in the following categories: loans and receivables; held at fair value; amortised cost; and<br />
available for sale. The classification is determined at initial recognition and depends on the purpose for which the financial instruments<br />
are required.<br />
Loans and receivables are non-derivative financial assets with fixed or determinable payments that are not quoted in an active market.<br />
They are included in current assets, except where the maturity date is more than 12 months after the end of the reporting period. They<br />
are initially recorded at fair value and subsequently recorded at net realisable value.<br />
Held at fair value includes derivative financial assets and liabilities, which are further explained below. They are classified according to<br />
maturity date, within current and non-current assets and liabilities respectively.<br />
Amortised cost includes non-derivative financial assets and liabilities which are held at original cost, less amortisation or provision raised.<br />
Available for sale financial assets are the residual category and include non-derivative financial assets, such as bonds and equity<br />
investments. They are classified as non-current assets unless management intends to dispose of them within 12 months of the end of<br />
the reporting period and are held at fair value.<br />
Cash and cash equivalents<br />
Cash and cash equivalents in the consolidated statement of financial position comprise cash at bank and in hand, short-term bank<br />
deposits and money market funds.<br />
In the consolidated statement of cash flows, cash and cash equivalents comprise cash and cash equivalents, as defined above, net<br />
of bank overdrafts.<br />
Leases<br />
Finance leases, which transfer to the Group substantially all the risks and rewards of ownership of the leased item, are capitalised at<br />
the inception of the lease at the fair value of the leased asset or, if lower, at the present value of the minimum lease payments. Lease<br />
payments are apportioned between the finance charges and reduction of the lease liability so as to achieve a constant rate of interest<br />
on the remaining balance of the liability. Finance charges are charged to the consolidated income statement. Capitalised leased<br />
assets are depreciated over the shorter of the estimated useful life of the asset or the lease term.<br />
Leases where the Group does not retain substantially all the risks and rewards of ownership of the asset are classified as operating<br />
leases. Operating lease rental payments are recognised as an expense in the consolidated income statement on a straight line basis<br />
over the lease term.<br />
Offsetting<br />
Netting in the consolidated statement of financial position only occurs to the extent that there is the legal ability and intention to settle<br />
net. As such, bank overdrafts are presented in current liabilities to the extent that there is no intention to offset with the cash balance.<br />
www.inchcape.com 87
Financial statements<br />
Accounting policies continued<br />
Derivative financial instruments<br />
An outline of the objectives, policies and strategies pursued by the Group in relation to its financial instruments is set out in the Principal<br />
risks section of the Financial review.<br />
Derivatives are initially recognised at fair value on the date a derivative contract is entered into and are subsequently re-measured at<br />
their fair value. The method of recognising the resulting gain or loss depends on whether the derivative is designated as a hedging<br />
instrument, and if so, the nature of the item being hedged. The Group designates certain derivatives as:<br />
• hedges of the fair value of recognised assets or liabilities or a firm commitment (fair value hedge); or<br />
• hedges of a particular risk associated with a recognised asset or liability or a highly probable forecast transaction (cash flow hedge); or<br />
• hedges of a net investment in a foreign operation (net investment hedge).<br />
Fair value hedge<br />
Changes in the fair value of derivatives that are designated and qualify as fair value hedges are recorded in the consolidated income<br />
statement, together with any changes in the fair value of the hedged asset or liability that are attributable to the hedged risk. The Group<br />
only applies fair value hedge accounting for hedging fixed interest risk on borrowings and future fixed amount currency liabilities (on its<br />
cross currency interest rate swaps). The gain or loss relating to the effective portion of interest rate swaps hedging fixed rate borrowings<br />
and changes in the fair value of those borrowings are recognised in the consolidated income statement within ‘finance costs’. The gain<br />
or loss relating to the ineffective portion is also recognised in the consolidated income statement within ‘finance costs’.<br />
Cash flow hedge<br />
For cash flow hedges that meet the conditions for hedge accounting, the portion of the gains or losses on the hedging instrument that<br />
are determined to be an effective hedge are recognised directly in shareholders’ equity and the ineffective portion is recognised in the<br />
consolidated income statement. When the hedged forecast transaction results in the recognition of a non-financial asset or liability then,<br />
at the time the asset or liability is recognised, the associated gains or losses that had previously been recognised in shareholders’ equity are<br />
included in the initial measurement of the acquisition cost or other carrying amount of the asset or liability. For all other cash flow hedges,<br />
the gains or losses that are recognised in shareholders’ equity are transferred to the consolidated income statement in the same period in<br />
which the hedged forecast transaction affects the consolidated income statement.<br />
Net investment hedge<br />
The Group uses borrowings denominated in foreign currency to hedge net investments in foreign operations. These are accounted<br />
for similarly to cash flow hedges. Any gain or loss on the hedging instrument relating to the effective portion of the hedge is recognised<br />
in equity; the gain or loss relating to any ineffective portion is recognised immediately in the consolidated income statement in ‘net<br />
operating expenses’. Gains and losses accumulated in equity are included in the consolidated income statement when the foreign<br />
operation is disposed of.<br />
Hedge accounting is discontinued when the hedging instrument expires, is sold, terminated, exercised or no longer qualifies for hedge<br />
accounting. At that point in time any cumulative gains or losses on the hedging instrument which have been recognised in shareholders’<br />
equity are kept in shareholders’ equity until the forecast transaction occurs. If a hedged transaction is no longer expected to occur, the<br />
cumulative gains or losses that have been recognised in shareholders’ equity are transferred to the consolidated income statement for<br />
the period.<br />
For derivatives that do not qualify for hedge accounting, any gains or losses arising from changes in fair value are taken directly to the<br />
consolidated income statement.<br />
Investments<br />
The Group’s investments are classified as available for sale or held to maturity (where management has a positive intention and ability<br />
to hold the asset to maturity).<br />
Gains and losses on available for sale financial assets are recognised in shareholders’ equity, until the investment is sold or is considered<br />
to be impaired, at which time the cumulative gain or loss previously reported in shareholders’ equity is included in the consolidated<br />
income statement as part of ‘net operating expenses’.<br />
Held to maturity financial assets are carried at amortised cost.<br />
Share capital<br />
Ordinary shares are classified as equity. Where the Group purchases the Group’s equity share capital (treasury shares), the consideration<br />
paid is deducted from shareholders’ equity until the shares are cancelled, reissued or disposed of. Where such shares are subsequently<br />
sold or reissued, any consideration received is included in shareholders’ equity.<br />
Dividends<br />
Final dividends proposed by the Board of Directors and unpaid at the year end are not recognised in the consolidated Financial<br />
statements until they have been approved by the shareholders at the <strong>Annual</strong> General Meeting. Interim dividends are recognised<br />
when they are paid.<br />
88<br />
<strong>Inchcape</strong> plc ¦ <strong>Annual</strong> <strong>Report</strong> and Accounts 2009
Section<br />
Three<br />
Financial<br />
statements<br />
Significant accounting judgements and estimates<br />
Judgements<br />
In the process of applying the Group’s accounting policies, the Directors have made the following judgements which have the most<br />
significant effect on the amounts recognised in the consolidated Financial statements.<br />
Revenue recognition on vehicles subject to residual value commitments<br />
Where the Group sells vehicles sourced from within the Group to a finance provider for the purpose of leasing the vehicles to a third<br />
party, and retains a residual value commitment, the sale is not recognised on the basis that the value of these assets will be realised<br />
over the lease period and from the disposal of the vehicles at the end of the lease period.<br />
Consignment stock<br />
Vehicles held on consignment have been included in ‘finished goods’ within ‘inventories’ on the basis that the Group has determined<br />
that it holds the significant risks and rewards attached to these vehicles.<br />
Estimates<br />
The key assumptions concerning the future and other sources of estimation uncertainty at the end of the reporting period, that have<br />
a significant risk of causing material adjustment to the carrying amounts of assets and liabilities within the next financial year are<br />
discussed below:<br />
Product warranty provision<br />
The product warranty provision requires an estimation of the number of expected warranty claims, and the expected cost of labour<br />
and parts necessary to satisfy these warranty claims.<br />
Pensions and other post-retirement benefits<br />
The net retirement benefit asset or liability is calculated based on a number of actuarial assumptions as detailed in note 5. A number of<br />
these assumptions involve a considerable degree of estimation, including the rate of inflation, discount rate and expected mortality rates.<br />
Tax<br />
The Group is subject to income taxes in a number of jurisdictions. Some degree of estimation is required in determining the worldwide<br />
provision for income taxes. There are a number of transactions and calculations for which the ultimate tax determination is uncertain<br />
during the ordinary course of business. The Group recognises liabilities for anticipated tax audit issues based on estimates of whether<br />
additional taxes will be due. Where the final tax outcome of these matters is different from the amounts that were initially recorded, such<br />
differences will impact the current tax and deferred tax provisions in the period in which such determination is made.<br />
In addition, the recognition of deferred tax assets is dependent upon an estimation of future taxable profits that will be available against<br />
which deductible temporary differences can be utilised. In the event that actual taxable profits are different, such differences may<br />
impact the carrying value of such deferred tax assets in future periods.<br />
Goodwill<br />
Goodwill is tested at least annually for impairment in accordance with the accounting policy set out above. The recoverable amount of<br />
cash generating units is determined based on value in use calculations. These calculations require the use of estimates including projected<br />
future cash flows (see note 11).<br />
Property, plant and equipment<br />
Property, plant and equipment is reviewed for impairment if events or circumstances indicate that the carrying value may not be<br />
recoverable. When an impairment review is carried out, the recoverable value is determined based on value in use calculations which<br />
require estimates to be made of future cash flows.<br />
Residual value commitments<br />
The Group has residual value commitments on certain leased vehicles. These commitments are an estimate of future market value at<br />
a specified point in time. The actual market value of vehicles bought back may vary from the committed purchase value.<br />
www.inchcape.com 89
Financial statements<br />
Notes to the accounts<br />
1 Segmental analysis<br />
From 1 January 2009, the Group has adopted IFRS 8 ‘Operating segments’. IFRS 8 replaced IAS 14 ‘Segment reporting’.<br />
IFRS 8 requires operating segments to be identified on the basis of internal reports about components of the Group that are regularly<br />
reviewed by the chief operating decision maker in order to assess their performance and to allocate resources to the segments.<br />
These operating segments are then aggregated into reporting segments to combine those with similar characteristics. In contrast,<br />
the predecessor standard required the Group to identify two sets of segments (business and geographical), using a risks and<br />
rewards approach.<br />
The Group has determined that the chief operating decision maker is the Executive Committee.<br />
Under IFRS 8, the only change for the Group is that the businesses previously reported within the Rest of World segment under IAS 14 are<br />
reported within the other segments that best match the characteristics of each individual business. Comparative information has been<br />
restated accordingly.<br />
Emerging markets are those countries in which the Group operates that have started to grow but have yet to reach a mature stage<br />
of development and accordingly were in, and are expected to return to, the growth phase of the development cycle. These currently<br />
comprise China, the Balkans, the Baltics, Poland, South America and Africa.<br />
The Group’s reported segments are based on the location of the Group’s assets. Revenue earned from sales is disclosed by origin and<br />
is not materially different from revenue by destination.<br />
Transfer prices between segments are set on an arm’s length basis.<br />
Distribution comprises Vertically Integrated Retail businesses as well as Financial Services and other businesses.<br />
2009<br />
Australasia<br />
£m<br />
Europe<br />
£m<br />
North Asia<br />
£m<br />
South Asia<br />
£m<br />
United<br />
Kingdom<br />
£m<br />
Russia and<br />
Emerging<br />
Markets<br />
£m<br />
Distribution<br />
Total<br />
Distribution<br />
£m<br />
Revenue<br />
Total revenue 607.4 947.8 312.2 548.2 30.0 300.1 2,745.7<br />
Inter-segment revenue (129.0) (146.0) – – – (43.7) (318.7)<br />
Revenue from third parties 478.4 801.8 312.2 548.2 30.0 256.4 2,427.0<br />
Results<br />
Segment result 26.7 30.2 19.9 55.9 3.9 1.0 137.6<br />
Exceptional items – (0.2) – – – (3.9) (4.1)<br />
Operating profit after exceptional items 26.7 30.0 19.9 55.9 3.9 (2.9) 133.5<br />
Share of profit / (loss) after tax of joint ventures<br />
and associates – 2.0 – – – – 2.0<br />
Profit before finance and tax 26.7 32.0 19.9 55.9 3.9 (2.9) 135.5<br />
Finance income<br />
Finance costs<br />
Profit before tax<br />
Tax<br />
Profit for the year<br />
90<br />
<strong>Inchcape</strong> plc ¦ <strong>Annual</strong> <strong>Report</strong> and Accounts 2009
Section<br />
Three<br />
Financial<br />
statements<br />
2009<br />
Australasia<br />
£m<br />
Europe<br />
£m<br />
United<br />
Kingdom<br />
£m<br />
Russia and<br />
Emerging<br />
Markets<br />
£m<br />
Retail<br />
Total<br />
Retail<br />
£m<br />
Total pre<br />
Central<br />
£m<br />
Revenue<br />
Total revenue 284.4 204.3 2,055.7 612.3 3,156.7 5,902.4 – 5,902.4<br />
Inter-segment revenue – – – – – (318.7) – (318.7)<br />
Revenue from third parties 284.4 204.3 2,055.7 612.3 3,156.7 5,583.7 – 5,583.7<br />
Results<br />
Segment result 11.2 (1.6) 42.8 4.0 56.4 194.0 (18.8) 175.2<br />
Exceptional items – (1.6) (3.0) (8.2) (12.8) (16.9) (1.5) (18.4)<br />
Operating profit after exceptional items 11.2 (3.2) 39.8 (4.2) 43.6 177.1 (20.3) 156.8<br />
Share of profit / (loss) after tax of joint ventures<br />
and associates – – – (1.3) (1.3) 0.7 – 0.7<br />
Profit before finance and tax 11.2 (3.2) 39.8 (5.5) 42.3 177.8 (20.3) 157.5<br />
Finance income 52.1<br />
Finance costs (72.9)<br />
Profit before tax 136.7<br />
Tax (41.7)<br />
Profit for the year 95.0<br />
Central<br />
£m<br />
Total<br />
£m<br />
www.inchcape.com 91
Financial statements<br />
Notes to the accounts continued<br />
1 Segmental analysis continued<br />
2009<br />
Australasia<br />
£m<br />
Europe<br />
£m<br />
North Asia<br />
£m<br />
South Asia<br />
£m<br />
United<br />
Kingdom<br />
£m<br />
Russia and<br />
Emerging<br />
Markets<br />
£m<br />
Distribution<br />
Total<br />
Distribution<br />
£m<br />
Segment assets and liabilities<br />
Segment assets 84.2 188.9 64.7 59.2 21.8 66.3 485.1<br />
Other current assets<br />
Non-current assets<br />
Segment liabilities (173.4) (242.2) (52.6) (43.1) (60.2) (40.4) (611.9)<br />
Other liabilities<br />
Net assets<br />
Segment assets include net inventory, trade receivables and derivative assets. Segment liabilities include payables, provisions and<br />
derivative liabilities.<br />
2009<br />
Australasia<br />
£m<br />
Europe<br />
£m<br />
North Asia<br />
£m<br />
South Asia<br />
£m<br />
United<br />
Kingdom<br />
£m<br />
Russia and<br />
Emerging<br />
Markets<br />
£m<br />
Distribution<br />
Total<br />
Distribution<br />
£m<br />
Other segment items<br />
Capital expenditure:<br />
– Property, plant and equipment 0.9 0.2 0.5 1.6 0.1 3.3 6.6<br />
– Interest in leased vehicles – 14.3 2.3 – 17.6 4.2 38.4<br />
– Intangible assets – 0.3 – – 0.2 0.1 0.6<br />
Depreciation:<br />
– Property, plant and equipment 3.0 1.4 1.6 1.9 0.1 2.4 10.4<br />
– Interest in leased vehicles – 5.6 1.8 – 13.0 4.0 24.4<br />
Amortisation of intangible assets 0.2 0.5 – – 0.3 0.2 1.2<br />
Impairment of property, plant and equipment – – – – – 6.7 6.7<br />
Net provisions charged / (released) to the<br />
consolidated income statement 10.3 18.7 0.5 5.3 (1.3) 4.0 37.5<br />
Net provisions include inventory, trade receivables impairment and other liability provisions.<br />
92<br />
<strong>Inchcape</strong> plc ¦ <strong>Annual</strong> <strong>Report</strong> and Accounts 2009
Section<br />
Three<br />
Financial<br />
statements<br />
1 Segmental analysis continued<br />
2009<br />
Australasia<br />
£m<br />
Europe<br />
£m<br />
United<br />
Kingdom<br />
£m<br />
Russia and<br />
Emerging<br />
Markets<br />
£m<br />
Segment assets and liabilities<br />
Segment assets 32.4 28.5 346.9 151.4 559.2 1,044.3<br />
Other current assets 481.6<br />
Non-current assets 1,280.7<br />
Segment liabilities (29.4) (19.0) (311.2) (86.0) (445.6) (1,057.5)<br />
Other liabilities (659.4)<br />
Net assets 1,089.7<br />
Segment assets include net inventory, trade receivables and derivative assets. Segment liabilities include payables, provisions and<br />
derivative liabilities.<br />
2009<br />
Australasia<br />
£m<br />
Europe<br />
£m<br />
United<br />
Kingdom<br />
£m<br />
Russia and<br />
Emerging<br />
Markets<br />
£m<br />
Retail<br />
Total<br />
Retail<br />
£m<br />
Total pre<br />
Central<br />
£m<br />
Other segment items<br />
Capital expenditure:<br />
– Property, plant and equipment 0.3 0.4 5.3 37.3 43.3 49.9 – 49.9<br />
– Interest in leased vehicles – 0.3 – – 0.3 38.7 – 38.7<br />
– Intangible assets – – 1.1 0.9 2.0 2.6 7.4 10.0<br />
Depreciation:<br />
– Property, plant and equipment 0.6 1.5 10.0 5.6 17.7 28.1 0.5 28.6<br />
– Interest in leased vehicles – 0.3 – – 0.3 24.7 – 24.7<br />
Amortisation of intangible assets – – 1.2 0.2 1.4 2.6 0.2 2.8<br />
Impairment of property, plant and equipment – – – 7.8 7.8 14.5 – 14.5<br />
Net provisions charged / (released) to the<br />
consolidated income statement 2.4 (0.5) 4.9 4.1 10.9 48.4 (1.3) 47.1<br />
Net provisions include inventory, trade receivables impairment and other liability provisions.<br />
Retail<br />
Total<br />
Retail<br />
£m<br />
Central<br />
£m<br />
Total<br />
£m<br />
Total<br />
£m<br />
www.inchcape.com 93
Financial statements<br />
Notes to the accounts continued<br />
1 Segmental analysis continued<br />
2008<br />
Australasia<br />
£m<br />
Europe<br />
£m<br />
North Asia<br />
£m<br />
South Asia<br />
£m<br />
United<br />
Kingdom<br />
£m<br />
Russia and<br />
Emerging<br />
Markets<br />
£m<br />
Distribution<br />
Total<br />
Distribution<br />
£m<br />
Revenue<br />
Total revenue 599.4 1,014.5 378.5 536.0 20.7 502.5 3,051.6<br />
Inter-segment revenue (143.3) (176.6) – – – (77.0) (396.9)<br />
Revenue from third parties 456.1 837.9 378.5 536.0 20.7 425.5 2,654.7<br />
Results<br />
Segment result 33.3 39.9 38.7 63.0 (5.7) 23.7 192.9<br />
Exceptional items (1.3) (4.0) (0.1) – – (47.8) (53.2)<br />
Operating profit after exceptional items 32.0 35.9 38.6 63.0 (5.7) (24.1) 139.7<br />
Share of profit / (loss) after tax of joint ventures<br />
and associates – 2.1 – – 0.2 – 2.3<br />
Profit before finance and tax 32.0 38.0 38.6 63.0 (5.5) (24.1) 142.0<br />
Finance income<br />
Finance costs<br />
Profit before tax<br />
Tax<br />
Profit for the year<br />
94<br />
<strong>Inchcape</strong> plc ¦ <strong>Annual</strong> <strong>Report</strong> and Accounts 2009
Section<br />
Three<br />
Financial<br />
statements<br />
1 Segmental analysis continued<br />
2008<br />
Australasia<br />
£m<br />
Europe<br />
£m<br />
United<br />
Kingdom<br />
£m<br />
Russia and<br />
Emerging<br />
Markets<br />
£m<br />
Retail<br />
Total<br />
Retail<br />
£m<br />
Total pre<br />
Central<br />
£m<br />
Revenue<br />
Total revenue 263.2 391.3 2,319.4 631.2 3,605.1 6,656.7 – 6,656.7<br />
Inter-segment revenue – – – – – (396.9) – (396.9)<br />
Revenue from third parties 263.2 391.3 2,319.4 631.2 3,605.1 6,259.8 – 6,259.8<br />
Results<br />
Segment result 8.9 0.7 28.8 18.8 57.2 250.1 (9.6) 240.5<br />
Exceptional items – (3.0) (23.1) (1.8) (27.9) (81.1) (1.4) (82.5)<br />
Operating profit after exceptional items 8.9 (2.3) 5.7 17.0 29.3 169.0 (11.0) 158.0<br />
Share of profit / (loss) after tax of joint ventures<br />
and associates – – 0.3 (0.4) (0.1) 2.2 – 2.2<br />
Profit before finance and tax 8.9 (2.3) 6.0 16.6 29.2 171.2 (11.0) 160.2<br />
Finance income 68.4<br />
Finance costs (120.4)<br />
Profit before tax 108.2<br />
Tax (52.9)<br />
Profit for the year 55.3<br />
Central<br />
£m<br />
Total<br />
£m<br />
www.inchcape.com 95
Financial statements<br />
Notes to the accounts continued<br />
1 Segmental analysis continued<br />
2008<br />
Australasia<br />
£m<br />
Europe<br />
£m<br />
North Asia<br />
£m<br />
South Asia<br />
£m<br />
United<br />
Kingdom<br />
£m<br />
Russia and<br />
Emerging<br />
Markets<br />
£m<br />
Distribution<br />
Total<br />
Distribution<br />
£m<br />
Segment assets and liabilities<br />
Segment assets 242.0 242.8 80.1 86.3 31.9 177.8 860.9<br />
Other current assets<br />
Non-current assets<br />
Segment liabilities (197.0) (255.3) (34.9) (53.4) (84.9) (81.7) (707.2)<br />
Other liabilities<br />
Net assets<br />
Segment assets include net inventory, trade receivables and derivative assets. Segment liabilities include payables, provisions and<br />
derivative liabilities.<br />
2008<br />
Australasia<br />
£m<br />
Europe<br />
£m<br />
North Asia<br />
£m<br />
South Asia<br />
£m<br />
United<br />
Kingdom<br />
£m<br />
Russia and<br />
Emerging<br />
Markets<br />
£m<br />
Distribution<br />
Total<br />
Distribution<br />
£m<br />
Other segment items<br />
Capital expenditure:<br />
– Property, plant and equipment 1.9 0.7 5.2 2.5 0.9 10.1 21.3<br />
– Interest in leased vehicles – 13.7 – – 38.8 10.1 62.6<br />
– Intangible assets 0.2 0.3 – – 0.4 0.2 1.1<br />
Depreciation:<br />
– Property, plant and equipment 2.2 1.4 3.0 1.7 1.3 3.3 12.9<br />
– Interest in leased vehicles 0.6 4.8 – – 10.7 3.3 19.4<br />
Amortisation of intangible assets 0.2 0.5 – 0.1 0.2 0.3 1.3<br />
Impairment of goodwill – – – – – 46.8 46.8<br />
Net provisions charged / (released) to the<br />
consolidated income statement 5.2 17.2 2.1 3.7 9.2 6.0 43.4<br />
Net provisions include inventory, trade receivables impairment and other liability provisions.<br />
96<br />
<strong>Inchcape</strong> plc ¦ <strong>Annual</strong> <strong>Report</strong> and Accounts 2009
Section<br />
Three<br />
Financial<br />
statements<br />
1 Segmental analysis continued<br />
2008<br />
Australasia<br />
£m<br />
Europe<br />
£m<br />
United<br />
Kingdom<br />
£m<br />
Russia and<br />
Emerging<br />
Markets<br />
£m<br />
Retail<br />
Total Retail<br />
£m<br />
Segment assets and liabilities<br />
Segment assets 43.4 45.5 429.0 145.6 663.5 1,524.4<br />
Other current assets 636.3<br />
Non-current assets 1,345.6<br />
Segment liabilities (35.9) (20.0) (411.1) (72.0) (539.0) (1,246.2)<br />
Other liabilities (1,240.5)<br />
Net assets 1,019.6<br />
Segment assets include net inventory, trade receivables and derivative assets. Segment liabilities include payables, provisions and<br />
derivative liabilities.<br />
2008<br />
Australasia<br />
£m<br />
Europe<br />
£m<br />
United<br />
Kingdom<br />
£m<br />
Russia and<br />
Emerging<br />
Markets<br />
£m<br />
Retail<br />
Total<br />
Retail<br />
£m<br />
Total pre<br />
Central<br />
£m<br />
Other segment items<br />
Capital expenditure:<br />
– Property, plant and equipment 0.5 3.7 36.9 50.4 91.5 112.8 5.0 117.8<br />
– Interest in leased vehicles – 0.9 – – 0.9 63.5 – 63.5<br />
– Intangible assets – – 0.5 0.1 0.6 1.7 18.3 20.0<br />
Depreciation:<br />
– Property, plant and equipment 0.6 2.0 16.0 2.1 20.7 33.6 2.5 36.1<br />
– Interest in leased vehicles – 0.2 – – 0.2 19.6 – 19.6<br />
Amortisation of intangible assets – 0.1 0.9 1.1 2.1 3.4 0.3 3.7<br />
Impairment of goodwill – – 7.4 – 7.4 54.2 – 54.2<br />
Net provisions charged / (released) to the<br />
consolidated income statement 1.1 1.7 15.0 5.1 22.9 66.3 1.1 67.4<br />
Net provisions include inventory, trade receivables impairment and other liability provisions.<br />
Central<br />
£m<br />
Total<br />
£m<br />
Total<br />
£m<br />
www.inchcape.com 97
Financial statements<br />
Notes to the accounts continued<br />
2 Exceptional items<br />
Impairment of property, plant and equipment (10.3) –<br />
Restructuring costs (5.1) (28.3)<br />
Vacant property (3.0) –<br />
Goodwill impairment (note 11) – (54.2)<br />
Operating exceptional items (18.4) (82.5)<br />
Exceptional tax credit / (charge) 1.8 (3.6)<br />
Total exceptional items (16.6) (86.1)<br />
The impairment charge for property, plant and equipment of £10.3m arises from an impairment review of the Group’s business in Latvia<br />
which was updated following a further deterioration in trading conditions.<br />
The restructuring costs of £5.1m represent the costs of headcount reduction and site closures in Finland, the Baltics and Russia, together<br />
with changes in the composition of the Executive Committee.<br />
The charge for restructuring costs in 2008 related to the cost of restructuring the Group’s businesses in response to the downturn in the<br />
automotive industry and primarily represents the costs of reducing employee headcount and closing less profitable sites.<br />
The vacant property cost of £3.0m represents an onerous lease provision relating to a site occupied by the <strong>Inchcape</strong> Automotive<br />
business that was sold in 2007 and which went into administration in early 2009. The Group remains responsible for the head lease on<br />
this property.<br />
The goodwill impairment charge in 2008 was in respect of the business in Latvia and certain sites in the United Kingdom which have been<br />
sold or closed.<br />
The 2009 exceptional tax credit represents a deferred tax credit of £0.9m in respect of the future deduction for overseas redundancy<br />
costs in the local territories and a current tax credit of £0.9m in respect of onerous lease costs on UK properties.<br />
2009<br />
£m<br />
2008<br />
£m<br />
98<br />
<strong>Inchcape</strong> plc ¦ <strong>Annual</strong> <strong>Report</strong> and Accounts 2009
Section<br />
Three<br />
Financial<br />
statements<br />
3 Revenue and expenses<br />
a. Revenue<br />
An analysis of the Group’s revenue for the year is as follows:<br />
Sale of goods 4,964.6 5,680.9<br />
Provision of services 619.1 578.9<br />
5,583.7 6,259.8<br />
2009<br />
£m<br />
2008<br />
£m<br />
b. Analysis of net operating expenses<br />
Net operating<br />
expenses<br />
before<br />
exceptional<br />
items<br />
2009<br />
£m<br />
Exceptional<br />
items<br />
2009<br />
£m<br />
Net<br />
operating<br />
expenses<br />
2009<br />
£m<br />
Net operating<br />
expenses<br />
before<br />
exceptional<br />
items<br />
2008<br />
£m<br />
Exceptional<br />
items<br />
2008<br />
£m<br />
Net<br />
operating<br />
expenses<br />
2008<br />
£m<br />
Distribution costs 352.4 0.2 352.6 380.9 5.5 386.4<br />
Administrative expenses 303.1 7.6 310.7 280.6 13.8 294.4<br />
Other operating (income) / expense (4.0) 10.6 6.6 (1.0) 61.4 60.4<br />
651.5 18.4 669.9 660.5 80.7 741.2<br />
Other operating (income) / expense includes a charge of £14.5m in respect of property impairment (2008 – £54.2m related to goodwill<br />
impairment).<br />
c. Profit before tax is stated after the following charges / (credits):<br />
Depreciation of property, plant and equipment:<br />
– Owned assets 28.1 35.9<br />
– Assets held under finance leases 0.5 0.2<br />
– Interest in leased vehicles 24.7 19.6<br />
Amortisation of intangible assets 2.8 3.7<br />
Impairment of goodwill – 54.2<br />
Impairment of property, plant and equipment 14.5 –<br />
Bad debt provision 3.8 2.3<br />
Profit on sale of property, plant and equipment (2.6) (2.6)<br />
Operating lease rentals 45.0 41.7<br />
2009<br />
£m<br />
2008<br />
£m<br />
www.inchcape.com 99
Financial statements<br />
Notes to the accounts continued<br />
3 Revenue and expenses continued<br />
d. Auditors’ remuneration<br />
During the year the Group (including its overseas subsidiaries) obtained the following services from the Group’s auditor at costs as<br />
detailed below:<br />
Audit services:<br />
– Fees payable for the audit of the parent Company and the consolidated Financial statements 0.4 0.4<br />
Fees payable to the Company’s auditor and its associates for other services:<br />
– The audit of the Company’s subsidiaries pursuant to legislation 1.7 1.7<br />
– Other services supplied pursuant to such legislation 0.9 0.1<br />
– Services relating to taxation 1.4 1.5<br />
– All other services – 0.1<br />
4.0 3.4<br />
Total fees payable to PricewaterhouseCoopers LLP 4.4 3.8<br />
Audit fees – firms other than PricewaterhouseCoopers LLP 0.1 0.1<br />
The fees for other services supplied pursuant to legislation include £0.8m related to the Rights Issue. These costs have been recognised<br />
in equity as part of the net proceeds of the Rights Issue.<br />
e. Staff costs<br />
Wages and salaries 356.5 353.4<br />
Social security costs 43.0 39.6<br />
Other pension costs 11.2 12.3<br />
Share-based payment charge / (credit) 3.8 (0.9)<br />
414.5 404.4<br />
Information on Directors’ emoluments and interests which forms part of these audited consolidated Financial statements, is given in the<br />
Board report on remuneration which can be found on pages 68 – 74 of this document.<br />
f. Average number of employees<br />
2009<br />
Number<br />
2009<br />
£m<br />
2009<br />
£m<br />
2008<br />
£m<br />
2008<br />
£m<br />
Distribution Retail Total<br />
2008<br />
Number<br />
2009<br />
Number<br />
2008<br />
Number<br />
2009<br />
Number<br />
2008<br />
Number<br />
Australasia 557 594 595 574 1,152 1,168<br />
Europe 350 430 474 591 824 1,021<br />
North Asia 1,381 1,378 – – 1,381 1,378<br />
South Asia 1,003 1,022 – – 1,003 1,022<br />
United Kingdom 159 166 4,955 6,090 5,114 6,256<br />
Russia and Emerging Markets 1,387 1,414 2,660 3,055 4,047 4,469<br />
Total operational 4,837 5,004 8,684 10,310 13,521 15,314<br />
Central 156 162<br />
13,677 15,476<br />
100<br />
<strong>Inchcape</strong> plc ¦ <strong>Annual</strong> <strong>Report</strong> and Accounts 2009
Section<br />
Three<br />
Financial<br />
statements<br />
4 Share-based payments<br />
The terms and conditions of the Group’s share-based payment plans are detailed in the Board report on remuneration.<br />
The charge arising from share-based payment transactions during the year is £3.8m (2008 – credit of £0.9m), all of which<br />
is equity-settled.<br />
The Other Share Plans disclosures below include other share-based incentive plans for senior executives and employees.<br />
The following table sets out the movements in the number of share options and awards during the year:<br />
Weighted average exercise price* Executive Share Option Plan Save As You Earn Plan Other Share Plans<br />
2009 2008 2009 2008 2009 2008 2009 2008<br />
Outstanding at 1 Jan £3.97 £4.04 11,820,309 8,627,181 2,424,699 2,244,154 1,550,122 964,976<br />
Granted – £3.50 – 4,256,371 – 2,409,067 – 947,752<br />
Exercised – £2.83 – (740,925) – (309,778) (507) (346,301)<br />
Lapsed £4.17 £3.44 (2,888,972) (322,318) (575,934) (1,918,744) (260,306) (16,305)<br />
Outstanding at 6 April £3.90 8,931,337 1,848,765 1,289,309<br />
Outstanding following<br />
Rights Issue £0.67 52,982,611 10,990,010 12,893,090<br />
Granted £0.21 86,337,398 32,295,387 2,445,747<br />
Exercised £0.58 (154,368) – (1,181,178)<br />
Lapsed £0.58 (9,706,442) (7,569,130) (1,568,961)<br />
Outstanding at 31 Dec £0.35 £3.97 129,459,199 11,820,309 35,716,267 2,424,699 12,588,698 1,550,122<br />
Exercisable at 31 Dec £0.50 14,660,414 479,911 19,200<br />
* The weighted average exercise price excludes awards made under the Deferred Bonus Plan as there is no exercise price attached to these share awards.<br />
Included in the table above are 943,008 (2008 – 1,097,371 restated for Rights Issue) share options outstanding at 31 December<br />
granted before 7 November 2002 which have been excluded from the share-based payments charge in accordance with the IFRS 2<br />
transitional provisions.<br />
The weighted average remaining contractual life for the share options outstanding at 31 December 2009 is 6.9 years (2008 – 6.4 years).<br />
The range of exercise prices for options outstanding at the end of the year was £0.08 to £0.97 (2008 – £0.08 to £0.97 restated for Rights<br />
Issue). See note 24 for further details.<br />
The fair value of equity-settled share options granted is estimated as at the date of grant using a binomial model, taking into account<br />
the terms and conditions upon which the options were granted. The following table lists the main inputs to the model for shares granted<br />
during the years ended 31 December 2009 and 31 December 2008:<br />
Executive Share Option Plan Save As You Earn Plan Other Share Plans<br />
2009 2008 2009 2008 2009 2008<br />
Weighted average share price at grant date £0.20 £4.12 £0.29 £2.99 £0.25 £4.10<br />
Weighted average exercise price * £0.20 £0.69 £0.23 £0.40 n/a n/a<br />
Vesting period 3.0 years 3.0 years 3.0 years 3.0 years 3.0 years 3.0 years<br />
Expected volatility 80.0% 25.8% 80.0% 31.7% n/a n/a<br />
Expected life of option 3.5 years 4.0 years 3.2 years 3.2 years 3.0 years 3.0 years<br />
Weighted average risk free rate 2.1% 4.0% 1.9% 4.3% n/a 4.0%<br />
Expected dividend yield 1.0% 3.0% 1.0% 3.0% n/a 3.0%<br />
Weighted average fair value per option £0.11 £0.82 £0.13 £0.61 £0.25 £4.30<br />
* The weighted average exercise prices for 2008 have been restated for Rights Issue.<br />
The expected life and volatility of the options are based upon historical data.<br />
www.inchcape.com 101
Financial statements<br />
Notes to the accounts continued<br />
5 Pensions and other post-retirements benefits<br />
The Group operates a number of pension and post-retirement benefit schemes for its employees in a number of its subsidiaries.<br />
The principal schemes are held in the UK and are final salary defined benefit pension schemes. Most of the schemes have assets held<br />
in trust in separately administered funds although there are some minor unfunded arrangements relating to post-retirement health and<br />
medical plans in respect of past employees. There are no material defined contribution schemes in the UK.<br />
The majority of the overseas defined benefit schemes are final salary schemes which provide a lump sum on retirement, some of which<br />
have assets held in trust in separately administered funds and others which are unfunded. The overseas defined contribution schemes<br />
are principally linked to local statutory arrangements.<br />
a. UK schemes<br />
The UK has four main defined benefit schemes, namely the <strong>Inchcape</strong> Group (UK) Pension Scheme, the <strong>Inchcape</strong> Motors Pension<br />
Scheme, the <strong>Inchcape</strong> Overseas Pension Scheme and the TKM Group Pension Scheme. These schemes are considered below:<br />
Open schemes<br />
<strong>Inchcape</strong> Group (UK) Pension Scheme<br />
The latest triennial actuarial valuation for this scheme was carried out as at 31 March 2009 on a market related basis and determined in<br />
accordance with the advice of independent professionally qualified actuaries based on the projected unit method. The majority of the<br />
scheme’s liabilities are for pensioners and deferred pensioners, and the investment strategy is to hold a broadly balanced portfolio of<br />
equities and gilts.<br />
<strong>Inchcape</strong> Motors Pension Scheme<br />
The latest triennial actuarial valuation for this scheme was carried out as at 5 April 2009 on a market related basis and determined in<br />
accordance with the advice of independent professionally qualified actuaries based on the projected unit method. Whilst a majority<br />
of the scheme’s members are pensioners and deferred pensioners, a sizeable portion of the membership is still accruing benefits and<br />
the investment strategy reflects this with the majority of the assets invested in equities and bonds.<br />
<strong>Inchcape</strong> Overseas Pension Scheme<br />
This scheme is managed from Guernsey and is therefore reported in the United Kingdom segment in this note. The latest triennial<br />
actuarial valuation for this scheme was carried out as at 31 March 2009 and determined in accordance with the advice of independent<br />
professionally qualified actuaries based on the projected unit method. A significant majority of the scheme’s members are pensioners<br />
and deferred pensioners and therefore the majority of the assets are invested in bonds.<br />
Closed scheme<br />
TKM Group Pension Scheme<br />
The latest triennial actuarial valuation for this closed scheme was carried out at 5 April 2007 on a market related basis and determined<br />
in accordance with the advice of independent professionally qualified actuaries based on the projected unit method. The scheme has<br />
a prudent investment strategy and the majority of the assets are invested in bonds, cash or gilts. Approximately half the members are<br />
pensioners and half are deferred pensioners and as such no further pension accrual arises.<br />
b. Overseas schemes<br />
There are a number of smaller defined benefit schemes overseas, the most significant being the <strong>Inchcape</strong> Motors Limited Retirement<br />
Scheme in Hong Kong. In general these schemes offer a lump sum on retirement with no further obligation to the employee. These<br />
schemes are typically subject to triennial valuations.<br />
c. Defined contribution plans<br />
The total expense recognised in the consolidated income statement is £5.4m (2008 – £5.5m). There are no outstanding contributions<br />
to defined contribution schemes at the year end (2008 – £nil).<br />
d. Defined benefit plans<br />
As the Group’s principal defined benefit schemes are in the UK, these have been reported separately to the overseas schemes. For the<br />
purposes of reporting, actuarial updates have been obtained for the Group’s material schemes and these updates are reflected in the<br />
amounts reported below.<br />
The principal weighted average assumptions used by the actuaries were:<br />
United Kingdom<br />
Overseas<br />
Rate of increase in salaries 5.2 4.7 4.5 4.6<br />
Rate of increase in pensions 3.7 2.8 – –<br />
Discount rate 5.7 6.2 3.1 1.9<br />
Inflation 3.7 2.8 0.5 0.5<br />
Expected return on plan assets 6.1 6.1 7.0 7.1<br />
2009<br />
%<br />
2008<br />
%<br />
2009<br />
%<br />
2008<br />
%<br />
102<br />
<strong>Inchcape</strong> plc ¦ <strong>Annual</strong> <strong>Report</strong> and Accounts 2009
Section<br />
Three<br />
Financial<br />
statements<br />
5 Pensions and other post-retirements benefits continued<br />
The rate of increase in healthcare cost is 5.5% (2008 – 5.5%) per annum but with higher increases in the first 10 years.<br />
Assumptions regarding future mortality experience are set based on published statistics and experience. For the UK schemes, the<br />
average life expectancy of a pensioner retiring at age 65 is 22.6 years (2008 – 20.9 years) for current pensioners and 25.0 years<br />
(2008 – 22.5 years) for current non pensioners. Most of the overseas schemes only offer a lump sum on retirement and therefore<br />
mortality assumptions are not applicable.<br />
The expected return on plan assets is based on the weighted average expected return on each type of asset (principally equities<br />
and bonds). The overall expected return on plan assets is determined based on the expected real rates of return on equities and<br />
expected yields on bonds applicable to the period over which the obligation is to be settled.<br />
The asset / (liability) recognised in the consolidated statement of financial position is determined as follows:<br />
2009<br />
£m<br />
United Kingdom Overseas Total<br />
Present value of funded obligations (807.4) (628.6) (33.4) (43.9) (840.8) (672.5)<br />
Fair value of plan assets 736.1 697.7 34.7 29.6 770.8 727.3<br />
(Deficit) / surplus in funded obligations (71.3) 69.1 1.3 (14.3) (70.0) 54.8<br />
Irrecoverable element of pension surplus – (43.6) (0.3) (0.3) (0.3) (43.9)<br />
Net (deficit) / surplus in funded obligations (71.3) 25.5 1.0 (14.6) (70.3) 10.9<br />
Present value of unfunded obligations (2.3) (2.7) (2.2) (2.2) (4.5) (4.9)<br />
(73.6) 22.8 (1.2) (16.8) (74.8) 6.0<br />
2008<br />
£m<br />
2009<br />
£m<br />
2008<br />
£m<br />
2009<br />
£m<br />
2008<br />
£m<br />
The net pension asset / (liability) is analysed as follows:<br />
Schemes in surplus – 49.4 0.8 – 0.8 49.4<br />
Schemes in deficit (73.6) (26.6) (2.0) (16.8) (75.6) (43.4)<br />
(73.6) 22.8 (1.2) (16.8) (74.8) 6.0<br />
The amounts recognised in the consolidated income statement are as follows:<br />
2009<br />
£m<br />
United Kingdom Overseas Total<br />
Current service cost (3.0) (4.8) (2.6) (2.0) (5.6) (6.8)<br />
Past service cost (0.2) – – – (0.2) –<br />
Interest expense on plan liabilities (38.0) (42.0) (0.9) (1.1) (38.9) (43.1)<br />
Expected return on plan assets 42.6 47.1 1.9 2.3 44.5 49.4<br />
1.4 0.3 (1.6) (0.8) (0.2) (0.5)<br />
The actual gain on plan assets amounts to £48.8m (2008 – actual loss of £67.6m).<br />
The totals in the previous table are analysed as follows:<br />
2009<br />
£m<br />
2008<br />
£m<br />
Cost of sales Distribution costs Administrative expenses Total<br />
2008<br />
£m<br />
2009<br />
£m<br />
Current service cost (0.6) (0.4) (1.2) (0.9) (3.8) (5.5) (5.6) (6.8)<br />
Past service cost – – – – (0.2) – (0.2) –<br />
(0.6) (0.4) (1.2) (0.9) (4.0) (5.5) (5.8) (6.8)<br />
Interest expense on<br />
plan liabilities (38.9) (43.1)<br />
Expected return on plan assets 44.5 49.4<br />
(0.2) (0.5)<br />
2008<br />
£m<br />
2009<br />
£m<br />
2009<br />
£m<br />
2008<br />
£m<br />
2008<br />
£m<br />
2009<br />
£m<br />
2009<br />
£m<br />
2008<br />
£m<br />
2008<br />
£m<br />
www.inchcape.com 103
Financial statements<br />
Notes to the accounts continued<br />
5 Pensions and other post-retirements benefits continued<br />
The amounts recognised in the consolidated statement of comprehensive income are as follows:<br />
2009<br />
£m<br />
United Kingdom Overseas Total<br />
Actuarial gains / (losses) on liabilities:<br />
– Experience gains and losses 4.6 16.0 0.6 0.7 5.2 16.7<br />
– Changes in assumptions (178.9) 106.9 6.1 (4.3) (172.8) 102.6<br />
Actuarial gains / (losses) on assets:<br />
– Experience gains and losses (1.8) (104.1) 6.1 (12.9) 4.3 (117.0)<br />
Irrecoverable element of pension surplus 43.6 (43.6) – – 43.6 (43.6)<br />
(132.5) (24.8) 12.8 (16.5) (119.7) (41.3)<br />
Analysis of the movement in the net asset / (liability):<br />
2009<br />
£m<br />
2008<br />
£m<br />
2009<br />
£m<br />
2008<br />
£m<br />
2009<br />
£m<br />
2008<br />
£m<br />
United Kingdom Overseas Total<br />
At 1 January 22.8 26.5 (16.8) 2.0 6.0 28.5<br />
Amount recognised in the consolidated income statement 1.4 0.3 (1.6) (0.8) (0.2) (0.5)<br />
Contributions by employer 34.7 20.8 3.0 2.1 37.7 22.9<br />
Actuarial gains / (losses) recognised in the year (132.5) (24.8) 12.8 (16.5) (119.7) (41.3)<br />
Effect of foreign exchange rates – – 1.4 (3.6) 1.4 (3.6)<br />
At 31 December (73.6) 22.8 (1.2) (16.8) (74.8) 6.0<br />
Changes in the present value of the defined benefit obligation are as follows:<br />
2009<br />
£m<br />
2008<br />
£m<br />
2009<br />
£m<br />
2008<br />
£m<br />
2009<br />
£m<br />
2008<br />
£m<br />
United Kingdom Overseas Total<br />
At 1 January (631.3) (741.0) (46.1) (29.5) (677.4) (770.5)<br />
Current service cost (3.0) (4.8) (2.6) (2.0) (5.6) (6.8)<br />
Past service cost (0.2) – – – (0.2) –<br />
Interest expense on plan liabilities (38.0) (42.0) (0.9) (1.1) (38.9) (43.1)<br />
Actuarial gains / (losses):<br />
– Experience gains and losses 4.6 16.0 0.6 0.7 5.2 16.7<br />
– Changes in assumptions (178.9) 106.9 6.1 (4.3) (172.8) 102.6<br />
Contributions by employees (1.3) (1.6) (0.1) (0.1) (1.4) (1.7)<br />
Benefits paid 38.4 35.2 3.5 1.9 41.9 37.1<br />
Effect of foreign exchange rate changes – – 3.9 (11.7) 3.9 (11.7)<br />
At 31 December (809.7) (631.3) (35.6) (46.1) (845.3) (677.4)<br />
2008<br />
£m<br />
2009<br />
£m<br />
2008<br />
£m<br />
2009<br />
£m<br />
2008<br />
£m<br />
104<br />
<strong>Inchcape</strong> plc ¦ <strong>Annual</strong> <strong>Report</strong> and Accounts 2009
Section<br />
Three<br />
Financial<br />
statements<br />
5 Pensions and other post-retirements benefits continued<br />
Changes in the fair value of the defined benefit asset are as follows:<br />
2009<br />
£m<br />
United Kingdom Overseas Total<br />
At 1 January 697.7 767.5 29.6 31.8 727.3 799.3<br />
Expected return on plan assets 42.6 47.1 1.9 2.3 44.5 49.4<br />
Actuarial gains / (losses):<br />
– Experience gains and losses (1.8) (104.1) 6.1 (12.9) 4.3 (117.0)<br />
Contributions by employer 34.7 20.8 3.0 2.1 37.7 22.9<br />
Contributions by employees 1.3 1.6 0.1 0.1 1.4 1.7<br />
Benefits paid (38.4) (35.2) (3.5) (1.9) (41.9) (37.1)<br />
Effect of foreign exchange rate changes – – (2.5) 8.1 (2.5) 8.1<br />
At 31 December 736.1 697.7 34.7 29.6 770.8 727.3<br />
Irrecoverable element of pension surplus – (43.6) (0.3) (0.3) (0.3) (43.9)<br />
Revised value at 31 December 736.1 654.1 34.4 29.3 770.5 683.4<br />
At the end of the reporting period, the percentage of the plan assets by category had been invested as follows:<br />
United Kingdom Overseas Total<br />
2009 2008 2009 2008 2009 2008<br />
Equities 33.7% 30.3% 71.8% 65.1% 35.5% 31.8%<br />
Corporate bonds 35.2% 35.6% 19.5% 24.8% 34.5% 35.2%<br />
Government bonds 23.7% 33.5% – – 22.6% 32.1%<br />
Other 7.4% 0.6% 8.7% 10.1% 7.4% 0.9%<br />
100.0% 100.0% 100.0% 100.0% 100.0% 100.0%<br />
The history of the plans for the current and previous years is as follows:<br />
2008<br />
£m<br />
2009<br />
£m<br />
2008<br />
£m<br />
2009<br />
£m<br />
2008<br />
£m<br />
Present value of defined benefit obligation (845.3) (677.4) (770.5) (755.8) (748.6)<br />
Fair value of plan assets 770.8 727.3 799.3 733.3 679.5<br />
(Deficit) / surplus (74.5) 49.9 28.8 (22.5) (69.1)<br />
Irrecoverable element of pension surplus (0.3) (43.9) (0.3) (0.2) (0.3)<br />
Revised (deficit) / surplus (74.8) 6.0 28.5 (22.7) (69.4)<br />
Experience adjustments on plan liabilities 5.2 16.7 0.1 8.6 0.4<br />
Experience adjustments on plan assets 4.3 (117.0) 1.3 3.8 46.1<br />
The cumulative actuarial gains and losses arising since 1 January 2004 recognised in shareholders’ equity amounted to a £148.9m loss at<br />
31 December 2009 (2008 – £29.2m loss).<br />
The Group has agreed to pay approximately £23m to its defined benefit plans in 2010.<br />
2009<br />
£m<br />
2008<br />
£m<br />
2007<br />
£m<br />
2006<br />
£m<br />
2005<br />
£m<br />
www.inchcape.com 105
Financial statements<br />
Notes to the accounts continued<br />
6 Finance income<br />
Bank and other interest receivable 4.2 16.9<br />
Expected return on post-retirement plan assets 44.5 49.4<br />
Other finance income 3.4 2.1<br />
Total finance income 52.1 68.4<br />
7 Finance costs<br />
Interest payable on bank borrowings 5.1 11.7<br />
Interest payable on other borrowings 1.7 3.2<br />
Interest payable on revolving credit facility 1.6 11.3<br />
Interest payable on Private Placement 7.8 18.2<br />
Fair value loss / (gain) on cross currency interest rate swaps 70.8 (147.6)<br />
Fair value adjustment on Private Placement (71.7) 144.8<br />
Stock holding interest 9.2 21.5<br />
Interest expense on post-retirement plan liabilities 38.9 43.1<br />
Other finance costs 10.6 17.1<br />
Capitalised borrowing costs (1.1) (2.9)<br />
Total finance costs 72.9 120.4<br />
The Group capitalisation rate used for general borrowing costs in accordance with IAS 23 was a weighted average rate for the year<br />
of 2.9% (2008 – 6.6%).<br />
2009<br />
£m<br />
2009<br />
£m<br />
2008<br />
£m<br />
2008<br />
£m<br />
106<br />
<strong>Inchcape</strong> plc ¦ <strong>Annual</strong> <strong>Report</strong> and Accounts 2009
Section<br />
Three<br />
Financial<br />
statements<br />
8 Tax<br />
Current tax:<br />
– UK corporation tax 8.0 8.0<br />
– Double tax relief (2.2) (11.6)<br />
5.8 (3.6)<br />
Overseas tax 47.5 56.8<br />
53.3 53.2<br />
Adjustments to prior year liabilities:<br />
– UK 8.0 1.0<br />
– Overseas – (1.0)<br />
Current tax 61.3 53.2<br />
Deferred tax (note 16) (17.8) (3.9)<br />
Tax before exceptional tax 43.5 49.3<br />
Exceptional tax – current tax (0.9) (2.4)<br />
Exceptional tax – deferred tax (0.9) 6.0<br />
Exceptional tax (note 2) (1.8) 3.6<br />
Total tax charge 41.7 52.9<br />
The effective tax rate for the year, before exceptional items, of 28.0% (2008 – 25.9%) is higher than the standard rate of tax of 24.8%<br />
(2008 – 20.4%) as explained below. The standard rate comprises the average statutory rates across the Group, weighted in proportion<br />
to accounting profits.<br />
Profit before tax 136.7 108.2<br />
Profit before tax multiplied by the standard rate of tax of 24.8% (2008 – 20.4%) 33.9 22.1<br />
Effects of:<br />
– Exceptional profit on disposal (0.2) –<br />
– Amortisation and impairment 3.2 10.5<br />
– Non-tax deductible items 12.9 5.9<br />
– Unrelieved losses 4.4 9.3<br />
– Prior year items (12.3) (4.4)<br />
– Tax arising on acquisition of non-qualifying tangible fixed assets (0.1) 3.7<br />
– Tax arising on phase out of industrial buildings allowances – 6.0<br />
– Tax impact of share of profit after tax of joint ventures and associates (0.3) (0.3)<br />
– Other items 0.2 0.1<br />
Total tax charge 41.7 52.9<br />
Prior year items include a reduction in UK deferred tax liabilities on properties that are non-qualifying for industrial building purposes,<br />
which were acquired under the Initial Recognition Exemption. A re-assessment of liabilities has led to a reduction of £7.9m. The<br />
remainder of the credits relate to a variety of items in various countries.<br />
The subsidiaries effective tax rate, defined as tax on profit before exceptional items and excluding the Group’s share of profit after tax<br />
of joint ventures and associates, for the year is 28.2% (2008 – 26.0%).<br />
2009<br />
£m<br />
2009<br />
£m<br />
2008<br />
£m<br />
2008<br />
£m<br />
www.inchcape.com 107
Financial statements<br />
Notes to the accounts continued<br />
9 Earnings per share<br />
2009<br />
£m<br />
Restated<br />
2008<br />
£m<br />
Profit for the year 95.0 55.3<br />
Minority interests (3.0) (3.9)<br />
Basic earnings 92.0 51.4<br />
Exceptional items 16.6 86.1<br />
Adjusted earnings 108.6 137.5<br />
Basic earnings per share 2.3p 1.9p<br />
Diluted earnings per share 2.3p 1.9p<br />
Basic Adjusted earnings per share 2.7p 5.0p<br />
Diluted Adjusted earnings per share 2.7p 5.0p<br />
Earnings per share have been restated to reflect the bonus element of the Rights Issue.<br />
2009<br />
number<br />
Restated<br />
2008<br />
number<br />
Weighted average number of fully paid ordinary shares in issue during the year 4,050,851,856 486,854,223<br />
Weighted average number of fully paid ordinary shares in issue during the year:<br />
– Held by the ESOP Trust (13,711,221) (1,257,218)<br />
– Repurchased as part of the share buy back programme (26,875,606) (26,602,853)<br />
– Bonus element of the Rights Issue – 2,263,852,512<br />
Weighted average number of fully paid ordinary shares for the purposes of basic EPS 4,010,265,029 2,722,846,664<br />
Dilutive effect of potential ordinary shares 4,266,376 1,720,575<br />
Adjusted weighted average number of fully paid ordinary shares in issue during the<br />
year for the purposes of diluted EPS 4,014,531,405 2,724,567,239<br />
Basic earnings per share is calculated by dividing the basic earnings for the year by the weighted average number of fully paid ordinary<br />
shares in issue during the year, less those shares held by the ESOP Trust and those repurchased as part of the share buy back programme.<br />
Diluted earnings per share is calculated on the same basis as the basic earnings per share with a further adjustment to the weighted<br />
average number of fully paid ordinary shares to reflect the effect of all dilutive potential ordinary shares. Dilutive potential ordinary shares<br />
comprise share options, deferred bonus plan and other share-based awards.<br />
Adjusted earnings (which excludes exceptional items) is adopted to assist the reader in understanding the underlying performance of<br />
the Group. Adjusted earnings per share is calculated by dividing the Adjusted earnings for the year by the weighted average number<br />
of fully paid ordinary shares in issue during the year, less those shares held by the ESOP Trust and those repurchased as part of the share<br />
buy back programme.<br />
Diluted Adjusted earnings per share is calculated on the same basis as the basic Adjusted earnings per share with a further adjustment<br />
to the weighted average number of fully paid ordinary shares to reflect the effect of all dilutive potential ordinary shares. Dilutive<br />
potential ordinary shares comprise share options, deferred bonus plan and other share-based awards.<br />
108<br />
<strong>Inchcape</strong> plc ¦ <strong>Annual</strong> <strong>Report</strong> and Accounts 2009
Section<br />
Three<br />
Financial<br />
statements<br />
10 Dividends<br />
The following dividends were paid by the Group:<br />
Interim dividend for the six months ended 30 June 2009 (2008 – 5.46p per share) – 25.0<br />
Final dividend for the year ended 31 December 2008 (2007 – 10.5p per share) – 48.1<br />
– 73.1<br />
There is no proposal to pay a final dividend for the year ending 31 December 2009.<br />
Dividends paid in 2008 exclude £4.6m payable on treasury shares and shares held by the ESOP Trust.<br />
11 Intangible assets<br />
Goodwill<br />
£m<br />
Computer<br />
software<br />
£m<br />
2009<br />
£m<br />
Other<br />
intangible<br />
assets<br />
£m<br />
Cost<br />
At 1 January 2008 390.9 31.4 6.5 428.8<br />
Businesses acquired – – 1.0 1.0<br />
Additions 142.0 20.0 – 162.0<br />
Disposals (5.4) (1.0) (0.3) (6.7)<br />
Reclassified from disposal group 5.9 – – 5.9<br />
Effect of foreign exchange rate changes 41.1 5.3 (0.1) 46.3<br />
At 1 January 2009 574.5 55.7 7.1 637.3<br />
Businesses sold (0.2) (0.1) – (0.3)<br />
Additions 22.3 10.0 – 32.3<br />
Disposals – (0.2) – (0.2)<br />
Effect of foreign exchange rate changes (25.4) (1.3) (0.1) (26.8)<br />
At 31 December 2009 571.2 64.1 7.0 642.3<br />
2008<br />
£m<br />
Total<br />
£m<br />
Amortisation and impairment<br />
At 1 January 2008 (1.3) (20.7) (6.3) (28.3)<br />
Amortisation charge for the year – (2.7) (1.0) (3.7)<br />
Impairment charge for the year (54.2) – – (54.2)<br />
Disposals 0.2 1.0 0.4 1.6<br />
Effect of foreign exchange rate changes (10.3) (4.8) (0.2) (15.3)<br />
At 1 January 2009 (65.6) (27.2) (7.1) (99.9)<br />
Businesses sold – 0.1 – 0.1<br />
Amortisation charge for the year – (2.8) – (2.8)<br />
Disposals – 0.2 – 0.2<br />
Effect of foreign exchange rate changes 4.4 1.2 0.1 5.7<br />
At 31 December 2009 (61.2) (28.5) (7.0) (96.7)<br />
Net book value at 31 December 2009 510.0 35.6 – 545.6<br />
Net book value at 31 December 2008 508.9 28.5 – 537.4<br />
As at 31 December 2009, capitalised borrowing costs of £1.1m (2008 – £0.9m) were included within ‘other intangible assets’, £0.2m of<br />
which was capitalised in 2009 (2008 – £0.9m).<br />
www.inchcape.com 109
Financial statements<br />
Notes to the accounts continued<br />
11 Intangible assets continued<br />
a. Goodwill<br />
Goodwill acquired in a business combination is allocated to the cash generating units (CGUs) that are expected to benefit from that<br />
business combination. These are independent sources of income streams and represent the lowest level within the Group at which<br />
the associated goodwill is monitored for management purposes. This may be at country, regional or brand level.<br />
The carrying amount of goodwill has been allocated to the following operating segments:<br />
United Kingdom 264.6 264.8<br />
Russia and Emerging Markets 216.5 214.8<br />
South Asia 17.9 19.6<br />
Australasia 11.0 9.7<br />
510.0 508.9<br />
Goodwill additions in 2009 arise mainly from adjustments to the purchase price of the Musa Motors group under certain earn out<br />
arrangements (see note 27).<br />
Goodwill is subject to impairment testing annually, or more frequently where there are indications that the goodwill may be impaired.<br />
Impairment tests were performed for all CGUs during the year ended 31 December 2009.<br />
The recoverable amounts of all CGUs were determined based on value in use calculations. These calculations use cash flow projections<br />
based on five year financial forecasts prepared by management. The key assumptions for these forecasts are those relating to revenue<br />
growth / decline, operating margins and the level of working capital required to support trading, which have been based on past<br />
experience, recent trading and expectations of future changes in the relevant markets. They also reflect expectations about continuing<br />
relationships with key brand partners.<br />
Cash flows after the five year period are extrapolated at an estimated average long-term growth rate for each market. These growth<br />
rates reflect the long-term growth prospects of the markets in which the CGUs operate. The growth rates used vary between 0% and 5%<br />
and are consistent with appropriate external sources for the relevant markets.<br />
Cash flows are discounted back to present value using a risk adjusted discount rate. The discount rate assumptions are based on an<br />
estimate of the Group’s weighted average cost of capital adjusted for a risk premium attributable to the relevant CGU. The pre-tax<br />
discount rates used vary between 10% and 12%, and reflect long-term country risk.<br />
The assumptions used with regards to pre-tax discount rates and long-term growth rates in those segments with material goodwill<br />
balances were as follows:<br />
Discount rate<br />
Long-term growth rate<br />
United Kingdom 11% 2%<br />
Russia and Emerging Markets 11% to 12% 5%<br />
South Asia 10% 1%<br />
Australasia 11% 2%<br />
Impairment<br />
No impairment charge has been recognised during the year ended 31 December 2009. In the year ended 31 December 2008, the<br />
goodwill in relation to the Group’s businesses in Latvia (reported in the Russia and Emerging Markets segment) was impaired by<br />
£46.8m following a significant deterioration in the automotive sector in that market which adversely affected revenue and trading<br />
profit. In addition, goodwill of £7.4m related to sites in the UK which were sold or closed was impaired in 2008.<br />
Sensitivities<br />
The Group’s value in use calculations are sensitive to a change in the key assumptions used, most notably the discount rates and the<br />
long-term growth rates. With the exception of the Musa Motors group in Russia and the Group’s business in Lithuania, a reasonably<br />
possible change in a key assumption will not cause an impairment in any of the other CGUs.<br />
2009<br />
£m<br />
2008<br />
£m<br />
110<br />
<strong>Inchcape</strong> plc ¦ <strong>Annual</strong> <strong>Report</strong> and Accounts 2009
Section<br />
Three<br />
Financial<br />
statements<br />
11 Intangible assets continued<br />
The Group’s goodwill in the Russia and Emerging Markets segment at 31 December 2009 is allocated as follows:<br />
Cost<br />
£m<br />
Impairment<br />
provision<br />
£m<br />
Net book<br />
value<br />
£m<br />
Musa Motors group (Russia) 126.6 – 126.6<br />
<strong>Inchcape</strong> Olimp (Russia) 63.8 – 63.8<br />
Latvia 46.4 (46.4) –<br />
Lithuania 23.2 – 23.2<br />
Other 2.9 – 2.9<br />
At 31 December 2009 262.9 (46.4) 216.5<br />
The value in use calculations for the Musa Motors group currently exceed the carrying value by approximately 20%. A 0.5% increase in<br />
the discount rate or a 0.5% reduction in the long-term growth rate would reduce the headroom available to approximately 5% of the<br />
carrying value. The value in use calculations for the Group’s business in Lithuania currently exceed the carrying value by approximately<br />
10%. A 0.5% increase in the discount rate or a 0.5% reduction in the long-term growth rate would eliminate the headroom available.<br />
b. Other intangible assets<br />
Computer software costs consist of purchase prices from third parties as well as internally generated software development costs. They<br />
include both assets in the course of development and assets in operation. The amortisation charge is largely included within<br />
‘administrative expenses’ in the consolidated income statement.<br />
Other intangible assets include customer contracts and back orders recognised on the acquisition of a business. These intangible<br />
assets are recognised at the fair value attributable to them on acquisition, and are amortised on a straight line basis over their useful<br />
life (usually up to one year).<br />
www.inchcape.com 111
Financial statements<br />
Notes to the accounts continued<br />
12 Property, plant and equipment<br />
Land and<br />
buildings<br />
£m<br />
Plant,<br />
machinery<br />
and<br />
equipment<br />
£m<br />
Subtotal<br />
£m<br />
Interest<br />
in leased<br />
vehicles<br />
£m<br />
Cost<br />
At 1 January 2008 391.5 152.5 544.0 113.4 657.4<br />
Businesses acquired 17.8 5.4 23.2 – 23.2<br />
Businesses sold (6.9) (4.8) (11.7) – (11.7)<br />
Additions 87.5 30.3 117.8 63.5 181.3<br />
Disposals (9.0) (20.9) (29.9) – (29.9)<br />
Transferred to inventory – – – (48.1) (48.1)<br />
Reclassified from disposal group 46.1 9.7 55.8 – 55.8<br />
Effect of foreign exchange rate changes 48.7 30.6 79.3 10.6 89.9<br />
At 1 January 2009 575.7 202.8 778.5 139.4 917.9<br />
Businesses sold (0.4) (1.7) (2.1) – (2.1)<br />
Additions 35.2 14.7 49.9 38.7 88.6<br />
Disposals (6.3) (8.9) (15.2) – (15.2)<br />
Transferred to inventory – – – (54.3) (54.3)<br />
Reclassified to assets held for sale (7.6) – (7.6) – (7.6)<br />
Reclassifications – (23.5) (23.5) 23.5 –<br />
Effect of foreign exchange rate changes (19.5) (7.4) (26.9) (6.0) (32.9)<br />
At 31 December 2009 577.1 176.0 753.1 141.3 894.4<br />
Depreciation and impairment<br />
At 1 January 2008 (31.0) (83.6) (114.6) (23.5) (138.1)<br />
Businesses sold 0.3 3.1 3.4 – 3.4<br />
Depreciation charge for the year (15.1) (21.0) (36.1) (19.6) (55.7)<br />
Disposals 0.6 13.0 13.6 – 13.6<br />
Transferred to inventory – – – 11.0 11.0<br />
Reclassified from disposal group (5.5) (8.0) (13.5) – (13.5)<br />
Effect of foreign exchange rate changes (7.7) (18.8) (26.5) (4.0) (30.5)<br />
At 1 January 2009 (58.4) (115.3) (173.7) (36.1) (209.8)<br />
Businesses sold 0.1 1.5 1.6 – 1.6<br />
Depreciation charge for the year (10.1) (18.5) (28.6) (24.7) (53.3)<br />
Impairment losses recognised during the year (14.5) – (14.5) – (14.5)<br />
Disposals 1.1 6.3 7.4 – 7.4<br />
Transferred to inventory – – – 20.7 20.7<br />
Reclassified to assets held for sale 1.0 – 1.0 – 1.0<br />
Reclassifications – 9.1 9.1 (9.1) –<br />
Effect of foreign exchange rate changes 2.9 4.4 7.3 1.8 9.1<br />
At 31 December 2009 (77.9) (112.5) (190.4) (47.4) (237.8)<br />
Net book value at 31 December 2009 499.2 63.5 562.7 93.9 656.6<br />
Net book value at 31 December 2008 517.3 87.5 604.8 103.3 708.1<br />
Certain subsidiaries have an obligation to repurchase, at a guaranteed residual value, vehicles which have been legally sold for leasing<br />
contracts. These assets are included in ‘interest in leased vehicles’ in the table above.<br />
Total<br />
£m<br />
112<br />
<strong>Inchcape</strong> plc ¦ <strong>Annual</strong> <strong>Report</strong> and Accounts 2009
Section<br />
Three<br />
Financial<br />
statements<br />
12 Property, plant and equipment continued<br />
Assets held under finance leases have the following net book values:<br />
Leasehold buildings 1.4 1.5<br />
Plant, machinery and equipment 2.9 4.4<br />
The book value of land and buildings is analysed between:<br />
2009<br />
£m<br />
2008<br />
£m<br />
4.3 5.9<br />
Freehold 387.5 447.7<br />
Leasehold with over fifty years unexpired 36.7 45.9<br />
Short leasehold 75.0 23.7<br />
2009<br />
£m<br />
2008<br />
£m<br />
499.2 517.3<br />
As at 31 December 2009, £2.9m (2008 – £2.0m) of capitalised borrowing costs were included within ‘land and buildings’, £0.9m of which<br />
was capitalised in 2009 (2008 – £2.0m).<br />
13 Investments in joint ventures and associates<br />
At 1 January 21.3 15.3<br />
Additions – 0.4<br />
Share of profit after tax of joint ventures and associates 0.7 2.2<br />
Dividends paid (0.6) (1.3)<br />
Loan advances 2.3 1.7<br />
Acquisition of remaining interests – (0.6)<br />
Other movements – (0.1)<br />
Effect of foreign exchange rate changes (1.4) 3.7<br />
At 31 December 22.3 21.3<br />
Group’s share of net assets of joint ventures and associates<br />
Joint ventures Associates Total<br />
2009<br />
£m<br />
Non-current assets 68.0 99.0 0.8 2.6 68.8 101.6<br />
Current assets 59.0 162.4 46.6 62.5 105.6 224.9<br />
Group’s share of gross assets 127.0 261.4 47.4 65.1 174.4 326.5<br />
Current liabilities (9.2) (65.2) (32.5) (42.7) (41.7) (107.9)<br />
Non-current liabilities (105.2) (183.5) (5.2) (13.8) (110.4) (197.3)<br />
Group’s share of gross liabilities (114.4) (248.7) (37.7) (56.5) (152.1) (305.2)<br />
Group’s share of net assets 12.6 12.7 9.7 8.6 22.3 21.3<br />
Group’s share of results of joint ventures and associates<br />
Revenue 2.6 3.8 3.6 4.0 6.2 7.8<br />
Expenses (3.0) (2.4) (2.6) (2.3) (5.6) (4.7)<br />
Profit / (loss) before tax (0.4) 1.4 1.0 1.7 0.6 3.1<br />
Tax 0.4 (0.4) (0.3) (0.5) 0.1 (0.9)<br />
Share of profit after tax of joint ventures and associates – 1.0 0.7 1.2 0.7 2.2<br />
As at 31 December 2009, no guarantees were provided in respect of joint ventures and associates borrowings (2008 – £17.9m).<br />
2008<br />
£m<br />
2009<br />
£m<br />
2008<br />
£m<br />
2009<br />
£m<br />
2009<br />
£m<br />
2008<br />
£m<br />
2008<br />
£m<br />
www.inchcape.com 113
Financial statements<br />
Notes to the accounts continued<br />
14 Available for sale financial assets<br />
At 1 January 19.9 16.7<br />
Additions 1.6 0.1<br />
Disposals (1.7) (0.5)<br />
Fair value movement transferred to shareholders’ equity 0.4 (1.1)<br />
Effect of foreign exchange rate changes (1.7) 4.7<br />
At 31 December 18.5 19.9<br />
Analysed as:<br />
Non-current 17.8 17.9<br />
Current 0.7 2.0<br />
Assets held are analysed as follows:<br />
2009<br />
£m<br />
2009<br />
£m<br />
2008<br />
£m<br />
2008<br />
£m<br />
18.5 19.9<br />
Equity securities 0.3 0.2<br />
Bonds 15.9 17.6<br />
Other 2.3 2.1<br />
2009<br />
£m<br />
2008<br />
£m<br />
18.5 19.9<br />
At 31 December 2009 the bonds attracted a weighted average fixed interest rate of 5.2% (2008 – 5.1%). The bonds are traded on active<br />
markets with coupons generally paid on an annual basis.<br />
Other includes debentures that are not subject to interest rates and do not have fixed maturity dates. They are valued by reference to<br />
traded market values.<br />
Available for sale financial assets subject to fixed interest rates are aged by maturity date as follows:<br />
Less than<br />
one year<br />
£m<br />
Between<br />
one and<br />
two years<br />
£m<br />
Between<br />
two and<br />
three years<br />
£m<br />
Between<br />
three and<br />
four years<br />
£m<br />
Between<br />
four and<br />
five years<br />
£m<br />
Greater<br />
than five<br />
years<br />
£m<br />
Total<br />
interest<br />
bearing<br />
£m<br />
2009 0.4 1.5 0.9 1.8 1.8 9.5 15.9<br />
2008 1.8 0.4 1.7 – 2.0 11.7 17.6<br />
In certain jurisdictions management holds bonds to offset future vehicle warranty obligations. To meet this requirement, management<br />
purchases and sells bonds regularly and does not usually hold the bonds to maturity. Accordingly, the maturity profile of the bonds is<br />
not necessarily an indication of when management intends to realise the associated future cash flows.<br />
The maximum exposure to credit risk at the reporting date is the fair value of the bonds classified as available for sale.<br />
114<br />
<strong>Inchcape</strong> plc ¦ <strong>Annual</strong> <strong>Report</strong> and Accounts 2009
Section<br />
Three<br />
Financial<br />
statements<br />
15 Trade and other receivables<br />
2009<br />
£m<br />
Current<br />
2008<br />
£m<br />
2009<br />
£m<br />
Non-current<br />
Trade receivables 156.5 162.2 1.3 –<br />
Less: provision for impairment of trade receivables (8.0) (7.1) – –<br />
Net trade receivables 148.5 155.1 1.3 –<br />
Amounts receivable from related parties 1.2 3.4 – 2.6<br />
Prepayments and accrued income 71.8 77.0 7.0 7.4<br />
Other receivables 31.4 36.3 17.1 16.5<br />
Movements in the provision for impairment of receivables were as follows:<br />
2008<br />
£m<br />
252.9 271.8 25.4 26.5<br />
At 1 January (7.1) (5.2)<br />
Businesses sold – 0.6<br />
Charge for the year (3.8) (2.3)<br />
Amounts written off 0.5 0.3<br />
Unused amounts reversed 1.9 0.8<br />
Effect of foreign exchange rate changes 0.5 (1.3)<br />
At 31 December (8.0) (7.1)<br />
At 31 December, the analysis of trade receivables is as follows:<br />
Total<br />
2009<br />
£m<br />
2008<br />
£m<br />
Neither past<br />
Past due but not impaired<br />
due nor<br />
impaired 0 < 30 days 30 – 90 days > 90 days Impaired<br />
£m £m £m £m £m £m<br />
2009 157.8 117.4 16.8 7.0 8.6 8.0<br />
2008 162.2 117.0 18.2 8.2 11.7 7.1<br />
Trade receivables are non-interest bearing and are generally on credit terms of 30 to 60 days.<br />
Management considers the carrying amount of trade and other receivables to approximate to their fair value. Long-term receivables<br />
have been discounted where the time value of money is considered to be material.<br />
Concentration of credit risk with respect to trade receivables is very limited due to the Group’s broad customer base across a number of<br />
geographic regions.<br />
www.inchcape.com 115
Financial statements<br />
Notes to the accounts continued<br />
16 Deferred tax<br />
Net deferred tax asset / (liability)<br />
Pension<br />
and other<br />
postretirement<br />
benefits<br />
£m<br />
Cash flow<br />
hedges<br />
£m<br />
Share-based<br />
payments<br />
£m<br />
Tax losses<br />
£m<br />
Accelerated<br />
tax<br />
depreciation<br />
£m<br />
Provisions and<br />
other timing<br />
differences<br />
£m<br />
At 1 January 2009 (7.0) (36.6) – 1.8 14.1 (29.9) (57.6)<br />
Businesses acquired – – – – – (1.1) (1.1)<br />
Credited / (charged) to the consolidated<br />
income statement 7.0 4.4 0.7 (0.3) (3.1) 10.1 18.8<br />
Credited to shareholders’ equity 22.6 38.0 0.6 – – – 61.2<br />
Effect of foreign exchange rate changes – 0.3 – (0.2) 0.1 0.7 0.9<br />
At 31 December 2009 22.6 6.1 1.3 1.3 11.1 (20.2) 22.2<br />
Analysed as:<br />
Deferred tax assets 37.6 11.5<br />
Deferred tax liabilities (15.4) (69.1)<br />
22.2 (57.6)<br />
The Group has unrecognised deferred tax assets of £30m (2008 – £24m) relating to tax relief on trading losses. The asset represents<br />
£122m (2008 – £101m) of losses at the standard blended rate of 24.8%. The asset is not recognised as it relates to losses which exist<br />
within legal entities that are not forecast to generate taxable income with reasonable certainty in the foreseeable future.<br />
The deferred tax asset of £1.3m (2008 – £1.8m) relates to trading losses in Belgium where future profits are anticipated with<br />
reasonable certainty.<br />
The Group has unrecognised deferred tax assets of £37m (2008 – £38m restated at the UK rate) relating to capital losses. The asset<br />
represents £132m (2008 – £135m) of losses at the UK standard rate of 28.0%. The key territory holding the losses is the UK.<br />
No deferred tax is recognised on unremitted earnings of overseas subsidiaries and joint ventures. Due to the enactment of the 2009<br />
Finance Act, the majority of overseas reserves can now be repatriated to the UK with no tax cost. If all overseas earnings were repatriated<br />
with immediate effect, no tax charge (2008 – £71m) would be payable.<br />
The £20.2m deferred tax liability for ‘Provisions and other timing differences’ consists of a £33.5m (2008 – £45.2m) liability in respect of the<br />
net book value of tangible fixed assets that do not qualify for tax allowances and property revaluations, and a £13.3m (2008 – £15.3m)<br />
deferred tax asset in respect of provisions and other temporary differences between the accounts base and the tax base. The key<br />
temporary differences are £3.9m for Greece, £5.8m for Australia and £3.6m in other territories.<br />
17 Inventories<br />
Raw materials and work in progress 8.1 10.1<br />
Finished goods and merchandise 764.6 1,074.0<br />
772.7 1,084.1<br />
Vehicles held on consignment which are in substance assets of the Group amount to £110.0m (2008 – £175.5m). These have been<br />
included in ‘finished goods and merchandise’ with the corresponding liability included within ‘trade and other payables’. Payment<br />
becomes due when title passes to the Group, which is generally the earlier of six months from delivery or the date of sale.<br />
An amount of £31.4m (2008 – £48.7m) has been provided against the gross cost of inventory at the year end. The cost of inventories<br />
recognised as an expense in the year is £3,892.8m (2008 – £4,308.8m). The write down of inventory to net realisable value recognised as<br />
an expense during the year was £14.6m (2008 – £31.5m). All of these items have been included within ‘cost of sales’ in the consolidated<br />
income statement.<br />
2009<br />
£m<br />
2009<br />
£m<br />
Total<br />
£m<br />
2008<br />
£m<br />
2008<br />
£m<br />
116<br />
<strong>Inchcape</strong> plc ¦ <strong>Annual</strong> <strong>Report</strong> and Accounts 2009
Section<br />
Three<br />
Financial<br />
statements<br />
18 Cash and cash equivalents<br />
Cash at bank and in hand 319.6 351.3<br />
Short-term deposits 61.7 106.7<br />
2009<br />
£m<br />
2008<br />
£m<br />
381.3 458.0<br />
Cash and cash equivalents are generally subject to floating interest rates determined by reference to short-term benchmark rates<br />
applicable in the relevant currency or market (primarily LIBOR or the local equivalent). At 31 December 2009, the weighted average<br />
floating rate was 0.6% (2008 – 1.9%).<br />
£22.0m (2008 – £44.0m) of cash and cash equivalents is held in countries where prior approval is required to transfer funds abroad.<br />
If the Group complies with the required procedures, such liquid funds are at its disposition within a reasonable period of time.<br />
At 31 December 2009, short-term deposits have a weighted average period to maturity of 41 days (2008 – 32 days).<br />
19 Assets held for sale<br />
Assets held for sale 6.6 5.4<br />
Assets held for sale relate to a surplus property that was disposed of in February 2010.<br />
20 Trade and other payables<br />
2009<br />
£m<br />
Current<br />
2008<br />
£m<br />
2009<br />
£m<br />
2009<br />
£m<br />
2008<br />
£m<br />
Non-current<br />
2008<br />
£m<br />
Trade payables: payments received on account 55.5 49.9 0.1 0.2<br />
vehicle funding agreements 67.9 61.6 – –<br />
other trade payables 579.3 793.2 24.8 30.8<br />
Other taxation and social security payable 18.8 25.8 – –<br />
Accruals and deferred income 191.0 178.4 25.1 35.6<br />
Amounts payable to related parties 6.3 4.6 – –<br />
Other payables 20.3 10.4 18.8 11.5<br />
939.1 1,123.9 68.8 78.1<br />
The Group entered into vehicle funding agreements whereby the Group is able to refinance interest bearing amounts due to suppliers<br />
on similar terms. Amounts outstanding under these agreements are included within vehicle funding agreements above and interest<br />
charged under this agreement is included within stock holding interest.<br />
At 31 December 2009 current other trade payables includes £313.6m (2008 – £473.2m) of creditors where payment is made on deferred<br />
terms and is subject to a weighted average floating interest rate of 2.0% (2008 – 4.7%). Interest charged on these balances is included<br />
within stock holding interest.<br />
Management considers the carrying amount of trade and other payables to approximate to their fair value. Long-term payables have<br />
been discounted where the time value of money is considered to be material.<br />
www.inchcape.com 117
Financial statements<br />
Notes to the accounts continued<br />
21 Provisions<br />
Product<br />
warranty<br />
£m<br />
Vacant<br />
leasehold<br />
£m<br />
Litigation<br />
£m<br />
At 1 January 2009 59.3 9.4 14.0 19.9 102.6<br />
Charged to the consolidated income statement 30.4 6.7 2.2 2.8 42.1<br />
Released to the consolidated income statement (3.4) (1.8) (1.6) (4.9) (11.7)<br />
Effect of unwinding of discount factor 0.4 0.2 – – 0.6<br />
Utilised during the year (25.7) (3.4) (1.3) (5.2) (35.6)<br />
Subsidiaries acquired – – – 0.1 0.1<br />
Effect of foreign exchange rate changes (2.4) – (0.4) (0.9) (3.7)<br />
At 31 December 2009 58.6 11.1 12.9 11.8 94.4<br />
Other<br />
£m<br />
Total<br />
£m<br />
Analysed as: 2009<br />
£m<br />
Current 46.7 50.6<br />
Non-current 47.7 52.0<br />
2008<br />
£m<br />
94.4 102.6<br />
Product warranty<br />
Certain Group companies provide self-insured extended warranties beyond those provided by the manufacturer, as part of the sale<br />
of the vehicle. These are not separable products. The warranty periods covered are up to six years and/or specific mileage limits.<br />
Provision is made for the expected cost of labour and parts based on historical claims experience and expected future trends.<br />
These assumptions are reviewed regularly.<br />
Vacant leasehold<br />
The Group is committed to certain leasehold premises for which it no longer has a commercial use. These are principally located in<br />
the UK. Provision has been made to the extent of the estimated future net cost. This includes taking into account existing subtenant<br />
arrangements. The expected utilisation period of these provisions is generally over the next 10 years.<br />
Litigation<br />
This includes a number of litigation provisions in respect of the exit of certain motors and non-motors businesses. The majority of these<br />
relate to the exit of our former South American bottling business and shipping business. The cases are largely historic claims and are<br />
generally expected to be concluded within the next three to five years.<br />
Other<br />
This category principally includes provisions relating to residual values on leased vehicles, which are expected to be settled within<br />
three years.<br />
118<br />
<strong>Inchcape</strong> plc ¦ <strong>Annual</strong> <strong>Report</strong> and Accounts 2009
Section<br />
Three<br />
Financial<br />
statements<br />
22 Borrowings<br />
2009 £m<br />
Floating rate<br />
Weighted<br />
average<br />
effective<br />
interest rate<br />
% £m<br />
Fixed rate<br />
Weighted<br />
average<br />
effective<br />
interest rate<br />
%<br />
Total interest<br />
bearing<br />
£m<br />
On which no<br />
interest is paid<br />
£m<br />
Current<br />
Bank overdrafts 122.4 1.5 – – 122.4 1.7 124.1<br />
Bank loans 35.0 0.8 4.4 13.3 39.4 – 39.4<br />
Other loans 1.2 0.1 0.1 1.8 1.3 – 1.3<br />
Finance leases 0.9 2.9 0.3 7.9 1.2 – 1.2<br />
159.5 1.3 4.8 12.8 164.3 1.7 166.0<br />
Non-current<br />
Bank loans – – – – – 0.9 0.9<br />
Private Placement 294.8 1.7 – – 294.8 – 294.8<br />
Finance leases 1.0 3.0 2.5 7.1 3.5 – 3.5<br />
295.8 1.7 2.5 7.1 298.3 0.9 299.2<br />
Total borrowings 455.3 1.6 7.3 10.8 462.6 2.6 465.2<br />
2009<br />
Total<br />
£m<br />
2008 £m<br />
Floating rate<br />
Weighted<br />
average<br />
effective<br />
interest rate<br />
% £m<br />
Fixed rate<br />
Weighted<br />
average<br />
effective<br />
interest rate<br />
%<br />
Total interest<br />
bearing<br />
£m<br />
On which no<br />
interest is paid<br />
£m<br />
Current<br />
Bank overdrafts 144.9 3.0 – – 144.9 0.3 145.2<br />
Bank loans 3.0 7.2 3.5 14.0 6.5 – 6.5<br />
Other loans 1.8 5.2 7.4 14.0 9.2 – 9.2<br />
Finance leases 4.1 5.6 0.3 7.7 4.4 – 4.4<br />
153.8 3.2 11.2 13.8 165.0 0.3 165.3<br />
Non-current<br />
Bank loans 405.0 2.3 0.6 14.0 405.6 2.0 407.6<br />
Private Placement 391.8 5.0 52.1 6.0 443.9 – 443.9<br />
Finance leases 1.9 6.7 2.7 7.2 4.6 – 4.6<br />
798.7 3.7 55.4 6.1 854.1 2.0 856.1<br />
Total borrowings 952.5 3.6 66.6 7.4 1,019.1 2.3 1,021.4<br />
Interest payments on floating rate financial liabilities are determined by reference to short-term benchmark rates applicable in the<br />
relevant currency or market (primarily LIBOR or the local equivalent).<br />
The fair values of the Group’s borrowings are not considered to be materially different from their book value with the exception of the<br />
Private Placement which includes a fair value basis adjustment of £24.6m (2008 – £62.5m).<br />
The Group’s borrowings are unsecured.<br />
At 31 December, £nil (2008 – £370m) of the £500m syndicated credit facility that expires in 2013 was drawn down.<br />
In addition, the Group has a £35m bilateral facility which expires in 2010.<br />
US$475m of the Group’s US$550m Private Placement has historically been swapped into Sterling. During the year, US$114m of the<br />
US$550m was repaid to the loan noteholders, of which US$39m related to the original US$475m swapped into Sterling. It was replaced<br />
with an opposing US$39m swap (see note 23 for further details). US$275m is repayable in eight years and US$161m in 10 years.<br />
2008<br />
Total<br />
£m<br />
www.inchcape.com 119
Financial statements<br />
Notes to the accounts continued<br />
22 Borrowings continued<br />
The table below sets out the maturity profile of the Group’s borrowings that are exposed to interest rate risk. This analysis is presented<br />
after taking account of the cross currency fixed to floating interest rate swap on US$436m of the Private Placement.<br />
2009<br />
Fixed rate<br />
Less than<br />
one year<br />
£m<br />
Between one<br />
and two years<br />
£m<br />
Between two<br />
and three years<br />
£m<br />
Between three<br />
and four years<br />
£m<br />
Between four<br />
and five years<br />
£m<br />
Greater than<br />
five years<br />
£m<br />
Total interest<br />
bearing<br />
£m<br />
Bank loans 4.4 – – – – – 4.4<br />
Other loans 0.1 – – – – – 0.1<br />
Finance leases 0.3 0.1 0.1 – – 2.3 2.8<br />
Floating rate<br />
Bank overdrafts 122.4 – – – – – 122.4<br />
Bank loans 35.0 – – – – – 35.0<br />
Other loans 1.2 – – – – – 1.2<br />
Private Placement – – – – – 294.8 294.8<br />
Finance leases 0.9 0.6 0.4 – – – 1.9<br />
2008<br />
Fixed rate<br />
Less than<br />
one year<br />
£m<br />
Between one<br />
and two years<br />
£m<br />
Between two<br />
and three years<br />
£m<br />
Between three<br />
and four years<br />
£m<br />
Between four<br />
and five years<br />
£m<br />
Greater than<br />
five years<br />
£m<br />
Total interest<br />
bearing<br />
£m<br />
Bank loans 3.5 0.2 0.3 0.1 – – 4.1<br />
Other loans 7.4 – – – – – 7.4<br />
Private Placement – – – – – 52.1 52.1<br />
Finance leases 0.3 0.1 0.1 0.1 0.1 2.3 3.0<br />
Floating rate<br />
Bank overdrafts 144.9 – – – – – 144.9<br />
Bank loans 3.0 35.0 – – 370.0 – 408.0<br />
Other loans 1.8 – – – – – 1.8<br />
Private Placement – – – – – 391.8 391.8<br />
Finance leases 4.1 0.9 1.0 – – – 6.0<br />
23 Financial instruments<br />
The Group’s financial liabilities, other than derivatives, comprise bank loans and overdrafts, loan notes, finances leases and trade<br />
and other payables. The main purpose of these instruments is to raise finance for the Group’s operations. The Group also has various<br />
financial assets such as trade and other receivables, cash and short-term deposits which arise from its trading operations.<br />
The Group’s primary derivative transactions are forward and swap currency contracts, and cross currency interest rate swaps.<br />
The purpose is to manage the currency and interest rate risks arising from the Group’s trading operations and its sources of finance.<br />
The main risks arising from the Group’s financial instruments are interest rate risk, currency risk, credit risk and liquidity risk.<br />
a. Classes of financial instruments<br />
2009<br />
Loans and<br />
receivables<br />
£m<br />
Available for<br />
sale<br />
£m<br />
Held at fair<br />
value<br />
£m<br />
Amortised<br />
cost<br />
£m<br />
Financial assets<br />
Available for sale financial assets – 18.5 – – 18.5<br />
Trade and other receivables 245.0 – – – 245.0<br />
Derivative financial instruments – – 91.0 – 91.0<br />
Cash and cash equivalents – – – 381.3 381.3<br />
Total financial assets 245.0 18.5 91.0 381.3 735.8<br />
Financial liabilities<br />
Trade and other payables – – – (891.0) (891.0)<br />
Derivative financial instruments – – (21.8) – (21.8)<br />
Borrowings – – – (465.2) (465.2)<br />
Total financial liabilities – – (21.8) (1,356.2) (1,378.0)<br />
245.0 18.5 69.2 (974.9) (642.2)<br />
Total<br />
£m<br />
120<br />
<strong>Inchcape</strong> plc ¦ <strong>Annual</strong> <strong>Report</strong> and Accounts 2009
Section<br />
Three<br />
Financial<br />
statements<br />
23 Financial instruments continued<br />
2008<br />
Loans and<br />
receivables<br />
£m<br />
Available<br />
for sale<br />
£m<br />
Held at fair<br />
value<br />
£m<br />
Amortised<br />
cost<br />
£m<br />
Financial assets<br />
Available for sale financial assets – 19.9 – – 19.9<br />
Trade and other receivables 252.8 – – – 252.8<br />
Derivative financial instruments – – 306.9 – 306.9<br />
Cash and cash equivalents – – – 458.0 458.0<br />
Total financial assets 252.8 19.9 306.9 458.0 1,037.6<br />
Financial liabilities<br />
Trade and other payables – – – (1,079.1) (1,079.1)<br />
Borrowings – – – (1,021.4) (1,021.4)<br />
Total financial liabilities – – – (2,100.5) (2,100.5)<br />
252.8 19.9 306.9 (1,642.5) (1,062.9)<br />
b. Market risk and sensitivity analysis<br />
Financial instruments affected by market risk include borrowings, deposits and derivative financial instruments. The Group is not exposed<br />
to commodity price risk. The following analysis, required by IFRS 7, is intended to illustrate the sensitivity to changes in market variables,<br />
being primarily UK interest rates and the Australian Dollar to Japanese Yen exchange rate.<br />
The following assumptions were made in calculating the sensitivity analysis:<br />
• changes in the carrying value of derivative financial instruments designated as cash flow hedges from movements in interest rates are<br />
assumed to be recorded fully in equity;<br />
• changes in the carrying value of derivative financial instruments designated as fair value hedges from movements in interest rates<br />
have an immaterial effect on the consolidated income statement and equity due to compensating adjustments in the carrying<br />
value of debt;<br />
• changes in the carrying value of financial instruments designated as net investment hedges from movements in the US Dollar to<br />
Sterling exchange rate are recorded directly in equity;<br />
• changes in the carrying value of financial instruments not in hedging relationships only affect the consolidated income statement;<br />
• all other changes in the carrying value of derivative financial instruments designated as hedges are fully effective with no impact<br />
on the consolidated income statement.<br />
c. Interest rate risk and sensitivity analysis<br />
The Group’s interest rate policy has the objective of minimising net interest expense, and protecting the Group from material adverse<br />
movements in interest rates. Throughout 2009, the Group has borrowed at floating rates only (after taking into account existing interest<br />
rate hedging activities), with the exception of US$75m of debt which was fully repaid during the year. This approach maximises the<br />
Group’s exposure to the current low interest rate environment. If hedging is deemed appropriate by management in the future, the<br />
Board has approved the fixing of up to 30% of gross borrowings. Instruments approved for this purpose include interest rate swaps,<br />
forward rate agreements and options. The Group’s exposure to the risk of changes in market interest rates arises primarily from the<br />
floating rate interest payable on the Group’s 10 and 12 year loan notes, bank borrowings and supplier related finance.<br />
Interest rate risk table<br />
The following table demonstrates the sensitivity to a reasonably possible change in interest rates, with all other variables held constant,<br />
of the Group’s profit before tax through the impact of floating rate borrowings.<br />
Increase/<br />
decrease<br />
in basis<br />
points<br />
Total<br />
£m<br />
Effect on profit<br />
before tax<br />
£m<br />
2009<br />
Sterling 75 3.4<br />
Euro 50 0.3<br />
Australian Dollar 100 (0.7)<br />
2008<br />
Sterling 75 8.2<br />
Euro 50 0.2<br />
Australian Dollar 100 (0.7)<br />
www.inchcape.com 121
Financial statements<br />
Notes to the accounts continued<br />
23 Financial instruments continued<br />
d. Foreign currency risk<br />
The Group publishes its consolidated Financial statements in Sterling and faces currency risk on the translation of its earnings and net<br />
assets, a significant proportion of which are in currencies other than Sterling.<br />
Hedge of foreign currency operating profit<br />
During the year the Group sought to partially hedge the retranslation of the Group’s forecast foreign currency operating profit by putting<br />
in place 50 currency put options with a total nominal value of £136.3m, at a cost of £8.6m. The primary objective was to hedge against<br />
Sterling appreciating during the year and therefore adversely affecting the retranslation of foreign currency operating profit. The 50<br />
options were equally split across five currencies, Australian Dollar, Hong Kong Dollar, Euro, Singapore Dollar and US Dollar, with each<br />
option hedging one month’s operating profit. At the end of the year all contracts had matured and a gain of £0.1m (2008 – nil) was<br />
recognised in the consolidated income statement, net of the option costs. The nominal principal amount of outstanding contracts<br />
at the year end was £nil.<br />
Transaction exposure hedging<br />
The Group has transactional currency exposures, where sales or purchases by an operating unit are in currencies other than in that<br />
unit’s reporting currency. For a significant proportion of the Group these exposures are removed as trading is denominated in the<br />
relevant local currency. In particular, local billing arrangements are in place for many of our businesses with our brand partners.<br />
The principal exception is for our business in Australia which purchases vehicles in Japanese Yen.<br />
In this instance, the Group seeks to hedge forecast transactional foreign exchange rate risk using forward foreign currency exchange<br />
contracts. The effective portion of the gain or loss on the hedge is recognised in the consolidated statement of comprehensive income<br />
to the extent it is effective and recycled into the consolidated income statement at the same time as the underlying hedged transaction<br />
affects the consolidated income statement. Under IAS 39 hedges are documented and tested for the hedge effectiveness on an<br />
ongoing basis.<br />
Hedge of foreign currency debt<br />
The Group uses cross currency interest rate swaps to hedge the forward foreign currency risk associated with US$475m of the US$550m<br />
Private Placement. The effective portion on the gain or loss of the hedge is recognised in the consolidated income statement at the<br />
same time as the underlying hedged transaction affects the consolidated income statement. In May 2009, US$114.2m of the US$550m<br />
Private Placement was repaid, of which US$75m relates to the net investment hedge of US$ assets. The remaining US$39m of repaid<br />
debt was replaced with a new US$39m cross currency interest rate swap and under IAS 39 the US$475m fair value hedge relationship<br />
was de-designated and re-designated as a US$436m fair value hedge. A gain of £3.9m was recognised on the de-designation of the<br />
hedge relationship. In accordance with IAS 39, these hedges are documented and tested for hedge effectiveness on an ongoing basis.<br />
The remaining US$39.2m cross currency interest rate swaps are fair valued through the consolidated income statement and therefore<br />
not tested for hedge effectiveness.<br />
Net investment hedging<br />
Consideration is given to the currency mix of debt with the primary objective that interest on such borrowings acts as a hedge on<br />
foreign currency earnings. In accordance with IAS 39 the Group designated US$75m of the Private Placement as a hedge against<br />
US Dollar related assets in Hong Kong, Saipan and Guam. This relationship was de-designated in May 2009 when the US$75m of<br />
debt designated as a net investment hedge was repaid.<br />
Foreign currency risk table<br />
The following table shows the Group sensitivity to a reasonably possible change in foreign exchange rates on its Japanese Yen<br />
(2008 – Japanese Yen and US Dollar) financial instruments. In this table, financial instruments are only considered sensitive to foreign<br />
exchange rates when they are not in the functional currency of the entity that holds them.<br />
Increase/<br />
(decrease)<br />
in exchange<br />
rate<br />
Effect on<br />
equity<br />
£m<br />
2009<br />
Yen +10% (1.0)<br />
Yen -10% (0.9)<br />
2008<br />
Yen +10% (2.6)<br />
Yen -10% 2.0<br />
US Dollar +10% 2.8<br />
US Dollar -10% (2.3)<br />
122<br />
<strong>Inchcape</strong> plc ¦ <strong>Annual</strong> <strong>Report</strong> and Accounts 2009
Section<br />
Three<br />
Financial<br />
statements<br />
23 Financial instruments continued<br />
e. Credit risk<br />
The amount due from counterparties arising from cash deposits and the use of financial instruments creates credit risk. The Group<br />
monitors its credit exposure to its counterparties via their credit ratings (where applicable) and through its policy of limiting its exposure<br />
to any one party to ensure that they are within Board approved limits and that there are no significant concentrations of credit risk.<br />
Group policy is to deposit cash and use financial instruments with counterparties with a long-term credit rating of A or better, where<br />
available. The notional amounts of financial instruments used in interest rate and foreign exchange management do not represent the<br />
credit risk arising through the use of these instruments. The immediate credit risk of these instruments is generally estimated by the fair<br />
value of contracts with a positive value. The maximum exposure to credit risk for receivables and other financial assets is represented<br />
by their carrying amount.<br />
Credit limits are reviewed regularly.<br />
The table below shows the credit rating and balances held with major counterparties at the end of the reporting period:<br />
Counterparty<br />
Derivative<br />
assets<br />
£m<br />
Cash<br />
£m Credit Rating<br />
2009 2008<br />
Derivative<br />
assets<br />
£m<br />
Cash<br />
£m Credit Rating<br />
HSBC Bank plc 44 89 AA/A-1+ 122 97 A-1+<br />
Lloyds TSB Bank 43 – A+/A-1 89 13 A-1+<br />
Royal Bank of Scotland 3 30 A+/A-1 38 – A-1<br />
Fidelity – 25 Aaa – – –<br />
Commercial Bank of Ethiopia – 13 n/a – 15 n/a<br />
No credit limits were exceeded during the reporting period and management does not expect any losses from non-performance by<br />
these counterparties.<br />
At 31 December 2009, total derivative asset balances included £90m which was held with three counterparties and total cash balances<br />
included £157m which was held with four counterparties. Total cash balances of £381m include cash in the Group’s regional pooling<br />
arrangements which are offset against borrowings for interest purposes. Netting of cash and overdraft balances in the consolidated<br />
statement of financial position only occurs to the extent that there is the legal ability and intention to settle net. As such, overdrafts are<br />
presented in current liabilities to the extent that there is no intention to offset with the cash balance.<br />
Concentration of credit risk with respect to trade receivables is very limited due to the Group’s broad customer base. Trade receivables<br />
include amounts due from a number of finance houses in respect of vehicles sold to customers on finance arranged through the<br />
Group. An independent credit rating agency is used to assess the credit standing of each finance house. Limits for the maximum<br />
outstanding with each finance house are set accordingly. Title to the vehicles sold on finance resides with the Group until cleared funds<br />
are received from the finance house in respect of a given vehicle.<br />
www.inchcape.com 123
Financial statements<br />
Notes to the accounts continued<br />
23 Financial instruments continued<br />
f. Liquidity risk<br />
Prudent liquidity risk management implies maintaining sufficient cash and marketable securities, the availability of funding through<br />
an adequate amount of committed credit facilities and the ability to close out market positions. Due to the dynamic nature of the<br />
underlying businesses, Group Treasury aims to maintain flexibility in funding by keeping committed credit lines available. Refer to<br />
the Financial Review on page 39, for discussion of liquidity risks to the Group.<br />
The table below summarises the maturity profile of the Group’s financial assets and liabilities at 31 December 2009 based on expected<br />
undiscounted cash flows:<br />
2009<br />
Less than<br />
3 months<br />
£m<br />
Between<br />
3 to 12 months<br />
£m<br />
Between<br />
1 to 5 years<br />
£m<br />
More than<br />
5 years<br />
£m<br />
Financial assets<br />
Cash and cash equivalents 381.3 – – – 381.3<br />
Trade and other receivables 231.9 11.7 1.2 0.5 245.3<br />
Available for sale financial assets 0.4 0.4 6.0 11.8 18.6<br />
Derivative financial instruments 6.3 18.5 73.6 382.9 481.3<br />
Total<br />
£m<br />
619.9 30.6 80.8 395.2 1,126.5<br />
Financial liabilities<br />
Interest bearing loans and borrowings (126.8) (57.0) (75.7) (358.8) (618.3)<br />
Trade and other payables (692.0) (148.7) (48.4) – (889.1)<br />
Derivative financial instruments (20.2) (7.2) (22.2) (283.9) (333.5)<br />
(839.0) (212.9) (146.3) (642.7) (1,840.9)<br />
Net outflows (219.1) (182.3) (65.5) (247.5) (714.4)<br />
2008<br />
Less than<br />
3 months<br />
£m<br />
Between<br />
3 to 12 months<br />
£m<br />
Between<br />
1 to 5 years<br />
£m<br />
More than<br />
5 years<br />
£m<br />
Financial assets<br />
Cash and cash equivalents 458.0 – – – 458.0<br />
Trade and other receivables 219.4 28.2 4.8 0.4 252.8<br />
Available for sale financial assets 0.3 1.8 4.1 13.7 19.9<br />
Derivative financial instruments 310.0 319.2 78.9 415.7 1,123.8<br />
987.7 349.2 87.8 429.8 1,854.5<br />
Financial liabilities<br />
Interest bearing loans and borrowings (148.1) (45.7) (500.4) (544.4) (1,238.6)<br />
Trade and other payables (794.9) (231.2) (52.9) (0.1) (1,079.1)<br />
Derivative financial instruments (262.1) (220.0) (48.5) (291.9) (822.5)<br />
(1,205.1) (496.9) (601.8) (836.4) (3,140.2)<br />
Net outflows (217.4) (147.7) (514.0) (406.6) (1,285.7)<br />
Total<br />
£m<br />
124<br />
<strong>Inchcape</strong> plc ¦ <strong>Annual</strong> <strong>Report</strong> and Accounts 2009
Section<br />
Three<br />
Financial<br />
statements<br />
23 Financial instruments continued<br />
g. Hedging activities<br />
Effective 1 January 2009, the Group adopted the amendment to IFRS 7 for financial instruments that are measured in the consolidated<br />
statement of financial position at fair value. This requires disclosure of fair value measurements by level for the following fair value<br />
measurement hierarchy:<br />
• quoted prices in active markets (level 1);<br />
• inputs other than quoted prices that are observable for the asset or liability, either directly or indirectly (level 2); or<br />
• inputs for the asset or liability that are not based on observable market data (level 3).<br />
The following table presents the Group’s assets and liabilities that are measured at fair value:<br />
2009<br />
Assets<br />
Derivatives used for hedging – 91.0 91.0<br />
Available for sale financial assets 18.5 – 18.5<br />
18.5 91.0 109.5<br />
Liabilities<br />
Derivatives used for hedging – 21.8 21.8<br />
Level 1 represents the fair value of financial instruments that are traded in active markets and is based on quoted markets prices at the<br />
end of the reporting period.<br />
The fair value of financial instruments that are not traded in an active market (level 2) is determined by using valuation techniques<br />
which include the present value of estimated future cash flows. These valuation techniques maximise the use of observable market<br />
data where it is available and rely as little as possible on entity specific estimates.<br />
Derivative financial instruments are carried at their fair values. The fair value of forward foreign exchange contracts and foreign<br />
exchange swaps represents the difference between the value of the outstanding contracts at their contracted rates and a valuation<br />
calculated using the spot rates of exchange prevailing at 31 December 2009.<br />
The Group’s derivative financial instruments comprise the following:<br />
2009<br />
£m<br />
Level 1<br />
£m<br />
Assets<br />
2008<br />
£m<br />
Level 2<br />
£m<br />
2009<br />
£m<br />
Total<br />
£m<br />
Liabilities<br />
2008<br />
£m<br />
Cross currency interest rate swap 84.7 155.6 – –<br />
Forward foreign exchange contracts 6.3 151.3 (21.8) –<br />
91.0 306.9 (21.8) –<br />
The ineffective portion recognised in the consolidated income statement that arises from fair value hedges amounts to a gain of £0.9m<br />
(2008 – a gain of £2.8m). The ineffective portion recognised in the consolidated income statement that arises from cash flow hedges<br />
amounts to a gain of £0.6m (2008 – £0.4m). There was no ineffectiveness to be recorded from hedges of net investments.<br />
www.inchcape.com 125
Financial statements<br />
Notes to the accounts continued<br />
23 Financial instruments continued<br />
Cash flow hedges<br />
The Group principally uses forward foreign exchange contracts to hedge purchases in a non-functional currency against movements<br />
in exchange rates. The cash flows relating to these contracts are generally expected to occur within 12 months of the end of the<br />
reporting period.<br />
The nominal principal amounts of the outstanding forward foreign exchange contracts relating to transactional exposures at<br />
31 December 2009 was £587.3m (2008 – £464.7m).<br />
Net fair value gains and losses recognised in the hedging reserve in shareholders’ equity (see note 25) on forward foreign exchange<br />
contracts as at 31 December 2009 are expected to be released to the consolidated income statement within 12 months of the end<br />
of the reporting period.<br />
Fair value hedge<br />
At 31 December 2009, the Group had in place five cross currency interest rate swaps. Four of these total US$475m which hedge<br />
changes in the fair value of the Group’s 10 and 12 year loan notes. Under these swaps the Group receives fixed rate US dollar interest<br />
of 5.94% on US$275m and 6.04% on US$200m and pays LIBOR +85bps and LIBOR +90bps for the 10 and 12 year notes respectively.<br />
An additional US$39.2m cross currency interest rate swap was put in place following the US$114.2m repayment of the Private Placement<br />
in order to offset the required portion of the original US$475m swaps. Under the new swap the Group pays US dollar interest of 6.04%<br />
on US$39.2m and receives LIBOR +214bps for the 12 year notes only. The loan notes and cross currency interest rate swaps have the<br />
same critical terms.<br />
Hedge of net investment in foreign operations<br />
Further to the US$114.2m repayment of the Private Placement during the year, US$75m was de-designated as a hedge of the net<br />
investments in Hong Kong, Saipan and Guam which was being used to hedge the Group’s exposure to foreign exchange risk on<br />
these investments. Gains or losses on the retranslation of this borrowing were transferred to equity, up until the point when the debt<br />
was repaid, to offset any gains or losses on translation of net investments in the subsidiaries.<br />
h. Capital management<br />
The primary objective of the Group’s management of debt and equity is to ensure that it maintains a strong credit rating and healthy<br />
capital ratios in order to support its business and maximise shareholder value.<br />
The Group manages its capital structure and makes adjustments to it in light of changes in economic conditions. To maintain or adjust<br />
the capital structure, the Group may adjust the dividend payment to shareholders, return capital to shareholders or issue new shares.<br />
During the year, the Group issued 4,143,316,500 new ordinary shares of 1p each by way of 9 for 1 Rights Issue (see note 24).<br />
The committed bank facilities and Private Placement borrowings are subject to the same interest cover covenant based on an adjusted<br />
EBITA measure to interest on consolidated borrowings. The Group is required to maintain a ratio of not less than three to one and was<br />
compliant with this covenant throughout the year.<br />
The Group monitors group leverage by reference to three tests: Adjusted EBITA interest cover, the ratio of net debt to EBITDA and the<br />
ratio of net debt to market capitalisation.<br />
2009 2008<br />
Adjusted EBITA interest cover (times)* 14.0 8.0<br />
Net debt to EBITDA (times)** n/a 1.4<br />
Net debt / market capitalisation (percentage)*** n/a 227.7%<br />
* Calculated as Adjusted EBITA / interest on consolidated borrowings<br />
** Calculated as net debt / earnings before exceptional items, interest, tax, depreciation and amortisation<br />
*** Calculated as net debt / market capitalisation as at 31 December<br />
126<br />
<strong>Inchcape</strong> plc ¦ <strong>Annual</strong> <strong>Report</strong> and Accounts 2009
Section<br />
Three<br />
Financial<br />
statements<br />
24 Share capital<br />
a. Authorised Number of shares Ordinary share capital<br />
2009<br />
Number<br />
2008<br />
Number<br />
Ordinary share capital at 1.0p per share (2008 – 25.0p per share) 7,956,141,456 786,000,000 79.6 196.5<br />
Deferred share capital at 24.0p per share 487,244,106 – 116.9 –<br />
8,443,385,562 786,000,000 196.5 196.5<br />
2009<br />
£m<br />
2008<br />
£m<br />
b. Allotted, called up and fully paid up<br />
2009<br />
Number<br />
2008<br />
Number<br />
Ordinary shares<br />
At 1 January 487,244,106 486,188,977 121.9 121.6<br />
Share capital re-organisation – – (116.9) –<br />
Allotted under share option schemes 154,368 1,055,129 – 0.3<br />
Rights Issue 4,143,316,500 – 41.4 –<br />
At 31 December 4,630,714,974 487,244,106 46.4 121.9<br />
2009<br />
£m<br />
2008<br />
£m<br />
Deferred shares<br />
At 1 January – – – –<br />
Share capital re-organisation 487,244,106 – 116.9 –<br />
At 31 December 487,244,106 – 116.9 –<br />
163.3 121.9<br />
c. Rights Issue<br />
On 23 April 2009, 4,143,316,500 new ordinary shares of 1p each were issued by way of a 9 for 1 Rights Issue. The issue raised £234.3m<br />
net of issue costs of £14.3m. The structure utilised to facilitate the Rights Issue attracted merger relief under Section 131 of the Companies<br />
Act 1985 and as a result the excess of the net proceeds over the nominal value of the shares issued was initially recorded as a merger<br />
reserve. Subsequent internal transactions required to complete the Rights Issue resulted in the excess of £192.9m being transferred to<br />
retained earnings and is available for distribution to shareholders.<br />
Prior to the Rights Issue, the nominal value of 25p of each existing ordinary share exceeded the proposed issue price of 6p of each<br />
new ordinary share. As it was not possible for the Company to issue shares at less than their nominal value, the existing shares were<br />
subdivided into one new ordinary share of 1p and one deferred share of 24p.<br />
The rights attached to the deferred shares, which are not listed, are limited. Holders of deferred shares have no voting, dividend or<br />
capital distribution rights, save for very limited rights on a winding up. It is intended that they will be cancelled and an appropriate<br />
reserve created in due course.<br />
d. Share buy back programme<br />
At 31 December 2009, the Company held 26,875,606 treasury shares (2008 – 26,875,606) with a total book value of £99.4m (2008 –<br />
£99.4m). These shares may either be cancelled or used to satisfy share options at a later date. The Group did not repurchase any of its<br />
own shares during the period ended 31 December 2009 (2008 – 4,460,000 shares were purchased on the London Stock Exchange). In<br />
2008, the total consideration paid was £16.0m and this was deducted from the Retained earnings reserve. The shares repurchased in<br />
2008 equated to 0.9% of the issued share capital.<br />
e. Substantial shareholdings<br />
Details of substantial interests in the Company’s issued ordinary share capital received by the Company at 9 March 2010 under the<br />
provisions of the Companies Act 2006 have been disclosed in the significant shareholdings section of the Corporate Governance report.<br />
www.inchcape.com 127
Financial statements<br />
Notes to the accounts continued<br />
24 Share capital continued<br />
f. Share options<br />
At 31 December 2009, options to acquire ordinary shares of 1.0p each in the Company up to the following numbers under the schemes<br />
below were outstanding as follows:<br />
Number of ordinary<br />
shares of 1.0p each Exercisable until Option price<br />
The <strong>Inchcape</strong> 1999 Share Option Plan<br />
Number of ordinary<br />
shares of 1.0p each Exercisable until Option price<br />
The <strong>Inchcape</strong> SAYE Share Option Scheme<br />
– approved (Part II – UK) – approved<br />
51,894 17 March 2012 19.25p 41,357 1 December 2009 58.21p<br />
46,698 19 March 2013 21.40p 438,554 1 May 2010 62.03p<br />
173,482 31 August 2013 34.59p 349,600 1 December 2010 74.34p<br />
498,563 20 May 2014 44.17p 734,262 1 May 2011 64.56p<br />
160,203 29 September 2014 43.69p 676,708 1 December 2011 53.10p<br />
648,711 6 March 2015 57.76p 1,584,426 1 May 2012 34.22p<br />
215,233 11 September 2015 60.34p 31,891,360 1 December 2012 23.00p<br />
853,370 12 April 2017 97.26p<br />
1,752,080 03 April 2018 72.14p<br />
69,786 31 July 2018 42.99p<br />
9,313,123 19 May 2019 20.00p<br />
93,750 22 November 2019 32.00p<br />
– unapproved (Part I – UK)<br />
86,705 31 August 2013 34.59p<br />
839,180 20 May 2014 44.17p<br />
22,886 29 September 2014 43.69p<br />
1,621,733 6 March 2015 57.76p<br />
2,187,275 11 September 2015 60.34p<br />
6,486,673 12 April 2017 97.26p<br />
9,188,428 03 April 2018 72.14p<br />
149,047 24 April 2018 67.04p<br />
860,751 31 July 2018 42.99p<br />
39,344,558 19 May 2019 20.00p<br />
375,000 22 November 2019 32.00p<br />
– unapproved overseas (Part I – Overseas)<br />
125,288 9 August 2010 7.97p<br />
324,395 21 March 2011 10.79p<br />
441,426 17 March 2012 19.25p<br />
834,767 19 March 2013 21.40p<br />
2,948,570 20 May 2014 44.16p<br />
3,433,405 6 March 2015 57.76p<br />
3,203,099 12 April 2017 97.26p<br />
5,871,569 3 April 2018 72.14p<br />
317,124 24 April 2018 67.04p<br />
772,800 5 October 2018 32.36p<br />
35,755,186 19 May 2019 20.00p<br />
392,441 07 June 2019 18.00p<br />
Included within the retained earnings reserve are 13,797,362 (2008 – 2,315,380) own ordinary shares held by the ESOP Trust, a general<br />
discretionary trust whose beneficiaries include current and former employees of the Group and their dependants. The book value of these<br />
shares at 31 December 2009 was £2.1m (2008 – £0.9m restated for Rights Issue). The market value of these shares at 31 December 2009<br />
and at 9 March 2010 was £4.1m (31 December 2008 – £0.9m, 18 March 2009 – £1.2m).<br />
128<br />
<strong>Inchcape</strong> plc ¦ <strong>Annual</strong> <strong>Report</strong> and Accounts 2009
Section<br />
Three<br />
Financial<br />
statements<br />
25 Other reserves<br />
Available for<br />
sale reserve<br />
£m<br />
Translation<br />
reserve<br />
£m<br />
Hedging<br />
reserve<br />
£m<br />
Total other<br />
reserves<br />
£m<br />
At 1 January 2008 0.7 10.8 1.2 12.7<br />
Cash flow hedges:<br />
– Fair value movements – – 136.9 136.9<br />
– Reclassified and reported in inventories – – (25.3) (25.3)<br />
– Tax on cash flow hedges – – (33.4) (33.4)<br />
Movement on net investment hedge – (14.4) – (14.4)<br />
Movement on available for sale financial assets (1.1) – – (1.1)<br />
Foreign exchange gains recycled through the consolidated income statement – (2.1) – (2.1)<br />
Effect of foreign exchange rate changes – 199.8 – 199.8<br />
At 1 January 2009 (0.4) 194.1 79.4 273.1<br />
Cash flow hedges:<br />
– Fair value movements – – (164.6) (164.6)<br />
– Reclassified and reported in inventories – – 37.8 37.8<br />
– Tax on cash flow hedges – – 38.0 38.0<br />
Movement on net investment hedge – 2.9 – 2.9<br />
Movement on available for sale financial assets 0.4 – – 0.4<br />
Effect of foreign exchange rate changes – (75.2) – (75.2)<br />
At 31 December 2009 – 121.8 (9.4) 112.4<br />
Available for sale reserve<br />
Gains and losses on available for sale financial assets are recognised in the ‘available for sale reserve’ until the asset is sold or is<br />
considered to be impaired, at which time the cumulative gain or loss is included in the consolidated income statement.<br />
Translation reserve<br />
The translation reserve is used to record foreign exchange rate changes relating to the translation of the results of foreign subsidiaries<br />
arising after 1 January 2004. It is also used to record foreign exchange differences arising on long-term foreign currency borrowings<br />
used to finance or hedge foreign currency investments.<br />
Hedging reserve<br />
For cash flow hedges that meet the conditions for hedge accounting, the portion of the gains or losses on the hedging instrument that<br />
are determined to be an effective hedge are recognised directly in shareholders’ equity. When the hedged firm commitment results in<br />
the recognition of a non-financial asset or liability then, at the time the asset or liability is recognised, the associated gains or losses that<br />
had previously been recognised in shareholders’ equity are included in the initial measurement of the acquisition cost or other carrying<br />
amount of the asset or liability.<br />
www.inchcape.com 129
Financial statements<br />
Notes to the accounts continued<br />
26 Notes to the consolidated statement of cash flows<br />
a. Reconciliation of cash generated from operations<br />
Cash flows from operating activities<br />
Operating profit 156.8 158.0<br />
Exceptional items 18.4 82.5<br />
Amortisation including non-exceptional impairment of intangible assets 2.8 3.7<br />
Depreciation of tangible assets 32.8 27.5<br />
Profit on disposal of property, plant and equipment (2.6) (2.6)<br />
Share-based payments charge / (credit) 3.8 (0.9)<br />
Decrease / (increase) in inventories 271.8 (27.9)<br />
Decrease in trade and other receivables 0.7 65.6<br />
(Decrease) in trade and other payables (93.6) (112.8)<br />
(Decrease) / increase in provisions (2.6) 7.9<br />
Decrease in post-retirement defined benefits * (31.9) (16.2)<br />
(Increase) / decrease in interest in leased vehicles (6.5) 4.3<br />
Payment in respect of operating exceptional items (13.7) (5.8)<br />
Other items 0.5 0.4<br />
Cash generated from operations 336.7 183.7<br />
* The decrease in post-retirement defined benefits includes additional payments of £30.1m (2008 – £16.1m).<br />
b. Reconciliation of net cash flow to movement in net funds / (debt)<br />
Net (decrease) / increase in cash and cash equivalents (41.8) 61.3<br />
Net cash outflow / (inflow) from borrowings and finance leases 458.4 (274.5)<br />
Change in net cash and debt resulting from cash flows 416.6 (213.2)<br />
Effect of foreign exchange rate changes on net cash and debt (8.9) 33.7<br />
Net movement in fair value 0.9 2.8<br />
Net loans and finance leases relating to acquisitions and disposals – (17.6)<br />
Movement in net funds / (debt) 408.6 (194.3)<br />
Opening net debt (407.8) (213.5)<br />
Closing net funds / (debt) 0.8 (407.8)<br />
Net funds / (debt) is analysed as follows:<br />
Cash at bank and in hand 319.6 351.3<br />
Short-term deposits 61.7 106.7<br />
Bank overdrafts (124.1) (145.2)<br />
Cash and cash equivalents 257.2 312.8<br />
Bank loans (335.1) (858.0)<br />
Other loans (1.3) (9.2)<br />
Finance leases (4.7) (9.0)<br />
(83.9) (563.4)<br />
Fair value of cross currency interest rate swap 84.7 155.6<br />
Net funds / (debt) 0.8 (407.8)<br />
2009<br />
£m<br />
2009<br />
£m<br />
2009<br />
£m<br />
2008<br />
£m<br />
2008<br />
£m<br />
2008<br />
£m<br />
130<br />
<strong>Inchcape</strong> plc ¦ <strong>Annual</strong> <strong>Report</strong> and Accounts 2009
Section<br />
Three<br />
Financial<br />
statements<br />
27 Acquisitions and disposals<br />
a. Acquisitions<br />
In July 2008, the Group acquired 75.1% of the issued share capital of the Musa Motors group for a total cash consideration of US$240m:<br />
a US$200m initial downpayment was made in 2008; a further payment of US$35m was made in October 2009; and a final settlement<br />
of US$5m is due in 2010. The remaining 24.9% is to be acquired in early 2011, with payment dependent on 2010 EBITA, capped<br />
at US$250m.<br />
During the year, adjustments have been made to the net assets acquired of the Musa Motors group, as permitted by IFRS 3, ‘Business<br />
combinations’. These fair value adjustments were not material and therefore prior periods have not been restated. The changes<br />
to the net assets acquired were primarily due to a decrease in amounts due to suppliers and an increase in various taxes when<br />
compared to original estimates. These changes, together with revisions to amounts due in respect of the remaining contingent<br />
deferred consideration, have resulted in an increase in the amount of goodwill recognised on acquisition of £22.3m.<br />
b. Disposals<br />
During the year, the Group disposed of a small number of dealerships and operations generating disposal proceeds of £3.0m<br />
(2008 – £27.3m) and a loss on disposal of £0.7m (2008 – £1.2m) which has not been disclosed as an exceptional item.<br />
28 Guarantees and contingencies<br />
Guarantees, performance bonds and contingent liabilities 16.3 17.7<br />
Guarantees and contingencies largely comprise letters of credit issued on behalf of the Group in the ordinary course of business.<br />
The Group also has, in the ordinary course of business, commitments under foreign exchange instruments relating to the hedging<br />
of transactional exposures (see note 23).<br />
29 Commitments<br />
a. Capital commitments<br />
Contracts placed for future capital expenditure at the balance sheet date but not yet incurred are as follows:<br />
Property, plant and equipment 9.5 7.6<br />
Vehicles subject to residual value commitments * 98.6 108.5<br />
Intangible assets – 0.1<br />
* Residual value commitments comprise the total repurchase liability on all vehicles sold subject to a residual value commitment, of which £47.6m (2008 – £65.4m) has been included<br />
within ‘trade and other payables’. These commitments are largely expected to be settled within the next 12 months, with a minority to be settled within three years.<br />
2009<br />
£m<br />
2009<br />
£m<br />
2008<br />
£m<br />
2008<br />
£m<br />
www.inchcape.com 131
Financial statements<br />
Notes to the accounts continued<br />
29 Commitments continued<br />
b. Lease commitments<br />
Operating lease commitments – Group as lessee<br />
The Group has entered into non-cancellable operating leases for various offices, warehouses and dealerships. These leases have<br />
varying terms, escalation clauses and renewal rights.<br />
Future minimum lease payments under non-cancellable operating leases are as follows:<br />
Within one year 41.8 44.8<br />
Between one and five years 100.9 110.4<br />
After five years 133.3 142.7<br />
276.0 297.9<br />
Operating lease commitments – Group as lessor<br />
The Group has entered into non-cancellable operating leases on a number of its vehicles. These leases have varying terms, escalation<br />
clauses and renewal rights and are not individually significant to the Group.<br />
Future minimum lease payments receivable under non-cancellable operating leases are as follows:<br />
Within one year 3.1 5.1<br />
Between one and five years 6.2 9.5<br />
After five years 6.3 8.1<br />
15.6 22.7<br />
Finance leases and hire purchase contracts<br />
The Group has finance leases and hire purchase contracts for various items of property, plant and equipment. These leases have<br />
varying terms, escalation clauses and renewal rights. Future minimum lease payments under finance leases and hire purchase<br />
contracts, together with the present value of the net minimum lease payments (included within borrowings) are as follows:<br />
Minimum lease payments:<br />
– Within one year 1.3 4.1<br />
– Between one and five years 2.1 3.7<br />
– After five years 7.0 7.0<br />
Total minimum lease payments 10.4 14.8<br />
Less: future finance charges (5.7) (5.8)<br />
Present value of finance lease liabilities 4.7 9.0<br />
2009<br />
£m<br />
2009<br />
£m<br />
2009<br />
£m<br />
2008<br />
£m<br />
2008<br />
£m<br />
2008<br />
£m<br />
132<br />
<strong>Inchcape</strong> plc ¦ <strong>Annual</strong> <strong>Report</strong> and Accounts 2009
Section<br />
Three<br />
Financial<br />
statements<br />
30 Related party disclosures<br />
a. Principal subsidiaries and joint ventures<br />
The consolidated Financial statements include the principal subsidiaries and joint ventures listed below:<br />
Country of incorporation Shareholding Description<br />
Subsidiaries<br />
Subaru (Australia) Pty Limited Australia 90.0% Distribution<br />
Toyota Belgium NV/SA Belgium 100.0% Distribution<br />
The Motor & Engineering Company of Ethiopia Ltd S.C. Ethiopia 94.1% Distribution<br />
<strong>Inchcape</strong> Motors Finland OY Finland 100.0% Distribution<br />
Toyota Hellas SA Greece 100.0% Distribution<br />
Crown Motors Limited Hong Kong 100.0% Distribution<br />
<strong>Inchcape</strong> Olimp OOO Russia 100.0% Retail<br />
<strong>Inchcape</strong> Moscow Motors BV Netherlands 75.1% Intermediate holding company (1)<br />
Borneo Motors (Singapore) Pte Ltd Singapore 100.0% Distribution<br />
<strong>Inchcape</strong> Finance plc United Kingdom 100.0% Central treasury company<br />
<strong>Inchcape</strong> Fleet Solutions Limited United Kingdom 100.0% Financial services (2)<br />
<strong>Inchcape</strong> International Holdings Limited United Kingdom 100.0% Intermediate holding company<br />
<strong>Inchcape</strong> Retail Limited United Kingdom 100.0% Retail<br />
The Cooper Group Limited United Kingdom 100.0% Retail<br />
European Motor Holdings Limited United Kingdom 100.0% Retail<br />
<strong>Inchcape</strong> East Limited United Kingdom 100.0% Retail<br />
Joint ventures<br />
Unitfin SA Greece 60.0% Financial services<br />
Tefin SA Greece 50.0% Financial services<br />
(1)<br />
Holding company of the Musa Motors businesses in Moscow<br />
(2)<br />
Included within distribution in the business segmental analysis (see note 1)<br />
The ultimate parent company of the Group is <strong>Inchcape</strong> plc, a company incorporated and domiciled in England and Wales and listed<br />
on the London Stock Exchange.<br />
www.inchcape.com 133
Financial statements<br />
Notes to the accounts continued<br />
30 Related party disclosures continued<br />
b. Trading transactions<br />
Intra-group transactions have been eliminated on consolidation and are not disclosed in this note. Details of transactions between the<br />
Group and other related parties are disclosed below:<br />
2009<br />
£m<br />
Transactions<br />
2008<br />
£m<br />
Amounts outstanding<br />
Vehicles purchased from joint ventures and associates 48.8 60.6 5.0 2.8<br />
Vehicles sold to joint ventures and associates 308.5 429.9 0.1 1.1<br />
Other income paid to joint ventures and associates 3.8 3.6 1.3 1.8<br />
Other income received from joint ventures and associates 1.1 3.1 1.1 4.8<br />
All of the transactions arise in the ordinary course of business and are on an arm’s length basis. The amounts outstanding are<br />
unsecured and will be settled in cash. There have been no guarantees provided or received for any related party receivables.<br />
The Group has not raised any provision for doubtful debts relating to amounts owed by related parties (2008 – £nil).<br />
c. Compensation of key management personnel<br />
The remuneration of the Board of Directors and the Executive Committee was as follows:<br />
Short-term employment benefits 8.8 5.1<br />
Post-retirement benefits 1.0 1.0<br />
Share-based payments 0.9 (1.5)<br />
Compensation for loss of office 1.0 0.3<br />
11.7 4.9<br />
The remuneration of the Directors and other key management is determined by the Remuneration Committee having regard to the<br />
performance of individuals and market trends. Further details of emoluments paid to the Directors are included in the Board report<br />
on remuneration.<br />
31 Foreign currency translation<br />
The main exchange rates used for translation purposes are as follows:<br />
Average rates<br />
Year end rates<br />
2009 2008 2009 2008<br />
Australian dollar 1.99 2.19 1.80 2.06<br />
Euro 1.12 1.27 1.13 1.03<br />
Hong Kong dollar 12.11 14.56 12.52 11.14<br />
Singapore dollar 2.27 2.63 2.27 2.07<br />
2009<br />
£m<br />
2009<br />
£m<br />
2008<br />
£m<br />
2008<br />
£m<br />
134<br />
<strong>Inchcape</strong> plc ¦ <strong>Annual</strong> <strong>Report</strong> and Accounts 2009
Section<br />
Three<br />
Financial<br />
statements<br />
Five year record<br />
The information presented in the table below is prepared in accordance with IFRS, as in issue and effective at that year end date.<br />
Consolidated income statement<br />
2009<br />
£m<br />
2008<br />
£m<br />
2007<br />
£m<br />
2006<br />
£m<br />
2005<br />
£m<br />
Revenue 5,583.7 6,259.8 6,056.8 4,842.1 4,488.1<br />
Operating profit before exceptional items 175.2 240.5 265.0 213.9 189.4<br />
Exceptional items (18.4) (82.5) 4.9 – (13.0)<br />
Operating profit 156.8 158.0 269.9 213.9 176.4<br />
Share of profit after tax of joint ventures and associates 0.7 2.2 3.5 5.9 6.2<br />
Profit before finance and tax 157.5 160.2 273.4 219.8 182.6<br />
Net finance costs (20.8) (52.0) (33.4) (5.9) (5.3)<br />
Profit before tax 136.7 108.2 240.0 213.9 177.3<br />
Tax before exceptional tax (43.5) (49.3) (57.9) (45.1) (46.9)<br />
Exceptional tax 1.8 (3.6) – 8.0 –<br />
Profit after tax 95.0 55.3 182.1 176.8 130.4<br />
Minority interests (3.0) (3.9) (5.7) (2.9) (3.8)<br />
Profit for the year 92.0 51.4 176.4 173.9 126.6<br />
Basic:<br />
– Profit before tax 136.7 108.2 240.0 213.9 177.3<br />
– Earnings per share (pence)* 2.3p 1.9p 6.4p 6.3p 4.6p<br />
Adjusted (before exceptional items):<br />
– Profit before tax 155.1 190.7 235.1 213.9 190.3<br />
– Earnings per share (pence)* 2.7p 5.0p 6.2p 6.0p 5.0p<br />
Dividends per share – interim paid and final proposed (pence) – 5.5p 15.8p 15.0p 9.5p<br />
Consolidated statement of financial position<br />
Non-current assets 1,306.1 1,372.1 1,037.0 666.0 521.7<br />
Other assets less (liabilities) excluding cash (borrowings) (217.2) 55.3 14.3 4.0 (88.5)<br />
1,088.9 1,427.4 1,051.3 670.0 433.2<br />
Net funds / (debt) 0.8 (407.8) (213.5) (19.0) 158.0<br />
Net assets 1,089.7 1,019.6 837.8 651.0 591.2<br />
Equity attributable to owners of the parent 1,067.7 995.5 813.6 643.8 581.7<br />
Minority interests 22.0 24.1 24.2 7.2 9.5<br />
Total shareholders’ equity 1,089.7 1,019.6 837.8 651.0 591.2<br />
* Earnings per share have been restated to reflect the bonus element of the Rights Issue.<br />
www.inchcape.com<br />
135
Financial statements<br />
<strong>Report</strong> of the Auditors<br />
We have audited the Group Financial statements of <strong>Inchcape</strong> plc for<br />
the year ended 31 December 2009 which comprise the consolidated<br />
income statement, the consolidated statement of comprehensive<br />
income, the consolidated statement of financial position,<br />
consolidated statement of changes in equity, the consolidated<br />
statement of cash flows, the accounting policies and the related<br />
notes. The financial reporting framework that has been applied in<br />
their preparation is applicable law and International Financial<br />
<strong>Report</strong>ing Standards (IFRSs) as adopted by the European Union.<br />
Respective responsibilities of Directors and auditors<br />
As explained more fully in the statement of the Directors’<br />
responsibilities, the Directors are responsible for the preparation<br />
of the Group Financial statements and for being satisfied that<br />
they give a true and fair view. Our responsibility is to audit the<br />
Group Financial statements in accordance with applicable<br />
law and International Standards on Auditing (UK and Ireland).<br />
Those standards require us to comply with the Auditing Practices<br />
Board’s Ethical Standards for Auditors.<br />
This report, including the opinions, has been prepared for and<br />
only for the Company’s members as a body in accordance with<br />
Chapter 3 of Part 16 of the Companies Act 2006 and for no other<br />
purpose. We do not, in giving these opinions, accept or assume<br />
responsibility for any other purpose or to any other person to<br />
whom this report is shown or into whose hands it may come<br />
save where expressly agreed by our prior consent in writing.<br />
Scope of the audit of the Financial statements<br />
An audit involves obtaining evidence about the amounts<br />
and disclosures in the Financial statements sufficient to give<br />
reasonable assurance that the Financial statements are free<br />
from material misstatement, whether caused by fraud or error.<br />
This includes an assessment of: whether the accounting<br />
policies are appropriate to the Group’s circumstances and<br />
have been consistently applied and adequately disclosed; the<br />
reasonableness of significant accounting estimates made by the<br />
Directors; and the overall presentation of the Financial statements.<br />
Matters on which we are required to report by exception<br />
We have nothing to report in respect of the following matters<br />
where the Companies Act 2006 requires us to report to you if,<br />
in our opinion:<br />
• certain disclosures of Directors’ remuneration specified by law<br />
are not made; or<br />
• we have not received all the information and explanations we<br />
require for our audit; or<br />
• a corporate governance statement has not been prepared<br />
by the parent Company.<br />
Under the Listing Rules we are required to review:<br />
• the Directors’ statement, in relation to going concern; and<br />
• the part of the corporate governance statement relating to<br />
the Company’s compliance with the nine provisions of the<br />
June 2008 Combined Code specified for our review.<br />
Other matter<br />
We have reported separately on the parent Company Financial<br />
statements of <strong>Inchcape</strong> plc for the year ended 31 December 2009<br />
and on the information in the Directors’ remuneration report that<br />
is described as having been audited.<br />
Paul Cragg<br />
(Senior Statutory Auditor)<br />
for and on behalf of PricewaterhouseCoopers LLP<br />
Chartered Accountants and Statutory Auditors<br />
London<br />
9 March 2010<br />
Opinion on Financial statements<br />
In our opinion the Group Financial statements:<br />
• give a true and fair view of the state of the Group’s affairs as at<br />
31 December 2009 and of its profit and cash flows for the year<br />
then ended;<br />
• have been properly prepared in accordance with IFRSs as<br />
adopted by the European Union; and<br />
• have been prepared in accordance with the requirements of<br />
the Companies Act 2006 and Article 4 of the lAS Regulation.<br />
Opinion on other matters prescribed by the Companies Act 2006<br />
In our opinion:<br />
• the information given in the Directors’ report for the financial<br />
year for which the Group Financial statements are prepared<br />
is consistent with the Group Financial statements; and<br />
• the information given in the corporate governance statement<br />
with respect to internal control and risk management systems<br />
and about share capital structures is consistent with the<br />
Financial statements.<br />
136<br />
<strong>Inchcape</strong> plc ¦ <strong>Annual</strong> <strong>Report</strong> and Accounts 2009
Section<br />
Three<br />
Financial<br />
statements<br />
Company balance sheet<br />
As at 31 December 2009<br />
Fixed assets<br />
Investment in subsidiaries 3 1,603.3 1,870.9<br />
Current assets<br />
Debtors:<br />
– Amounts due within one year 4 299.8 233.1<br />
– Amounts due after more than one year 4 742.1 153.0<br />
Cash at bank and in hand 5 0.9 14.4<br />
1,042.8 400.5<br />
Notes<br />
2009<br />
£m<br />
2008<br />
£m<br />
Creditors – amounts falling due within one year 6 (3.3) (25.7)<br />
Net current assets 1,039.5 374.8<br />
Total assets less current liabilities 2,642.8 2,245.7<br />
Creditors – amounts falling due after more than one year 7 (1,923.2) (1,712.6)<br />
Provisions for liabilities and charges 9 (8.1) (9.5)<br />
Net assets 711.5 523.6<br />
Capital and reserves<br />
Share capital 11, 13 163.3 121.9<br />
Share premium 13 126.1 126.1<br />
Capital redemption reserve 13 16.4 16.4<br />
Profit and loss account 13 405.7 259.2<br />
Total shareholders’ funds 711.5 523.6<br />
The Financial statements on pages 137 to 143 were approved by the Board of Directors on 9 March 2010 and were signed on its behalf by:<br />
André Lacroix, Chief Executive Officer<br />
John McConnell, Group Finance Director<br />
www.inchcape.com<br />
137
Financial statements<br />
Accounting policies<br />
Basis of preparation<br />
These Financial statements are prepared for <strong>Inchcape</strong> plc (the Company) for the year ended 31 December 2009. The Company<br />
is the ultimate parent entity of the <strong>Inchcape</strong> Group (the Group).<br />
Accounting convention<br />
These Financial statements have been prepared on the historical cost basis in accordance with the Companies Act 2006 and<br />
applicable UK accounting standards. As permitted by Section 408 of the Companies Act 2006, no separate profit and loss account<br />
is presented for the Company. In addition, the Company is not required to prepare a cash flow statement under the terms of<br />
FRS 1 – Cash Flow Statements (revised).<br />
Going concern<br />
In determining whether the Company is a going concern, the Directors have reviewed the Company’s projections, available facilities<br />
and covenant compliance and expect that the Company will continue in operational existence for the foreseeable future.<br />
Accordingly, the Company continues to adopt the going concern basis in preparing the Financial statements.<br />
Foreign currencies<br />
Assets and liabilities in foreign currencies are translated into Sterling at closing rates of exchange and are taken to the profit and loss<br />
account.<br />
Investments<br />
Investments in subsidiaries are stated at cost, less provisions for impairment.<br />
Deferred tax<br />
Deferred tax is provided in full (without discounting) based on current tax rates and law, on timing differences that result in an obligation<br />
at the balance sheet date to pay more tax, or a right to pay less tax in the future except as otherwise required by FRS 19 – Deferred Tax.<br />
Deferred tax is not provided on timing differences arising from the revaluation of fixed assets where there is no binding commitment to<br />
sell the asset.<br />
Provisions<br />
Provisions are recognised when the Company has a present obligation in respect of a past event, it is more likely than not that an<br />
outflow of resources will be required to settle the obligation and where the amount can be reliably estimated. Provisions are discounted<br />
when the time value of money is considered material.<br />
Share capital<br />
Ordinary shares are classified as equity.<br />
Where the Company purchases its own equity share capital (treasury shares), the consideration paid is deducted from shareholders’<br />
funds until the shares are cancelled, reissued or disposed of. Where such shares are subsequently sold or reissued, any consideration<br />
received is included in shareholders’ funds.<br />
Dividends<br />
Final dividends proposed by the Board of Directors and unpaid at the year end are not recognised in the Financial statements until<br />
they have been approved by the shareholders at the <strong>Annual</strong> General Meeting. Interim dividends are recognised when they are paid.<br />
Share-based payments<br />
The Company operates various share-based award schemes. The fair value at the date at which the share-based awards are granted<br />
is recognised in the profit and loss account (together with a corresponding increase in shareholders’ equity) on a straight line basis over<br />
the vesting period, based on an estimate of the number of shares that will eventually vest. For equity settled share-based awards, the<br />
services received from employees are measured by reference to the fair value of the awards granted. With the exception of the ‘Save<br />
as you earn’ scheme, the vesting of all share-based awards under all schemes is solely reliant upon non-market conditions therefore<br />
no expense is recognised for awards that do not ultimately vest. Where an employee cancels a ‘Save as you earn’ award, the charge<br />
for that award is recognised as an expense immediately, even though the award does not vest. In accordance with the transitional<br />
provisions of FRS 20 – Share-based payment, no charge had been recognised for grants of equity instruments made before 7 November<br />
2002. The Company adopts Amendments to FRS 20 in line with the Group’s adoption of Amendments to IFRS 2.<br />
Financial instruments<br />
The adoption by the Company of FRS 29 ‘Financial Instruments: Disclosures’ has had no impact as the Company has taken advantage<br />
of the exemption not to apply FRS 29 in its own Financial statements. The Group’s policies on the recognition, measurement and<br />
presentation of financial instruments under IFRS 7 are set out in the Group’s accounting policies on pages 83 to 89.<br />
138<br />
<strong>Inchcape</strong> plc ¦ <strong>Annual</strong> <strong>Report</strong> and Accounts 2009
Section<br />
Three<br />
Financial<br />
statements<br />
Notes to the accounts<br />
1 Auditors’ remuneration<br />
The Company incurred £0.1m (2008 – £0.1m) in relation to UK statutory audit fees for the year ended 31 December 2009.<br />
2 Directors’ remuneration<br />
Wages and salaries 2.7 1.2<br />
Social security costs 0.3 0.2<br />
Pension costs 0.4 0.4<br />
Compensation for loss of office 0.6 –<br />
Other employment costs – (0.9)<br />
4.0 0.9<br />
Further information on Executive Directors’ emoluments and interests is given in the Board report on remuneration which can be found<br />
on pages 68 to 74 in the Group’s Financial statements for the year ended 31 December 2009.<br />
3 Investment in subsidiaries<br />
Cost<br />
At 1 January 1,912.3 1,868.3<br />
Additions 248.6 56.1<br />
Disposals (528.7) (12.1)<br />
At 31 December 1,632.2 1,912.3<br />
Provisions<br />
At 1 January (41.4) (21.0)<br />
Provisions for impairment (4.8) (32.1)<br />
Reversal of provision for impairment 17.3 11.7<br />
At 31 December (28.9) (41.4)<br />
Net book value 1,603.3 1,870.9<br />
On 23 April 2009, the Company raised £248.6m (before issue costs) by way of a Rights Issue (see note 11). The structure used to<br />
facilitate this resulted in the Company acquiring redeemable preference shares in a subsidiary company in exchange for ordinary<br />
shares in the Company with a value of £248.6m. The redeemable preference shares were subsequently redeemed by the subsidiary<br />
company for a cash consideration of £248.6m.<br />
On 31 December 2009 the Company disposed of its investment in European Motor Holdings Limited to a subsidiary company, <strong>Inchcape</strong><br />
International Holdings Limited, for book value.<br />
4 Debtors<br />
Amounts due within one year<br />
Other debtors – 1.9<br />
Amounts owed by Group undertakings 299.8 231.2<br />
299.8 233.1<br />
Amounts due after more than one year<br />
Deferred tax asset (note 8) 2.5 1.5<br />
Amounts owed by Group undertakings 739.6 151.5<br />
742.1 153.0<br />
Amounts owed by Group undertakings bear interest at rates linked to LIBOR.<br />
5 Cash at bank and in hand<br />
Cash at bank and in hand 0.9 14.4<br />
2009<br />
£m<br />
2009<br />
£m<br />
2009<br />
£m<br />
2009<br />
£m<br />
2008<br />
£m<br />
2008<br />
£m<br />
2008<br />
£m<br />
2008<br />
£m<br />
www.inchcape.com<br />
139
Financial statements<br />
Notes to the accounts continued<br />
6 Creditors – amounts falling due within one year<br />
Amounts owed to Group undertakings 0.2 20.1<br />
Other taxation and social security payable 0.3 0.1<br />
Other creditors 2.8 5.5<br />
7 Creditors – amounts falling due after more than one year<br />
2009<br />
£m<br />
2008<br />
£m<br />
3.3 25.7<br />
Amounts owed to Group undertakings 1,652.2 1,330.0<br />
Private Placement 270.2 381.4<br />
Other loans 0.8 1.2<br />
2009<br />
£m<br />
2008<br />
£m<br />
1,923.2 1,712.6<br />
During 2009 US$114.2m of the US$550m Private Placement was repaid, leaving US$235.8m repayable in 2017 which bears interest at<br />
a fixed rate of 5.94% per annum and US$200m repayable in 2019 which bears interest at a fixed rate of 6.04% per annum.<br />
Other loans are loan notes issued in connection with the acquisition of European Motor Holdings plc and bear interest at rates linked<br />
to LIBOR.<br />
Amounts owed to Group undertakings bear interest at rates linked to LIBOR.<br />
8 Deferred tax<br />
Sharebased<br />
payments<br />
£m<br />
Other timing<br />
differences<br />
£m<br />
At 1 January 2009 0.1 1.4 1.5<br />
(Charged) / credited to the profit and loss account (0.3) 1.2 0.9<br />
Credited to the profit and loss account reserve 0.1 – 0.1<br />
At 31 December 2009 (0.1) 2.6 2.5<br />
9 Provisions for liabilities and charges<br />
At 1 January 9.5 8.5<br />
Released to the profit and loss account (1.4) 1.0<br />
At 31 December 8.1 9.5<br />
Provision has been made for warranties, indemnities and other litigation issues in relation to motors and non-motors business exits,<br />
based on expected outcomes. These provisions are expected to be settled within the next three to five years.<br />
10 Guarantees and contingencies<br />
Guarantees of various subsidiaries’ borrowings<br />
(against which £35.0m has been drawn at 31 December 2009, 2008 – £405.0m) 535.0 535.0<br />
The Company is party to composite cross guarantees between banks and its subsidiaries. The Company’s contingent liability under<br />
these guarantees at 31 December 2009 was £199.8m (2008 – £178.4m).<br />
11 Share capital<br />
a. Authorised Number of shares Ordinary share capital<br />
2009<br />
Number<br />
2008<br />
Number<br />
Ordinary share capital at 1.0p per share (2008 – 25.0p per share) 7,956,141,456 786,000,000 79.6 196.5<br />
Deferred share capital at 24.0p per share 487,244,106 – 116.9 –<br />
8,443,385,562 786,000,000 196.5 196.5<br />
2009<br />
£m<br />
2009<br />
£m<br />
2009<br />
£m<br />
Total<br />
£m<br />
2008<br />
£m<br />
2008<br />
£m<br />
2008<br />
£m<br />
140<br />
<strong>Inchcape</strong> plc ¦ <strong>Annual</strong> <strong>Report</strong> and Accounts 2009
Section<br />
Three<br />
Financial<br />
statements<br />
11 Share capital continued<br />
b. Allotted, called up and fully paid up Number of shares Ordinary share capital<br />
2009<br />
Number<br />
2008<br />
Number<br />
Ordinary shares<br />
At 1 January 487,244,106 486,188,977 121.9 121.6<br />
Share capital re-organisation – – (116.9) –<br />
Allotted under share option schemes 154,368 1,055,129 – 0.3<br />
Rights Issue 4,143,316,500 – 41.4 –<br />
At 31 December 4,630,714,974 487,244,106 46.4 121.9<br />
2009<br />
£m<br />
2008<br />
£m<br />
Deferred shares<br />
At 1 January – – – –<br />
Share capital re-organisation 487,244,106 – 116.9 –<br />
At 31 December 487,244,106 – 116.9 –<br />
163.3 121.9<br />
c. Rights Issue<br />
On 23 April 2009, 4,143,316,500 new ordinary shares of 1p each were issued by way of a 9 for 1 Rights Issue. The issue raised £234.3m<br />
net of issue costs of £14.3m. The structure utilised to facilitate the Rights Issue attracted merger relief under Section 131 of the Companies<br />
Act 1985 and as a result the excess of the net proceeds over the nominal value of the shares issued was initially recorded as a merger<br />
reserve. Subsequent internal transactions required to complete the Rights Issue resulted in the excess of £192.9m being transferred to<br />
retained earnings and is available for distribution to shareholders.<br />
Prior to the Rights Issue, the nominal value of 25p of each existing ordinary share exceeded the proposed issue price of 6p of each<br />
new ordinary share. As it was not possible for the Company to issue shares at less than their nominal value, the existing shares were<br />
subdivided into one new ordinary share of 1p and one deferred share of 24p.<br />
The rights attached to the deferred shares, which are not listed, are limited. Holders of deferred shares have no voting, dividend or<br />
capital distribution rights, save for very limited rights on a winding up. It is intended that they will be cancelled and an appropriate<br />
reserve created in due course.<br />
d. Share buy back programme<br />
At 31 December 2009, the Company held 26,875,606 treasury shares (2008 – 26,875,606) with a total book value of £99.4m<br />
(2008 – £99.4m). These shares may either be cancelled or used to satisfy share options at a later date.<br />
The Group did not repurchase any of its own shares during the period ended 31 December 2009 (2008 – 4,460,000 shares were<br />
purchased on the London Stock Exchange). In 2008, the total consideration paid was £16.0m and this was deducted from the<br />
Retained earnings reserve (note 13). The shares repurchased in 2008 equated to 0.9% of the issued share capital.<br />
e. Substantial shareholdings<br />
Details of substantial interests in the Company’s issued ordinary share capital received by the Company at 9 March 2010 under the<br />
provisions of the Companies Act 2006 have been disclosed in the significant shareholdings section of the Corporate governance report.<br />
www.inchcape.com 141
Financial statements<br />
Notes to the accounts continued<br />
11 Share capital continued<br />
f. Share options<br />
At 31 December 2009, options to acquire ordinary shares of 1.0p each in the Company up to the following numbers under the schemes<br />
below were outstanding as follows:<br />
Number of ordinary<br />
shares of 1.0p each<br />
Exercisable until<br />
Option<br />
price<br />
Number of ordinary<br />
shares of 1.0p each<br />
Exercisable until<br />
Option<br />
price<br />
The <strong>Inchcape</strong> 1999 Share Option Plan – approved (Part II – UK) The <strong>Inchcape</strong> SAYE Share Option Scheme – approved<br />
51,894 17 March 2012 19.25p 41,357 1 December 2009 58.21p<br />
46,698 19 March 2013 21.40p 438,554 1 May 2010 62.03p<br />
173,482 31 August 2013 34.59p 349,600 1 December 2010 74.34p<br />
498,563 20 May 2014 44.17p 734,262 1 May 2011 64.56p<br />
160,203 29 September 2014 43.69p 676,708 1 December 2011 53.10p<br />
648,711 6 March 2015 57.76p 1,584,426 1 May 2012 34.22p<br />
215,233 11 September 2015 60.34p 31,891,360 1 December 2012 23.00p<br />
853,370 12 April 2017 97.26p<br />
1,752,080 03 April 2018 72.14p<br />
69,786 31 July 2018 42.99p<br />
9,313,123 19 May 2019 20.00p<br />
93,750 22 November 2019 32.00p<br />
– unapproved (Part I – UK)<br />
86,705 31 August 2013 34.59p<br />
839,180 20 May 2014 44.17p<br />
22,886 29 September 2014 43.69p<br />
1,621,733 6 March 2015 57.76p<br />
2,187,275 11 September 2015 60.34p<br />
6,486,673 12 April 2017 97.26p<br />
9,188,428 03 April 2018 72.14p<br />
149,047 24 April 2018 67.04p<br />
860,751 31 July 2018 42.99p<br />
39,344,558 19 May 2019 20.00p<br />
375,000 22 November 2019 32.00p<br />
– unapproved overseas (Part I – Overseas)<br />
125,288 9 August 2010 7.97p<br />
324,395 21 March 2011 10.79p<br />
441,426 17 March 2012 19.25p<br />
834,767 19 March 2013 21.40p<br />
2,948,570 20 May 2014 44.16p<br />
3,433,405 6 March 2015 57.76p<br />
3,203,099 12 April 2017 97.26p<br />
5,871,569 3 April 2018 72.14p<br />
317,124 24 April 2018 67.04p<br />
772,800 5 October 2018 32.36p<br />
35,755,186 19 May 2019 20.00p<br />
392,441 07 June 2019 18.00p<br />
Included within the Retained earnings reserve are 13,797,362 (2008 – 2,315,380) own ordinary shares held by the ESOP Trust, a general<br />
discretionary trust whose beneficiaries include current and former employees of the Group and their dependants. The book value of these<br />
shares at 31 December 2009 was £2.1m (2008 – £0.9m restated for Rights Issue). The market value of these shares at 31 December 2009<br />
and at 9 March 2010 was £4.1m (31 December 2008 – £0.9m, 18 March 2009 – £1.2m).<br />
142<br />
<strong>Inchcape</strong> plc ¦ <strong>Annual</strong> <strong>Report</strong> and Accounts 2009
Section<br />
Three<br />
Financial<br />
statements<br />
12 Dividends<br />
The following dividends were paid by the Company:<br />
Interim dividend for the six months ended 30 June 2009 (2008 – 5.46p per share) – 25.0<br />
Final dividend for the year ended 31 December 2009 (2008 – 10.5p per share ) – 48.1<br />
– 73.1<br />
There is no proposal to pay a final dividend for the year ended 31 December 2009.<br />
Dividends paid in 2008 exclude £4.6m payable on treasury shares and shares held by the ESOP Trust.<br />
13 Reserves<br />
Share<br />
capital<br />
£m<br />
Share<br />
premium<br />
£m<br />
Capital<br />
redemption<br />
reserve<br />
£m<br />
2009<br />
£m<br />
Profit<br />
and loss<br />
account<br />
£m<br />
At 1 January 2008 121.6 123.4 16.4 154.8 416.2<br />
Profit for the financial year – – – 198.8 198.8<br />
Dividends – – – (73.1) (73.1)<br />
Issue of ordinary share capital 0.3 2.7 – 3.0<br />
Net purchase of own shares by ESOP Trust – – – (4.2) (4.2)<br />
Share-based payments credit (net of tax) – – – (1.1) (1.1)<br />
Share buy back programme – – – (16.0) (16.0)<br />
At 1 January 2009 121.9 126.1 16.4 259.2 523.6<br />
Loss for the financial year – – – (49.5) (49.5)<br />
Issue of ordinary share capital 41.4 – – 192.8 234.2<br />
Net purchase of own shares by ESOP Trust – – – (0.7) (0.7)<br />
Share-based payments charge (net of tax) – – – 3.9 3.9<br />
At 31 December 2009 163.3 126.1 16.4 405.7 711.5<br />
14 Principal subsidiaries at 31 December 2009<br />
The Company is a limited company incorporated in England and Wales whose shares are publicly traded on the London Stock<br />
Exchange. The principal subsidiaries in which the Company holds an investment are as follows:<br />
Country of incorporation Shareholding Description<br />
<strong>Inchcape</strong> Finance plc United Kingdom 100.0% Central treasury company<br />
<strong>Inchcape</strong> International Holdings Limited United Kingdom 100.0% Intermediate holding company<br />
<strong>Inchcape</strong> Overseas Limited United Kingdom 100.0% Intermediate holding company<br />
2008<br />
£m<br />
Total<br />
£m<br />
www.inchcape.com 143
Financial statements<br />
<strong>Report</strong> of the Auditors<br />
We have audited the parent Company Financial statements of<br />
<strong>Inchcape</strong> plc for the year ended 31 December 2009 which comprise<br />
the Company balance sheet, the accounting policies and the<br />
related notes. The financial reporting framework that has been<br />
applied in their preparation is applicable law and United Kingdom<br />
Accounting Standards (United Kingdom Generally Accepted<br />
Accounting Practice).<br />
Respective responsibilities of Directors and auditors<br />
As explained more fully in the statement of Directors’<br />
responsibilities, the Directors are responsible for the preparation of<br />
the parent Company Financial statements and for being satisfied<br />
that they give a true and fair view. Our responsibility is to audit<br />
the parent Company financial statements in accordance with<br />
applicable law and International Standards on Auditing (UK and<br />
Ireland). Those standards require us to comply with the Auditing<br />
Practices Board’s Ethical Standards for Auditors.<br />
This report, including the opinions, has been prepared for and<br />
only for the Company’s members as a body in accordance with<br />
Chapter 3 of Part 16 of the Companies Act 2006 and for no other<br />
purpose. We do not, in giving these opinions, accept or assume<br />
responsibility for any other purpose or to any other person to<br />
whom this report is shown or into whose hands it may come<br />
save where expressly agreed by our prior consent in writing.<br />
Scope of the audit of the financial statements<br />
An audit involves obtaining evidence about the amounts<br />
and disclosures in the Financial statements sufficient to give<br />
reasonable assurance that the Financial statements are free<br />
from material misstatement, whether caused by fraud or error.<br />
This includes an assessment of: whether the accounting policies<br />
are appropriate to the parent Company’s circumstances and<br />
have been consistently applied and adequately disclosed; the<br />
reasonableness of significant accounting estimates made by the<br />
Directors; and the overall presentation of the Financial statements.<br />
Matters on which we are required to report by exception<br />
We have nothing to report in respect of the following matters<br />
where the Companies Act 2006 requires us to report to you if,<br />
in our opinion:<br />
• adequate accounting records have not been kept by the<br />
parent Company, or returns adequate for our audit have<br />
not been received from branches not visited by us; or<br />
• the parent Company Financial statements and the part<br />
of the Directors’ remuneration report to be audited are not<br />
in agreement with the accounting records and returns; or<br />
• certain disclosures of Directors’ remuneration specified by<br />
law are not made; or<br />
• we have not received all the information and explanations<br />
we require for our audit.<br />
Other matter<br />
We have reported separately on the Group Financial statements<br />
of <strong>Inchcape</strong> plc for the year ended 31 December 2009.<br />
Paul Cragg<br />
(Senior Statutory Auditor)<br />
for and on behalf of PricewaterhouseCoopers LLP<br />
Chartered Accountants and Statutory Auditors<br />
London<br />
9 March 2010<br />
Opinion on financial statements<br />
In our opinion the parent Company financial statements:<br />
• give a true and fair view of the state of the Company’s affairs<br />
as at 31 December 2009;<br />
• have been properly prepared in accordance with United<br />
Kingdom Generally Accepted Accounting Practice; and<br />
• have been prepared in accordance with the requirements<br />
of the Companies Act 2006.<br />
Opinion on other matters prescribed by the Companies Act 2006<br />
In our opinion:<br />
• the part of the Directors’ remuneration report to be audited has<br />
been properly prepared in accordance with the Companies<br />
Act 2006; and<br />
• the information given in the Directors’ report for the financial<br />
year for which the parent Company Financial statements<br />
are prepared is consistent with the parent Company financial<br />
statements.<br />
144<br />
<strong>Inchcape</strong> plc ¦ <strong>Annual</strong> <strong>Report</strong> and Accounts 2009
Section<br />
Four<br />
Shareholder<br />
information<br />
Shareholder information<br />
company details<br />
Registered office<br />
<strong>Inchcape</strong> plc<br />
22a St James’s Square<br />
London SW1Y 5LP<br />
Tel: +44 (0) 20 7546 0022<br />
Fax: +44 (0) 20 7546 0010<br />
Registered number 609782<br />
Advisors<br />
Auditors<br />
PricewaterhouseCoopers LLP<br />
Chartered Accountants and<br />
Registered Auditors<br />
Share registrars<br />
Computershare Investor Services PLC<br />
Registrar’s Department,The Pavilions<br />
Bridgwater Road<br />
Bristol BS99 7NH<br />
Tel: +44 (0) 870 707 1076<br />
Solicitors<br />
Slaughter and May<br />
Corporate brokers<br />
Investec<br />
JP Morgan Cazenove<br />
<strong>Inchcape</strong> PEPs<br />
Individual Savings Accounts (ISAs)<br />
replaced Personal Equity Plans (PEPs)<br />
as the vehicle for tax efficient savings.<br />
Existing PEPs may be retained. <strong>Inchcape</strong><br />
PEPs are managed by The Share Centre<br />
Ltd, who can be contacted at PO Box<br />
2000, Oxford House, Oxford Road,<br />
Aylesbury, Buckinghamshire HP21 8ZB<br />
Tel: +44 (0) 1296 414144<br />
<strong>Inchcape</strong> ISA<br />
<strong>Inchcape</strong> has established a Corporate<br />
Individual Savings Account (ISA).<br />
This is managed by Equiniti Financial<br />
Services Limited,Aspect House, Spencer<br />
Road, Lancing,West Sussex BN99 6DA<br />
Tel: 0870 300 0430<br />
International callers:<br />
+44 121 441 7560<br />
More information is available at<br />
www.shareview.com<br />
Financial calendar<br />
<strong>Annual</strong> General Meeting<br />
13 May 2010<br />
Announcement of 2010 interim results<br />
July 2010<br />
This <strong>Report</strong> is printed on Hello Silk paper.<br />
This paper has been independently<br />
certified as meeting the standards of the<br />
Forest Stewardship Council (FSC), and was<br />
manufactured at a mill that is certified to<br />
the ISO14001 and EMAS environmental<br />
standards.The inks used are all vegetable<br />
oil based.<br />
Brand partner information<br />
www.audi.com<br />
www.kia.com<br />
www.rolls-roycemotorcars.com<br />
www.bmw.com<br />
www.landrover.com<br />
www.scion.com<br />
www.chevrolet.com<br />
www.lexus.com<br />
www.smart.com<br />
www.daihatsu.com<br />
www.mazda.com<br />
www.subaru.com<br />
www.ford.com<br />
www.mercedes.com<br />
www.suzuki.com<br />
www.hino.com<br />
www.mini.com<br />
www.toyota.com<br />
www.honda.com<br />
www.mitsubishi.com<br />
www.volkswagen.com<br />
www.hyundai.com<br />
www.peugeot.com<br />
www.volvo.com<br />
www.isuzu.com<br />
www.porsche.com<br />
www.jaguar.com<br />
www.renault.com<br />
Design and production by Black Sun Plc
<strong>Inchcape</strong> plc<br />
22a St James’s Square<br />
London SW1Y 5LP<br />
T +44 (0) 20 7546 0022<br />
F +44 (0) 20 7546 0010<br />
www.inchcape.com<br />
Registered number 609782