Earnings Presentation - IBM
Earnings Presentation - IBM
Earnings Presentation - IBM

You also want an ePaper? Increase the reach of your titles
YUMPU automatically turns print PDFs into web optimized ePapers that Google loves.
���®<br />
3Q 2008 <strong>Earnings</strong> <strong>Presentation</strong><br />
October 16, 2008<br />
www.ibm.com/investor
Forward Looking Statements<br />
Certain comments made in this presentation may be characterized as forward<br />
looking under the Private Securities Litigation Reform Act of 1995.<br />
Those statements involve a number of factors that could cause actual results<br />
to differ materially.<br />
Additional information concerning these factors is contained in the Company's<br />
filings with the SEC. Copies are available from the SEC, from the <strong>IBM</strong> web<br />
site, or from <strong>IBM</strong> Investor Relations.<br />
These charts and the associated remarks and comments are integrally related,<br />
and are intended to be presented and understood together.<br />
www.ibm.com/investor<br />
2
3Q 2008 Summary<br />
Revenue +5%<br />
Pre-tax profit +19%<br />
EPS +22%<br />
�Aligning investments to growth opportunities<br />
• Growth markets – Double-digit revenue growth<br />
• Major markets – Productivity initiatives<br />
�Annuity base provides steady source of profit and cash<br />
� Continue game plan into 4 th quarter<br />
Expect EPS of at least $8.75 for 2008<br />
www.ibm.com/investor<br />
3
3Q 2008 Financial Summary<br />
$ in Billions, except EPS<br />
3Q08<br />
www.ibm.com/investor<br />
B/(W)<br />
Yr/Yr<br />
Revenue $25.3 5%<br />
@CC 2%<br />
GP % 43.3% 2.0 pts<br />
Expense $7.1 (6%)<br />
Pre-Tax Income $3.9 19%<br />
Tax Rate 27.5% 0.5 pts<br />
Net Income $2.8 20%<br />
Shares (Diluted) (M) 1,379.1 2%<br />
EPS $2.05 22%<br />
Solid profit performance<br />
4
$ in Billions<br />
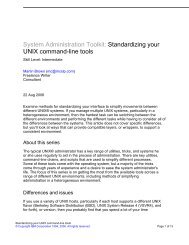
Revenue by Geography<br />
3Q08<br />
B/(W) Yr/Yr<br />
Rptd @CC<br />
Americas $10.5 3% 2%<br />
Europe/ME/A 8.9 10% 4%<br />
Asia Pacific 5.2 6% 1%<br />
Total Geographies $24.6 6% 3%<br />
<strong>IBM</strong> $25.3 5% 2%<br />
Major Markets 5% 1%<br />
Growth Markets 13% 10%<br />
BRIC Countries 19% 12%<br />
Led by growth markets<br />
www.ibm.com/investor<br />
U.S.<br />
+1%<br />
Canada/<br />
LA<br />
OEM<br />
(25%) @CC<br />
Japan<br />
-5%<br />
@CC<br />
EMEA<br />
APac<br />
+7%<br />
@CC<br />
5
$ in Billions<br />
Revenue by Key Industry Sales Unit<br />
3Q08<br />
B/(W) Yr/Yr<br />
Rptd @CC<br />
Financial Services $7.0 7% 2%<br />
Public 4.0 9% 6%<br />
Industrial 3.0 2% (2%)<br />
Distribution 2.4 3% 0%<br />
Communications 2.5 4% 2%<br />
Small / Medium Business 4.7 5% 2%<br />
All Sectors $24.7 6% 3%<br />
Total <strong>IBM</strong> $25.3 5% 2%<br />
www.ibm.com/investor<br />
Fin’l -<br />
U.S.<br />
Financial -<br />
Rest of<br />
World<br />
Public<br />
SMB<br />
Industrial<br />
Distribution<br />
Comms<br />
6
Rest of<br />
<strong>IBM</strong><br />
Financial Services Perspective<br />
3Q YTD Revenue<br />
U.S.<br />
Financial<br />
Rest of<br />
World<br />
Financial<br />
www.ibm.com/investor<br />
Rest of<br />
<strong>IBM</strong><br />
Financial institutions identified<br />
in The NY Times article *<br />
3Q Total Receivables<br />
* Source: The New York Times, October 1, 2008<br />
Includes AIG, Alliance & Leicester, Bear Stearns, Bradford & Bingley, Countrywide Financial, Dexia, Dusseldorfer Hypothekenbank, Fannie Mae, Fortis,<br />
Freddie Mac, Glitnir, HBOS, Hypo Real Estate, IKB Deutsche Industriebank, IndyMac Bancorp, Lehman Brothers, Merrill Lynch, Northern Rock, Roskilde<br />
Bank, Wachovia and Washington Mutual (see slide 25 of this presentation for additional information)<br />
7
$ in Billions<br />
Revenue by Segment<br />
3Q08<br />
B/(W) Yr/Yr<br />
Rptd @CC<br />
Global Technology Services $9.9 8% 5%<br />
Global Business Services 4.9 7% 3%<br />
Systems & Technology 4.4 (10%) (11%)<br />
Software 5.2 12% 8%<br />
Global Financing 0.6 2% (1%)<br />
Total Segments $25.1 5% 2%<br />
Total <strong>IBM</strong> $25.3 5% 2%<br />
www.ibm.com/investor<br />
Global<br />
Technology<br />
Services<br />
Annuity businesses provide solid revenue base<br />
Global<br />
Business<br />
Services Systems<br />
&<br />
Technology<br />
Software<br />
Global<br />
Financing<br />
8
$ in Billions<br />
Expense Summary<br />
3Q08<br />
www.ibm.com/investor<br />
B/(W)<br />
B/(W) Yr/Yr Drivers<br />
Yr/Yr Currency Acq.* Ops<br />
SG&A $5.6 (6%) (3 pts) (5 pts) 2 pts<br />
RD&E 1.6 (4%) (1 pts) (6 pts) 4 pts<br />
IP and Development Income (0.3) (1%)<br />
Other (Income)/Expense (0.1) (46%)<br />
Interest Expense 0.2 18%<br />
Total Expense & Other<br />
Income<br />
* Includes Acquisitions made in the last twelve months<br />
$7.1 (6%) (4 pts) (5 pts) 4 pts<br />
Aligning investments with growth opportunities<br />
SG&A Ops: Growth Markets grew 15% yr/yr, Rest of World improved 4% yr/yr<br />
9
Margins by Segment<br />
External<br />
Gross Profit Margins<br />
3Q08<br />
B/(W)<br />
Yr/Yr Pts 3Q08<br />
www.ibm.com/investor<br />
Total<br />
Pre-Tax Margins<br />
B/(W)<br />
Yr/Yr Pts<br />
Global Technology Services 32.7% 2.1 pts 11.6% 0.8 pts<br />
Global Business Services 27.4% 4.5 pts 14.0% 3.3 pts<br />
Systems & Technology 36.2% (2.4 pts) 6.1% (1.0 pts)<br />
Software 84.7% 0.5 pts 25.9% 1.5 pts<br />
Global Financing 49.1% 4.5 pts 32.0% (2.8 pts)<br />
Total Segments 43.6% 1.9 pts 15.1% 1.3 pts<br />
Total <strong>IBM</strong> 43.3% 2.0 pts 15.4% 1.8 pts<br />
Ongoing cost and expense initiatives drive margin expansion<br />
10
$ in Billions<br />
B/(W) Yr/Yr<br />
3Q08 Rptd @CC<br />
Revenue (External) $9.9 8% 5%<br />
Gross Margin (External) 32.7% 2.1 pts<br />
PTI Margin 11.6% 0.8 pts<br />
Services Segments<br />
Global Technology Services (GTS) Global Business Services (GBS)<br />
Global Services Signings @ Act. 3Q08 Yr/Yr<br />
Total Short Term Signings $6.1 13%<br />
Total Long Term Signings 6.6 (16%)<br />
Total Signings @ Actual $12.7 (4%)<br />
Global Services Signings @ CC 3Q08 Yr/Yr<br />
Total Short Term Signings $5.2 8%<br />
Total Long Term Signings 5.9 (15%)<br />
Total Signings @ CC $11.1 (5%)<br />
$ in Billions<br />
3Q08 Revenues<br />
(% of Total Services)<br />
www.ibm.com/investor<br />
+8%<br />
Yr/Yr<br />
Strategic<br />
Outsourcing<br />
34%<br />
+11% Yr/Yr<br />
Integrated<br />
Technology<br />
Services<br />
16%<br />
Services PTI +23% yr/yr: GTS +16%, GBS +39%<br />
Maint.<br />
12%<br />
Global Business<br />
Services<br />
33%<br />
B/(W) Yr/Yr<br />
3Q08 Rptd @CC<br />
Revenue (External) $4.9 7% 3%<br />
Gross Margin (External) 27.4% 4.5 pts<br />
PTI Margin 14.0 % 3.3 pts<br />
BTO 4%<br />
+7%<br />
Yr/Yr<br />
+6%<br />
Yr/Yr<br />
+14%<br />
Yr/Yr<br />
11
$ in Billions<br />
Systems & Technology Segment<br />
www.ibm.com/investor<br />
B/(W) Yr/Yr<br />
3Q08 Rptd @CC<br />
Revenue (External) $4.4 (10%) (11%)<br />
Gross Margin (External) 36.2% (2.4 pts)<br />
PTI Margin 6.1% (1.0 pts)<br />
3Q08 Revenue Yr/Yr<br />
System z 25%<br />
Converged System p 7%<br />
Legacy System i (82%)<br />
System x Servers (18%)<br />
Storage (3%)<br />
Retail Store Solutions (24%)<br />
Total Systems (7%)<br />
Microelectronics OEM (27%)<br />
Total Systems & Technology (10%)<br />
3Q08 Revenue<br />
(% of Total S&TG)<br />
Servers<br />
65%<br />
High-end High end strength in challenging environment<br />
Storage<br />
19%<br />
RSS<br />
Micro OEM<br />
12%<br />
12
$ in Billions<br />
Software Segment<br />
www.ibm.com/investor<br />
B/(W) Yr/Yr<br />
3Q08 Rptd @CC<br />
Revenue (External) $5.2 12% 8%<br />
Gross Margin (External) 84.7% 0.5 pts<br />
PTI Margin 25.9% 1.5 pts<br />
3Q08 Revenue Yr/Yr<br />
WebSphere Family 4%<br />
Information Management 26%<br />
Tivoli 2%<br />
Lotus 10%<br />
Rational 23%<br />
Key Branded Middleware 15%<br />
Total Middleware 12%<br />
Total Software 12%<br />
3Q08 Revenue<br />
(% of Total Software)<br />
Key<br />
Branded<br />
Middleware<br />
54%<br />
Other<br />
Middleware<br />
23%<br />
Other<br />
11%<br />
Recurring revenue and acquisitions, PTI +19%<br />
Operating<br />
Systems<br />
11%<br />
13
$ in Billions<br />
Cash Flow Analysis<br />
3Q08<br />
www.ibm.com/investor<br />
B/(W)<br />
Yr/Yr<br />
3Q08<br />
YTD<br />
B/(W)<br />
Yr/Yr<br />
Net Cash from Operations $3.7 ($0.7) $12.2 $1.2<br />
Less: Global Financing Receivables 0.5 (0.1) 2.3 0.0<br />
Net Cash from Operations<br />
(excluding GF Receivables)<br />
3.3 (0.7) 9.9 1.2<br />
Net Capital Expenditures (1.1) 0.2 (3.5) 0.0<br />
Free Cash Flow (excluding GF Receivables) 2.1 (0.5) 6.4 1.3<br />
Acquisitions (0.1) 0.4 (6.0) (5.3)<br />
Divestitures 0.0 0.0 0.1 (0.2)<br />
Dividends (0.7) (0.1) (1.9) (0.3)<br />
Share Repurchases (2.7) (2.5) (9.8) 8.5<br />
Non-GF Debt (0.1) 0.1 (1.4) (13.1)<br />
Other (includes GF A/R & GF Debt) 1.3 (1.1) 6.3 (0.4)<br />
Change in Cash & Marketable Securities ($0.1) ($3.7) ($6.4) ($9.6)<br />
14
$ in Billions<br />
Balance Sheet Summary<br />
www.ibm.com/investor<br />
Sept. 07 Dec. 07 Sept. 08<br />
Cash & Marketable Securities $13.8 $16.1 $9.8<br />
Non-GF Assets* 62.4 67.5 73.4<br />
Global Financing Assets* 32.4 36.8 32.8<br />
Total Assets 108.6 120.4 115.9<br />
Other Liabilities 52.7 56.7 54.0<br />
Non-GF Debt 11.5 10.7 9.9<br />
Global Financing Debt 23.8 24.5 24.5<br />
Total Debt 35.3 35.3 34.4<br />
Total Liabilities 88.1 92.0 88.4<br />
Equity 20.5 28.5 27.5<br />
Non-GF Debt / Capital 40% 30% 29%<br />
Global Financing Leverage 6.8 7.1 7.1<br />
*Excluding Cash & Marketable Securities<br />
15
Global Financing<br />
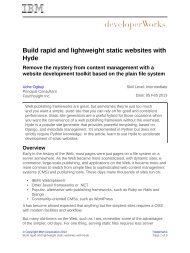
Global Financing as % of <strong>IBM</strong> External Portfolio Credit Quality<br />
$ in Billions<br />
3Q08<br />
� 97% of Portfolio in Core Competency<br />
of Technology Financing<br />
� No Exposure to Consumers or<br />
Mortgage Lending<br />
� No Securitization of Receivables<br />
% of<br />
<strong>IBM</strong><br />
External Revenue 0.6 3%<br />
Segment Pre-tax Income 0.3 9%<br />
External Receivables 24.2 21%<br />
What differentiates <strong>IBM</strong> Global Financing?<br />
35%<br />
30%<br />
25%<br />
20%<br />
15%<br />
10%<br />
5%<br />
0%<br />
33%<br />
www.ibm.com/investor<br />
Investment Grade<br />
60%<br />
27%<br />
Aaa-A3 Baa1-<br />
Baa3<br />
21%<br />
Non-Investment Grade<br />
40%<br />
11%<br />
7%<br />
1%<br />
Ba1-Ba2 Ba3-B1 B2-B3 Caa-C<br />
3Q07 3Q08<br />
Identified Loss Rate 1.1% 1.3%<br />
Anticipated Loss Rate 0.3% 0.5%<br />
Reserve Coverage 1.4% 1.8%<br />
Client Days Delinquent Outstanding 4.6 4.8<br />
Commercial A/R > 30 Days $95M $76M<br />
16
$1.68<br />
3Q07 EPS<br />
$0.08<br />
Revenue<br />
Growth<br />
5%<br />
as rptd.<br />
3Q 2008 EPS Bridge<br />
$0.27<br />
Includes<br />
+$0.09<br />
from Yr/Yr<br />
Pension<br />
Savings<br />
Gross<br />
Margin<br />
Expansion<br />
($0.03)<br />
Includes<br />
+$0.05<br />
from Yr/Yr<br />
Pension<br />
Savings<br />
Delivered $0.25 EPS growth from operations,<br />
excluding acquisitions and pension<br />
Expense<br />
Growth<br />
www.ibm.com/investor<br />
$0.04<br />
Share<br />
Repurchases<br />
$0.01<br />
Tax Rate<br />
22%<br />
Yr/Yr<br />
$2.05<br />
3Q08 EPS<br />
17
Liquidity<br />
Well-Positioned Well Positioned in Current Environment<br />
� $4.5B commercial paper balance @ 9/30<br />
� $20B available liquidity<br />
• $9.8B cash balance @ 9/30<br />
• $10B global credit facility backstop<br />
� Raised additional $4B of term debt in<br />
October<br />
� Investment grade rating<br />
• Long-term: A1/A+/A+<br />
• Short-term: A1/P1/F1<br />
Expect EPS of at least $8.75 for 2008<br />
www.ibm.com/investor<br />
Operational Characteristics<br />
� Offerings that deliver client value in<br />
current environment<br />
� Strong performance in growth markets<br />
� Ongoing initiatives to drive structural<br />
improvement and improve balance point<br />
� Solid annuity base drives profit and cash<br />
� Financial flexibility to take advantage of<br />
strategic opportunities<br />
18
www.ibm.com/investor<br />
19
Supplemental Materials<br />
Some columns and rows in these materials, including the supplemental<br />
exhibits, may not add due to rounding<br />
� Supplemental Segment Information – Global Services<br />
� Supplemental Segment Information – Systems & Technology,<br />
Software<br />
� Currency – Year/Year Comparison<br />
� Cash Flow (FAS 95)<br />
� The New York Times Article<br />
� Non-GAAP Supplementary Materials<br />
• Constant Currency<br />
• Cash Flow<br />
• Reconciliation of Asia Pacific Revenue Growth<br />
• Reconciliation of Revenue Growth in Selected Countries<br />
• Reconciliation of Revenue Growth in Selected Markets<br />
• Reconciliation of Revenue Growth in Services Segment<br />
• Reconciliation of Revenue Growth of Original Equipment<br />
Manufacturer (OEM)<br />
www.ibm.com/investor<br />
20
Supplemental Segment Information – 3Q 2008<br />
Revenue Growth<br />
Global Services Yr/Yr @CC<br />
Strategic Outsourcing 8% 4%<br />
Business Transformation<br />
Outsourcing<br />
14% 15%<br />
Integrated Tech Services 11% 8%<br />
Maintenance 6% 2%<br />
Global Technology Services 8% 5%<br />
Global Business Services 7% 3%<br />
www.ibm.com/investor<br />
Signings ($B)<br />
Global Services 3Q08 Yr/Yr<br />
Global Services Signings @ Actual $12.7 (4%)<br />
GBS Short-Term 3.7 10%<br />
GTS Short-Term 2.4 19%<br />
GBS Long-Term 1.4 (16%)<br />
GTS Long-Term 5.1 (17%)<br />
SO 4.7 (19%)<br />
BTO 0.5 14%<br />
Global Services Signings @ CC $11.1 (5%)<br />
GBS Short-Term 3.2 5%<br />
GTS Short-Term 2.1 14%<br />
GBS Long-Term 1.3 (18%)<br />
GTS Long-Term 4.6 (14%)<br />
SO 4.1 (16%)<br />
BTO 0.4 15%<br />
21
Supplemental Segment Information – 3Q 2008<br />
Revenue<br />
Systems & Technology Group Yr/Yr @CC GP% Share<br />
System z 25% 22%<br />
Converged System p 7% 6%<br />
Legacy System i (82%) (82%)<br />
System x Servers (18%) (20%)<br />
System Storage (3%) (5%)<br />
Retail Store Solutions (24%) (26%)<br />
Total Systems (7%) (8%)<br />
Microelectronics OEM (27%) (27%)<br />
Total Systems & Technology (10%) (11%)<br />
www.ibm.com/investor<br />
Revenue Growth<br />
Software Yr/Yr @CC<br />
WebSphere Family 4% 0%<br />
Information Management 26% 22%<br />
Tivoli 2% (1%)<br />
Lotus 10% 6%<br />
Rational 23% 20%<br />
Key Branded Middleware 15% 11%<br />
Other Middleware 6% 2%<br />
Total Middleware 12% 8%<br />
Operating Systems 5% 1%<br />
Other Software/Services 17% 12%<br />
Total Software 12% 8%<br />
22
Currency – Year/Year Comparison<br />
1Q08 Yr/Yr 2Q08 Yr/Yr 3Q08 Yr/Yr<br />
www.ibm.com/investor<br />
10/15<br />
@ 10/15<br />
Spot<br />
Spot 4Q08<br />
Euro 0.67 13% 0.64 14% 0.67 8% 0.73 -6%<br />
Pound 0.51 1% 0.51 -1% 0.53 -7% 0.57 -17%<br />
Yen 105 12% 105 13% 108 9% 101 11%<br />
<strong>IBM</strong> Revenue Impact 7 pts 7 pts 3 pts -4 pts<br />
<strong>IBM</strong> hedges its major cross-border<br />
cash flows to mitigate the effect of<br />
currency volatility in the year-over-year<br />
results. The impact of these hedging<br />
programs is principally reflected in<br />
Other Income and Expense, as well as<br />
Cost of Goods Sold.<br />
Negative Yr/Yr growth signifies a translation hurt<br />
Quarterly Averages per US $<br />
Revenue As Reported<br />
Currency Impact<br />
Revenue @CC<br />
US$B Yr/Yr<br />
$25.3 5%<br />
0.8 3 pts<br />
$24.5 2%<br />
23
$ in Billions<br />
Cash Flow (FAS 95)<br />
www.ibm.com/investor<br />
3Q08 3Q07<br />
Net Income from Operations $2.8 $2.4 $7.9 $6.5<br />
Depreciation / Amortization of Intangibles 1.4 1.3 4.1 3.9<br />
Stock-based Compensation 0.2 0.2 0.5 0.5<br />
Working Capital / Other (1.1) 0.0 (2.6) (2.2)<br />
Global Financing A/R 0.5 0.6 2.3 2.2<br />
Net Cash provided by Operating Activities 3.7 4.5 12.2 10.9<br />
Capital Expenditures, net of payments & proceeds (1.1) (1.3) (3.5) (3.5)<br />
Divestitures, net of cash transferred 0.0 0.0 0.1 0.3<br />
Acquisitions, net of cash acquired (0.1) (0.5) (6.0) (0.7)<br />
Marketable Securities / Other Investments, net (0.3) (1.4) 1.0 (1.8)<br />
Net Cash used in Investing Activities (1.5) (3.2) (8.4) (5.8)<br />
Debt, net of payments & proceeds 0.5 0.1 (0.9) 12.4<br />
Dividends (0.7) (0.5) (1.9) (1.6)<br />
Common Stock Repurchases (2.7) (0.2) (9.8) (18.4)<br />
Common Stock Transactions - Other 1.0 1.5 3.7 3.4<br />
Net Cash used in Financing Activities (1.9) 0.9 (9.0) (4.1)<br />
Effect of Exchange Rate changes on Cash (0.2) 0.1 (0.1) 0.2<br />
Net Change in Cash & Cash Equivalents $0.1 $2.3 ($5.2) $1.3<br />
3Q08<br />
YTD<br />
3Q07<br />
YTD<br />
24
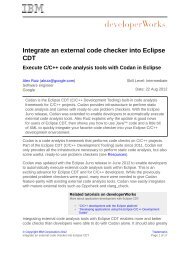
The New York Times Article<br />
NYT Graphics/© 2008 The New York Times Company<br />
www.ibm.com/investor<br />
25
Non-GAAP Non GAAP Supplementary Materials<br />
In an effort to provide investors with additional information regarding the<br />
company's results as determined by generally accepted accounting principles<br />
(GAAP), the company also discusses, in its earnings press release and earnings<br />
presentation materials, the following Non-GAAP information which management<br />
believes provides useful information to investors.<br />
Constant Currency<br />
Management refers to growth rates at constant currency or adjusting for<br />
currency so that the business results can be viewed without the impact of<br />
fluctuations in foreign currency exchange rates, thereby facilitating period-to-<br />
period comparisons of the company's business performance. Generally, when<br />
the dollar either strengthens or weakens against other currencies, the growth at<br />
constant currency rates or adjusting for currency will be higher or lower than<br />
growth reported at actual exchange rates.<br />
www.ibm.com/investor<br />
26
Cash Flow<br />
Non-GAAP Non GAAP Supplementary Materials<br />
Management includes presentations of both cash flow from operations and free<br />
cash flow that exclude the effect of Global Financing Receivables. For a<br />
financing business, increasing receivables is the basis for growth. Receivables<br />
are viewed as an investment and an income-producing asset. Therefore,<br />
management presents financing receivables as an investing activity.<br />
Management’s view is that this presentation gives the investor the best<br />
perspective of cash available for new investment or for distribution to<br />
shareholders.<br />
www.ibm.com/investor<br />
27
Non-GAAP Non GAAP Supplementary Materials<br />
Reconciliation of Asia Pacific Revenue Growth<br />
Asia Pacific Revenue, other than Japan<br />
Japan Revenue<br />
www.ibm.com/investor<br />
As Rptd @CC<br />
8%<br />
4%<br />
3Q08 Yr/Yr<br />
7%<br />
(5%)<br />
The above serves to reconcile the Non-GAAP financial information contained in the<br />
“Revenue by Geography” discussion regarding revenue growth in certain countries in<br />
the company’s earnings presentation. See Slide 26 of this presentation for additional<br />
information on the use of these Non-GAAP financial measures.<br />
28
Germany<br />
France<br />
Italy<br />
Non-GAAP Non GAAP Supplementary Materials<br />
United Kingdom<br />
Reconciliation of Revenue Growth in Selected Countries<br />
www.ibm.com/investor<br />
As Rptd @CC<br />
12%<br />
11%<br />
12%<br />
(4%)<br />
3Q08 Yr/Yr<br />
The above serves to reconcile the Non-GAAP financial information contained in the<br />
“Revenue by Geography” discussion regarding revenue growth in certain countries in<br />
the company’s earnings presentation. See Slide 26 of this presentation for additional<br />
information on the use of these Non-GAAP financial measures.<br />
2%<br />
2%<br />
2%<br />
3%<br />
29
Non-GAAP Non GAAP Supplementary Materials<br />
Reconciliation of Revenue Growth in Selected Markets<br />
Growth markets, Government sector<br />
www.ibm.com/investor<br />
3Q08 Yr/Yr<br />
As Rptd @CC<br />
39% 33%<br />
Growth markets, excluding China 14% 12%<br />
The above serves to reconcile the Non-GAAP financial information contained in the<br />
“Revenue by Key Industry Sales Unit” and “Revenue by Geography” discussion<br />
regarding revenue growth in certain markets in the company’s earnings<br />
presentation. See Slide 26 of this presentation for additional information on the use<br />
of these Non-GAAP financial measures.<br />
30
Non-GAAP Non GAAP Supplementary Materials<br />
Reconciliation of Revenue Growth in Services Segment<br />
Japan & Australia,<br />
Global Business Services<br />
Global Business Services, excluding<br />
Japan & Australia<br />
www.ibm.com/investor<br />
As Rptd @CC<br />
(6%)<br />
11%<br />
3Q08 Yr/Yr<br />
(13%)<br />
The above serves to reconcile the Non-GAAP financial information contained in the<br />
“Services Segments” discussion regarding revenue growth in certain countries in the<br />
company’s earnings presentation. See Slide 26 of this presentation for additional<br />
information on the use of these Non-GAAP financial measures.<br />
8%<br />
31
Non-GAAP Non GAAP Supplementary Materials<br />
Reconciliation of Revenue of Original Equipment Manufacturer (OEM)<br />
www.ibm.com/investor<br />
3Q08 Yr/Yr<br />
As Rptd @CC<br />
Revenue from Original Equipment<br />
Manufacturer (OEM) (24%) (25%)<br />
The above serves to reconcile the Non-GAAP financial information contained in the<br />
“Revenue by Geography” discussion regarding revenue growth in certain countries in<br />
the company’s earnings presentation. See Slide 26 of this presentation for additional<br />
information on the use of these Non-GAAP financial measures.<br />
32
www.ibm.com/investor<br />
33