REGIONAL COOPERATION AND ECONOMIC INTEGRATION
REGIONAL COOPERATION AND ECONOMIC INTEGRATION REGIONAL COOPERATION AND ECONOMIC INTEGRATION
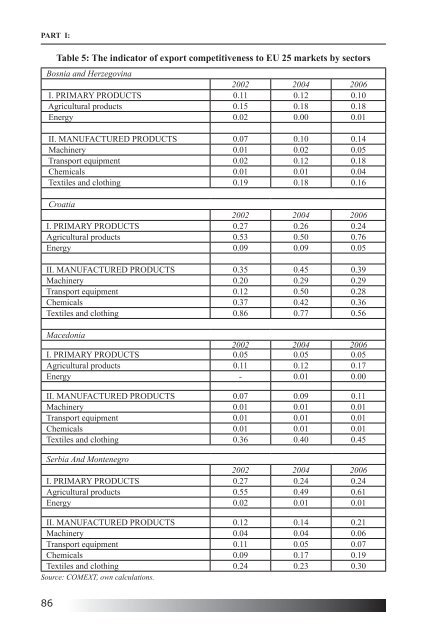
REGIONAL TRADE AGREEMENTS AND REGIONAL COOPERATION 2.5. Export competitiveness to EU markets The European Union is the most important export destination for all observed countries. That is why in this part of the paper the emphasis is on the analysis of export competitiveness to EU markets. As an indicator of export competitiveness we use the ratio between the export share of individual product i to observed markets and total import of that product from observed market. The comparison of the export competitiveness between domestic production activities is shown in figure 2. Figure 2: The indicator of total export competitiveness to EU 25 markets 0,40 0,35 0,30 0,25 0,20 0,15 0,10 0,05 - 2002 2004 2006 Source: COMEXT, own calculations. Bosnia and Herzegovina Croatia Macedonia Serbia and Montenegro According to the total indicator of competitiveness Croatia has the best position to the EU 25 markets relative to the other observed countries. Macedonia has the lowest value of the indicator. Although Bosnia and Herzegovina, Macedonia and Serbia and Montenegro have significantly lower levels of total competitiveness to the EU 25 than Croatia, there are positive trends in the growth of competitiveness. More detailed view about competitiveness is shown in table 5 where the competitiveness of individual economic sectors is shown. The obtained results lead to the conclusion that Croatia has a significantly better position in terms of EU-25 markets compared to other countries. All countries improved their position to EU markets from 2002 to 2006 in agricultural products. While Croatia faced deteriorating the export competitiveness in textiles and clothing, Macedonia and Serbia and Montenegro improved competitiveness in these sectors. The characteristic of Bosnia and Herzegovina is a significant improvement of export competitiveness in transport equipment. 85
PART I: Table 5: The indicator of export competitiveness to EU 25 markets by sectors Bosnia and Herzegovina 2002 2004 2006 I. PRIMARY PRODUCTS 0.11 0.12 0.10 Agricultural products 0.15 0.18 0.18 Energy 0.02 0.00 0.01 II. MANUFACTURED PRODUCTS 0.07 0.10 0.14 Machinery 0.01 0.02 0.05 Transport equipment 0.02 0.12 0.18 Chemicals 0.01 0.01 0.04 Textiles and clothing 0.19 0.18 0.16 Croatia 2002 2004 2006 I. PRIMARY PRODUCTS 0.27 0.26 0.24 Agricultural products 0.53 0.50 0.76 Energy 0.09 0.09 0.05 II. MANUFACTURED PRODUCTS 0.35 0.45 0.39 Machinery 0.20 0.29 0.29 Transport equipment 0.12 0.50 0.28 Chemicals 0.37 0.42 0.36 Textiles and clothing 0.86 0.77 0.56 Macedonia 2002 2004 2006 I. PRIMARY PRODUCTS 0.05 0.05 0.05 Agricultural products 0.11 0.12 0.17 Energy - 0.01 0.00 II. MANUFACTURED PRODUCTS 0.07 0.09 0.11 Machinery 0.01 0.01 0.01 Transport equipment 0.01 0.01 0.01 Chemicals 0.01 0.01 0.01 Textiles and clothing 0.36 0.40 0.45 Serbia And Montenegro 2002 2004 2006 I. PRIMARY PRODUCTS 0.27 0.24 0.24 Agricultural products 0.55 0.49 0.61 Energy 0.02 0.01 0.01 II. MANUFACTURED PRODUCTS 0.12 0.14 0.21 Machinery 0.04 0.04 0.06 Transport equipment 0.11 0.05 0.07 Chemicals 0.09 0.17 0.19 Textiles and clothing 0.24 0.23 0.30 Source: COMEXT, own calculations. 86
- Page 46 and 47: REGIONAL TRADE AGREEMENTS AND REGIO
- Page 48 and 49: REGIONAL TRADE AGREEMENTS AND REGIO
- Page 50 and 51: REGIONAL TRADE AGREEMENTS AND REGIO
- Page 52: REGIONAL TRADE AGREEMENTS AND REGIO
- Page 55 and 56: PART I: was developed especially fo
- Page 57 and 58: PART I: 2. Theoretical background,
- Page 59 and 60: PART I: focus on the way in which t
- Page 61 and 62: PART I: of private incomes by addin
- Page 63 and 64: PART I: the GDP per capita: the 53.
- Page 65 and 66: PART I: received EU-transfers, but
- Page 68 and 69: Dr Márta Zádor, PhD Deputy Genera
- Page 70 and 71: REGIONAL TRADE AGREEMENTS AND REGIO
- Page 72 and 73: REGIONAL TRADE AGREEMENTS AND REGIO
- Page 74 and 75: REGIONAL TRADE AGREEMENTS AND REGIO
- Page 76 and 77: Macedonia REGIONAL TRADE AGREEMENTS
- Page 78 and 79: REGIONAL TRADE AGREEMENTS AND REGIO
- Page 80 and 81: REGIONAL TRADE AGREEMENTS AND REGIO
- Page 82 and 83: REGIONAL TRADE AGREEMENTS AND REGIO
- Page 84 and 85: REGIONAL TRADE AGREEMENTS AND REGIO
- Page 86 and 87: Goran Buturac, Ph.D., Research Fell
- Page 88 and 89: REGIONAL TRADE AGREEMENTS AND REGIO
- Page 90 and 91: c in total exports of country a in
- Page 92 and 93: 2.3. Comparative advantages REGIONA
- Page 94 and 95: REGIONAL TRADE AGREEMENTS AND REGIO
- Page 98 and 99: 2.6. Export similarities The paper
- Page 100: REGIONAL TRADE AGREEMENTS AND REGIO
- Page 103 and 104: PART II: INTRODUCTION CEFTA-2006 is
- Page 105 and 106: PART II: Agreement for Modification
- Page 107 and 108: PART II: only provide temporary rep
- Page 109 and 110: PART II: The Leaders of the Group o
- Page 111 and 112: PART II: messages over the past yea
- Page 113 and 114: PART II: INTRODUCTION Central Europ
- Page 115 and 116: PART II: Table 1: Gross domestic pr
- Page 117 and 118: PART II: Figure 3: Distribution of
- Page 119 and 120: PART II: Table 6: Countries of West
- Page 121 and 122: PART II: Adriatic gas pipeline is c
- Page 123 and 124: PART II: Total Croatian export to t
- Page 125 and 126: PART II: CIA - The World Bank Factb
- Page 128 and 129: CEFTA-2006 TRADE COOPERATION Sanja
- Page 130 and 131: the implementation of the protocol
- Page 132 and 133: CEFTA-2006 TRADE COOPERATION in the
- Page 134 and 135: The major foreign trade partners in
- Page 136: Integration, Vol. 26, No. 3, 309-33
- Page 139 and 140: PART II: divisive, as well as mainl
- Page 141 and 142: PART II: of time. During the transi
- Page 143 and 144: PART II: been recovered from 2004 o
- Page 145 and 146: PART II: diversified structure as c
PART I:<br />
Table 5: The indicator of export competitiveness to EU 25 markets by sectors<br />
Bosnia and Herzegovina<br />
2002 2004 2006<br />
I. PRIMARY PRODUCTS 0.11 0.12 0.10<br />
Agricultural products 0.15 0.18 0.18<br />
Energy 0.02 0.00 0.01<br />
II. MANUFACTURED PRODUCTS 0.07 0.10 0.14<br />
Machinery 0.01 0.02 0.05<br />
Transport equipment 0.02 0.12 0.18<br />
Chemicals 0.01 0.01 0.04<br />
Textiles and clothing 0.19 0.18 0.16<br />
Croatia<br />
2002 2004 2006<br />
I. PRIMARY PRODUCTS 0.27 0.26 0.24<br />
Agricultural products 0.53 0.50 0.76<br />
Energy 0.09 0.09 0.05<br />
II. MANUFACTURED PRODUCTS 0.35 0.45 0.39<br />
Machinery 0.20 0.29 0.29<br />
Transport equipment 0.12 0.50 0.28<br />
Chemicals 0.37 0.42 0.36<br />
Textiles and clothing 0.86 0.77 0.56<br />
Macedonia<br />
2002 2004 2006<br />
I. PRIMARY PRODUCTS 0.05 0.05 0.05<br />
Agricultural products 0.11 0.12 0.17<br />
Energy - 0.01 0.00<br />
II. MANUFACTURED PRODUCTS 0.07 0.09 0.11<br />
Machinery 0.01 0.01 0.01<br />
Transport equipment 0.01 0.01 0.01<br />
Chemicals 0.01 0.01 0.01<br />
Textiles and clothing 0.36 0.40 0.45<br />
Serbia And Montenegro<br />
2002 2004 2006<br />
I. PRIMARY PRODUCTS 0.27 0.24 0.24<br />
Agricultural products 0.55 0.49 0.61<br />
Energy 0.02 0.01 0.01<br />
II. MANUFACTURED PRODUCTS 0.12 0.14 0.21<br />
Machinery 0.04 0.04 0.06<br />
Transport equipment 0.11 0.05 0.07<br />
Chemicals 0.09 0.17 0.19<br />
Textiles and clothing 0.24 0.23 0.30<br />
Source: COMEXT, own calculations.<br />
86


