REGIONAL COOPERATION AND ECONOMIC INTEGRATION
REGIONAL COOPERATION AND ECONOMIC INTEGRATION REGIONAL COOPERATION AND ECONOMIC INTEGRATION
c in total exports of country a in country c. In this way the indicator is calculated assuming values in the interval from 0 to 1. The closer the ES indicator is to 1 the more similar the structure of exports between two countries is. 5 2. Empirical analysis REGIONAL TRADE AGREEMENTS AND REGIONAL COOPERATION 2.1. Analysis of export and import trends The periods of transition were characterized by a process of accelerated opening and integration of south-eastern European countries into the international market. Therefore, in this introductory part of the empirical analysis basic indicators and trends in international trade and rising trade openness are presented. The growth of openness and liberalization of domestic markets had strong impacts on import growth. In all countries export growth was recorded, but it was less than import growth (apart from Serbia and Montenegro). Average annual export and import growth rates from 1996 to 2006 were the highest in Bosnia and Herzegovina, and the lowest in Macedonia (table 1). Table 1: The basic indicators of exports and imports Average annual growth rate (%) Relative deficit 6 (%) Export + Im port (%) GDR Export Import 1996 2006 1996 2006 Bosnia and Herzegovina 25.68 15.78 -64.39 -37.60 44.83 89.50 Croatia 7.87 9.67 -26.64 -34.90 61.89 65.01 Macedonia 6.94 7.92 -17.28 -22.10 62.74 96.61 Serbia and Montenegro 12.80 12.10 -38.03 -35.05 41.12 66.06 Source: COMEXT, own calculations. It is clear that the movements in exports and imports of goods determined corresponding movements in the balance of trade. All economies face a trade deficit. It is interesting that the relative deficits of Bosnia and Herzegovina, Croatia and Serbia and Montenegro were in 2006 at approximately the same level. At the same time, Macedonia recorded the lowest relative deficit. During the observed period relative trade deficit reduced in Bosnia and Herzegovina and in Serbia and Montenegro. On the other hand, relative deficits increased in Croatia and in Macedonia. It is noted that Bosnia and Herzegovina had extremely significant fall in relative deficit from 1996 to 2006. 5 For details about the concept of the ES indicator see in Finger and Kreinen (1979). 6 Relative deficit is defined as , where x is the value of merchandize export, and m the value of merchandize import. 79
PART I: In all analyzed countries, trade rose rapidly relative to the rate of growth in GDP, which has resulted in a considerable growth in the share of trade in GDP. The most intensive growth in the share of exports and imports in GDP occurred in Bosnia and Herzegovina: it rose by 44.7% from 1996 to 2006. Out of the analysed transition countries the country with the lowest share of exports and imports in GDP in 2006 was Croatia (65.0%), practically stagnating in the share of exports in GDP. 2.2. Dispersion and concentration of export structures In turn, the dispersion and concentration of export structures are analyzed. Trends of the dispersion and concentration of merchandize export in south-eastern European countries were determined by process of transition, existing trade relationships, and the closeness of a strong economic structure – the EU. However, dynamics in the change of economic structure, the level of integration and trade specialization can have significant influence on the higher or lower level of export concentration. The level of concentration and dispersion was analyzed by applying the “Trade Entropy Index”. Croatia has the highest level of export dispersion, and Macedonia the lowest (figure 1). Figure 1: Trade Entropy Index in 2006 3 2,5 2 1,5 1 0,5 0 Bosnia and Herzegovina Croatia Macedonia Serbia and Montenegro Trade Entropy Indeks Source: COMEXT, own calculations. Compared to other analyzed countries, the Croatian export structure is specific in terms of a high share of the shipbuilding industry in total exports. 6 The greatest part of the exports of Serbia and Montenegro (40.0%) is related to base metal and articles of base metal. Strong concentration of Macedonian exports is determined by the domination of base metals and articles of base metal, as well as products of textile industry. These two sectors have a share in total Macedonian exports above 75.0%. Similarly, base metals and articles of the base metal are the most significant sectors in the export structure of Bosnia and Herzegovina. 7 The main change in the composition of Croatian export in the transition period is the recovery of shipbuilding industry exports from 1998 onwards which increased the share of machinery and transport equipment in total exports. 80
- Page 39 and 40: PART I: and world trade in goods an
- Page 42 and 43: REGIONAL TRADE AGREEMENTS AND REGIO
- Page 44 and 45: REGIONAL TRADE AGREEMENTS AND REGIO
- Page 46 and 47: REGIONAL TRADE AGREEMENTS AND REGIO
- Page 48 and 49: REGIONAL TRADE AGREEMENTS AND REGIO
- Page 50 and 51: REGIONAL TRADE AGREEMENTS AND REGIO
- Page 52: REGIONAL TRADE AGREEMENTS AND REGIO
- Page 55 and 56: PART I: was developed especially fo
- Page 57 and 58: PART I: 2. Theoretical background,
- Page 59 and 60: PART I: focus on the way in which t
- Page 61 and 62: PART I: of private incomes by addin
- Page 63 and 64: PART I: the GDP per capita: the 53.
- Page 65 and 66: PART I: received EU-transfers, but
- Page 68 and 69: Dr Márta Zádor, PhD Deputy Genera
- Page 70 and 71: REGIONAL TRADE AGREEMENTS AND REGIO
- Page 72 and 73: REGIONAL TRADE AGREEMENTS AND REGIO
- Page 74 and 75: REGIONAL TRADE AGREEMENTS AND REGIO
- Page 76 and 77: Macedonia REGIONAL TRADE AGREEMENTS
- Page 78 and 79: REGIONAL TRADE AGREEMENTS AND REGIO
- Page 80 and 81: REGIONAL TRADE AGREEMENTS AND REGIO
- Page 82 and 83: REGIONAL TRADE AGREEMENTS AND REGIO
- Page 84 and 85: REGIONAL TRADE AGREEMENTS AND REGIO
- Page 86 and 87: Goran Buturac, Ph.D., Research Fell
- Page 88 and 89: REGIONAL TRADE AGREEMENTS AND REGIO
- Page 92 and 93: 2.3. Comparative advantages REGIONA
- Page 94 and 95: REGIONAL TRADE AGREEMENTS AND REGIO
- Page 96 and 97: REGIONAL TRADE AGREEMENTS AND REGIO
- Page 98 and 99: 2.6. Export similarities The paper
- Page 100: REGIONAL TRADE AGREEMENTS AND REGIO
- Page 103 and 104: PART II: INTRODUCTION CEFTA-2006 is
- Page 105 and 106: PART II: Agreement for Modification
- Page 107 and 108: PART II: only provide temporary rep
- Page 109 and 110: PART II: The Leaders of the Group o
- Page 111 and 112: PART II: messages over the past yea
- Page 113 and 114: PART II: INTRODUCTION Central Europ
- Page 115 and 116: PART II: Table 1: Gross domestic pr
- Page 117 and 118: PART II: Figure 3: Distribution of
- Page 119 and 120: PART II: Table 6: Countries of West
- Page 121 and 122: PART II: Adriatic gas pipeline is c
- Page 123 and 124: PART II: Total Croatian export to t
- Page 125 and 126: PART II: CIA - The World Bank Factb
- Page 128 and 129: CEFTA-2006 TRADE COOPERATION Sanja
- Page 130 and 131: the implementation of the protocol
- Page 132 and 133: CEFTA-2006 TRADE COOPERATION in the
- Page 134 and 135: The major foreign trade partners in
- Page 136: Integration, Vol. 26, No. 3, 309-33
- Page 139 and 140: PART II: divisive, as well as mainl
PART I:<br />
In all analyzed countries, trade rose rapidly relative to the rate of growth in GDP, which has<br />
resulted in a considerable growth in the share of trade in GDP. The most intensive growth<br />
in the share of exports and imports in GDP occurred in Bosnia and Herzegovina: it rose<br />
by 44.7% from 1996 to 2006. Out of the analysed transition countries the country with<br />
the lowest share of exports and imports in GDP in 2006 was Croatia (65.0%), practically<br />
stagnating in the share of exports in GDP.<br />
2.2. Dispersion and concentration of export structures<br />
In turn, the dispersion and concentration of export structures are analyzed. Trends of the<br />
dispersion and concentration of merchandize export in south-eastern European countries<br />
were determined by process of transition, existing trade relationships, and the closeness<br />
of a strong economic structure – the EU. However, dynamics in the change of economic<br />
structure, the level of integration and trade specialization can have significant influence on<br />
the higher or lower level of export concentration. The level of concentration and dispersion<br />
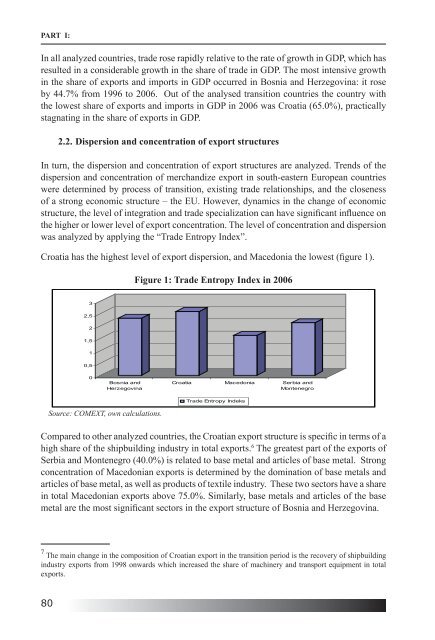
was analyzed by applying the “Trade Entropy Index”.<br />
Croatia has the highest level of export dispersion, and Macedonia the lowest (figure 1).<br />
Figure 1: Trade Entropy Index in 2006<br />
3<br />
2,5<br />
2<br />
1,5<br />
1<br />
0,5<br />
0<br />
Bosnia and<br />
Herzegovina<br />
Croatia Macedonia Serbia and<br />
Montenegro<br />
Trade Entropy Indeks<br />
Source: COMEXT, own calculations.<br />
Compared to other analyzed countries, the Croatian export structure is specific in terms of a<br />
high share of the shipbuilding industry in total exports. 6 The greatest part of the exports of<br />
Serbia and Montenegro (40.0%) is related to base metal and articles of base metal. Strong<br />
concentration of Macedonian exports is determined by the domination of base metals and<br />
articles of base metal, as well as products of textile industry. These two sectors have a share<br />
in total Macedonian exports above 75.0%. Similarly, base metals and articles of the base<br />
metal are the most significant sectors in the export structure of Bosnia and Herzegovina.<br />
7 The main change in the composition of Croatian export in the transition period is the recovery of shipbuilding<br />
industry exports from 1998 onwards which increased the share of machinery and transport equipment in total<br />
exports.<br />
80


