REGIONAL COOPERATION AND ECONOMIC INTEGRATION
REGIONAL COOPERATION AND ECONOMIC INTEGRATION REGIONAL COOPERATION AND ECONOMIC INTEGRATION
CEFTA-2006 TRADE COOPERATION Table 2: Trade within the region of SEE, 2006 or 2007 (per cent of total) Albania 1) Bosnia & Macedo - Monte - Serbia & Herzego - Croatia 2) nia vina 2) negro Serbia1) Montenegro 1) 2) Kosovo 2) Ex. Im. Ex. Im. Ex. Im. Ex. Im. Ex. Im. Ex. Im. Ex. Im. Ex. Im. Albania 1) - - 0.3 1 1.6 1.6 5 0.9 Bosnia & Herzego - vina 2) 0.32 0.054 20.86 18.50 0.1 0.97 2.75 0.124 9.93 4.27 0.93 0.53 Croatia 2) 0.28 0.01 14.4 2.85 0.95 0.86 1.25 0.03 5.36 1.27 Macedonia 2) 2.17 0.37 2.62 0.66 4.88 2.1 0.82 0.03 19.05 8.58 Montenegro 1) 1.63 0.23 4.55 2.76 1.4 4.07 0.32 1.05 27.41 3) 27.12 3) Kosovo 2) 12.6 2.2 3.2 1.9 1.1 2.5 10.5 15.1 1.8 1.0 11.7 14.1 Serbia 1) 0.97 0.006 12.2 2.8 4.0 2.87 4.5 1.67 11.7 0.72 Source: Calculations are made according to original data obtained from INSTAT (Albania Institute of Statistics); Bosnia and Herzegovina Statistical Office; Central Bureau of Statistics, Croatia; State Statistical Office of the Republic of Macedonia; The Statistical Office of the Republic of Montenegro; The Statistical Office of Kosovo; Statistical Office of the Republic of Serbia. Note: 1) Data is for 2006; 2) Data is for 2007; 3) It includes Kosovo as well In order to check such a hypothesis, we look closer into the SEE trade data for the years 2007 or 2006 (results are shown in Table 2) and compare them with the results for the year 1996 when it was shown that history induced trade diversion to the Region (Sekulovska- Gaber 2003, p.300). But, before proceeding further with the analysis we need to clarify certain things. Firstly, since Romania and Bulgaria entered the EU in 2007 and are no more members of CEFTA, they are not included in the analysis. The second thing is the participation of three independent entities (Serbia, Montenegro and Kosovo) in the “place” of Yugoslavia, with the explanation that, if not taken into consideration the declaration of independence of Montenegro, according to the data of some sources, Serbia and Montenegro were taken together. While in 1996, for many SEE countries other countries “in the group” were not important trading partner (a lot of zeros, with an exception perhaps for Republic of Macedonia), mostly because of the inherited divisions, general underdevelopment and overall security problems, figures in Table 2 show that the low levels of trade between SEE countries were overtaken and the “neighbours are back” for most of the countries in the Region (for Albania it is Serbia and Montenegro; for Bosnia and Herzegovina it is Croatia, and vice 175
PART II: versa for Croatia; for Macedonia it is Serbia, as well as for Montenegro; for Kosovo these are Macedonia and Serbia, and finally for Serbia it is Bosnia and Herzegovina). So, the creation and implementation of CEFTA-2006 acts as an incentive for closer integration in the Region, and as Jentisch-Muller pointed out: “...the quickest way to achieve the “Four freedoms” for the movements of goods, services, capital and people is not through a wholesale adaptation of the acquis but rather targeted removal of barriers that currently obstruct these freedoms” (Jentisch-Muller, 2007, p.7). 3. Geographical concentration of imports and exports of the Republic of Macedonia Macedonia’s recent history, like that of most other Balkan countries, begins in the 1990s. No matter the fact that Macedonia peacefully achieved its independence in 1991, it hasn’t had less of a decline in GDP or trade. It took Macedonia until 2003 to return to the 1991 level of GDP (Naghshopour 2008, p. 211). According to the report given by the World bank (WB, February 2008:7), growth was sluggish, but toward the end of the period, Macedonia has experienced considerable growth rates. GDP grew on average 3% annually in real terms and per capita GDP in EUR showed a jump of 26% between 2000 and 2006 (See Table 3). Table 3: Aggregate economic growth indicators of the Republic of Macedonia, 2001-2006 2000 2001 2002 2003 2004 2005 2006 GDP/capita (EUR at exch. rate) 1921 1887 1981 2025 2128 2279 2432 GDP real growth 4.5 -4.5 0.9 2.8 4.1 3.8 3.5 Source: “Labor Costs and Labor Taxes in the Western Balkans”, WB, February 2008 Both imports and exports in the Republic of Macedonia had overall positive trends, and in fact, they grew by more than 2.5 times (See Tables 4 and 5). The main nagging problem in this area was that total imports exceed total exports and Macedonian imports from all SEE countries grew faster than exports (from 1.89 times for imports from Croatia; 2.35 times for Serbia and Montenegro; 6.3 times for Albania and 6.47 times for Bosnia and Herzegovina, to 1.91 times increase of exports in Serbia; 3.43 times in Croatia; 3.79 times in Bosnia and Herzegovina and 5.68 times in Albania). The same can not be said for the geographical concentration of Macedonian imports and exports in the Region of SEE, since almost in the whole period, exports exceeded imports in all SEE countries (apart for Croatia in 2000 and for Serbia and Montenegro in 2004, when imports exceeded exports). Looking into the structure of import-export data, it is clear that in the whole period, the most important trading partner of Macedonia was Serbia 5 (always more than 70% in the import, as well as in the export side), while Croatia was on the second place, creating almost ¼ of imports and between 11% and 17% of exports. 5 Before the independence of Montenegro in 2006, data is given for Serbia and Montenegro. 176
- Page 136: Integration, Vol. 26, No. 3, 309-33
- Page 139 and 140: PART II: divisive, as well as mainl
- Page 141 and 142: PART II: of time. During the transi
- Page 143 and 144: PART II: been recovered from 2004 o
- Page 145 and 146: PART II: diversified structure as c
- Page 147 and 148: PART II: VAR and to test if one may
- Page 149 and 150: PART II: VAR since the test for coi
- Page 151 and 152: PART II: coefficient sign) but mode
- Page 153 and 154: PART II: elasticity. The seasonal f
- Page 155 and 156: PART II: GDP” that has been runni
- Page 157 and 158: PART II: Faini, R., Pritchett, L. a
- Page 159 and 160: PART II: pleasant. The expectations
- Page 161 and 162: PART II: Table 3: Regional trade ex
- Page 163 and 164: PART II: In order to bring to an en
- Page 165 and 166: PART II: stimulated the growth rate
- Page 168 and 169: CEFTA-2006 TRADE COOPERATION Irena
- Page 170 and 171: CEFTA-2006 TRADE COOPERATION within
- Page 172 and 173: Table 2: Data on exports of agricul
- Page 174 and 175: CEFTA-2006 TRADE COOPERATION 3.1. T
- Page 176 and 177: Macedonian export of non-agricultur
- Page 178 and 179: is 37.1% of the total Serbian trade
- Page 180: CEFTA-2006 TRADE COOPERATION na CEF
- Page 183 and 184: PART II: countries in the Region, a
- Page 185: PART II: becoming wealthier consume
- Page 189 and 190: PART II: Table 5: Exports of the Re
- Page 191 and 192: PART II: Commission of the European
- Page 193 and 194: PART III: Serbia, Macedonia and man
- Page 195 and 196: PART III: of TNCs have changed the
- Page 197 and 198: PART III: 3. Foundations of the new
- Page 199 and 200: PART III: modes of supply, FATS cor
- Page 201 and 202: PART III: enterprise (affiliate). U
- Page 203 and 204: PART III: REFERENCES Bjelić, Predr
- Page 205 and 206: PART III: requirement for compulsor
- Page 207 and 208: PART III: Companies prepare and pre
- Page 209 and 210: PART III: it refers to adjusting of
- Page 211 and 212: PART III: presentation of assets, l
- Page 214 and 215: SOME ASPECTS OF TRADE STATISTICS AN
- Page 216 and 217: their mass and inversely proportion
- Page 218 and 219: Peri specifications in log-log spac
- Page 220 and 221: orn population, is less reliable an
- Page 222 and 223: SOME ASPECTS OF TRADE STATISTICS AN
- Page 224: Weltwirtschaftliches Archiv, 90(01)
- Page 227 and 228: PART IV: INTRODUCTION The manufactu
- Page 229 and 230: PART IV: 12 Figure 2: Main developm
- Page 231 and 232: PART IV: Firms’ characteristics F
- Page 233 and 234: PART IV: 3.2. Measurement and data
- Page 235 and 236: PART IV: high and high technologica
PART II:<br />
versa for Croatia; for Macedonia it is Serbia, as well as for Montenegro; for Kosovo these<br />
are Macedonia and Serbia, and finally for Serbia it is Bosnia and Herzegovina). So, the<br />
creation and implementation of CEFTA-2006 acts as an incentive for closer integration<br />
in the Region, and as Jentisch-Muller pointed out: “...the quickest way to achieve the<br />
“Four freedoms” for the movements of goods, services, capital and people is not through<br />
a wholesale adaptation of the acquis but rather targeted removal of barriers that currently<br />
obstruct these freedoms” (Jentisch-Muller, 2007, p.7).<br />
3. Geographical concentration of imports and exports of the Republic of<br />
Macedonia<br />
Macedonia’s recent history, like that of most other Balkan countries, begins in the 1990s.<br />
No matter the fact that Macedonia peacefully achieved its independence in 1991, it hasn’t<br />
had less of a decline in GDP or trade. It took Macedonia until 2003 to return to the 1991<br />
level of GDP (Naghshopour 2008, p. 211). According to the report given by the World bank<br />
(WB, February 2008:7), growth was sluggish, but toward the end of the period, Macedonia<br />
has experienced considerable growth rates. GDP grew on average 3% annually in real<br />
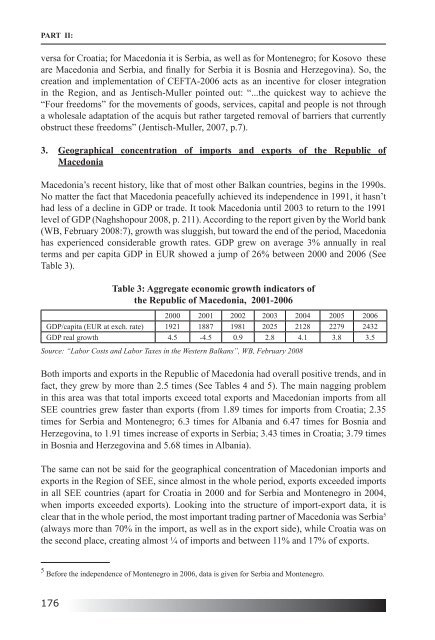
terms and per capita GDP in EUR showed a jump of 26% between 2000 and 2006 (See<br />
Table 3).<br />
Table 3: Aggregate economic growth indicators of<br />
the Republic of Macedonia, 2001-2006<br />
2000 2001 2002 2003 2004 2005 2006<br />
GDP/capita (EUR at exch. rate) 1921 1887 1981 2025 2128 2279 2432<br />
GDP real growth 4.5 -4.5 0.9 2.8 4.1 3.8 3.5<br />
Source: “Labor Costs and Labor Taxes in the Western Balkans”, WB, February 2008<br />
Both imports and exports in the Republic of Macedonia had overall positive trends, and in<br />
fact, they grew by more than 2.5 times (See Tables 4 and 5). The main nagging problem<br />
in this area was that total imports exceed total exports and Macedonian imports from all<br />
SEE countries grew faster than exports (from 1.89 times for imports from Croatia; 2.35<br />
times for Serbia and Montenegro; 6.3 times for Albania and 6.47 times for Bosnia and<br />
Herzegovina, to 1.91 times increase of exports in Serbia; 3.43 times in Croatia; 3.79 times<br />
in Bosnia and Herzegovina and 5.68 times in Albania).<br />
The same can not be said for the geographical concentration of Macedonian imports and<br />
exports in the Region of SEE, since almost in the whole period, exports exceeded imports<br />
in all SEE countries (apart for Croatia in 2000 and for Serbia and Montenegro in 2004,<br />
when imports exceeded exports). Looking into the structure of import-export data, it is<br />
clear that in the whole period, the most important trading partner of Macedonia was Serbia 5<br />
(always more than 70% in the import, as well as in the export side), while Croatia was on<br />
the second place, creating almost ¼ of imports and between 11% and 17% of exports.<br />
5 Before the independence of Montenegro in 2006, data is given for Serbia and Montenegro.<br />
176


