Create successful ePaper yourself
Turn your PDF publications into a flip-book with our unique Google optimized e-Paper software.
<strong>Wireshark</strong> <strong>Lab</strong>:<br />
<strong>Getting</strong> <strong>Started</strong> <strong>v6.0</strong><br />
Supplement to Computer Networking: A Top-‐Down <br />
Approach, 6 th ed., J.F. Kurose and K.W. Ross <br />
“Tell me and I forget. Show me and I remember. Involve me and I <br />
understand.” Chinese proverb <br />
© 2005-‐21012, J.F Kurose and K.W. Ross, All Rights Reserved <br />
One’s understanding of network protocols can often be greatly deepened by “seeing protocols in <br />
action” and by “playing around with protocols” – observing the sequence of messages exchanged <br />
between two protocol entities, delving down into the details of protocol operation, and causing <br />
protocols to perform certain actions and then observing these actions and their consequences. <br />
This can be done in simulated scenarios or in a “real” network environment such as the Internet. <br />
In the <strong>Wireshark</strong> labs you’ll be doing in this course, you’ll be running various network <br />
applications in different scenarios using your own computer (or you can borrow a friends; let me <br />
know if you don’t have access to a computer where you can install/run <strong>Wireshark</strong>). You’ll <br />
observe the network protocols in your computer “in action,” interacting and exchanging <br />
messages with protocol entities executing elsewhere in the Internet. Thus, you and your <br />
computer will be an integral part of these “live” labs. You’ll observe, and you’ll learn, by doing. <br />
In this first <strong>Wireshark</strong> lab, you’ll get acquainted with <strong>Wireshark</strong>, and make some simple packet <br />
captures and observations. <br />
The basic tool for observing the messages exchanged between executing protocol entities is <br />
called a packet sniffer. As the name suggests, a packet sniffer captures (“sniffs”) messages being <br />
sent/received from/by your computer; it will also typically store and/or display the contents of <br />
the various protocol fields in these captured messages. A packet sniffer itself is passive. It <br />
observes messages being sent and received by applications and protocols running on your <br />
computer, but never sends packets itself. Similarly, received packets are never explicitly <br />
addressed to the packet sniffer. Instead, a packet sniffer receives a copy of packets that are <br />
sent/received from/by application and protocols executing on your machine. <br />
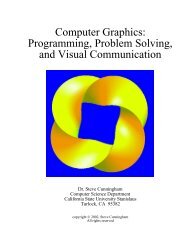
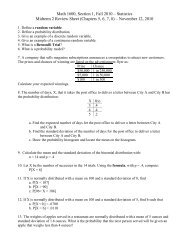
Figure 1 shows the structure of a packet sniffer. At the right of Figure 1 are the protocols <br />
(in this case, Internet protocols) and applications (such as a web browser or ftp client) that <br />
normally run on your computer. The packet sniffer, shown within the dashed rectangle in <br />
Figure 1 is an addition to the usual software in your computer, and consists
of two parts. The packet capture library receives a copy of every link-‐layer frame that is sent <br />
from or received by your computer. Recall from the discussion from section 1.5 in the text <br />
(Figure 1.24 1 ) that messages exchanged by higher layer protocols such as HTTP, FTP, TCP, UDP, <br />
DNS, or IP all are eventually encapsulated in link-‐layer frames that are transmitted over physical <br />
media such as an Ethernet cable. In Figure 1, the assumed physical media is an Ethernet, and so <br />
all upper-‐layer protocols are eventually encapsulated within an Ethernet frame. Capturing all <br />
link-‐layer frames thus gives you all messages sent/received from/by all protocols and <br />
applications executing in your computer. <br />
application<br />
application (e.g., www<br />
browser, ftp client)<br />
operating<br />
system<br />
copy of all Ethernet<br />
frames sent/received<br />
Transport (TCP/UDP)<br />
Network (IP)<br />
Link (Ethernet)<br />
Physical<br />
sniffer<br />
to/from network to/from network<br />
Figure 1: Packet sniffer structure <br />
packet<br />
The second component of a packet sniffer is the packet analyzer, which displays the contents of <br />
all fields within a protocol message. In order to do so, the packet analyzer must “understand” <br />
the structure of all messages exchanged by protocols. For example, suppose we are interested in <br />
displaying the various fields in messages exchanged by the HTTP protocol in Figure 1. The <br />
packet analyzer understands the format of Ethernet frames, and so can identify the IP datagram <br />
within an Ethernet frame. It also understands the IP datagram format, so that it can extract the <br />
TCP segment within the IP datagram. Finally, it understands the TCP segment structure, so it <br />
can extract the HTTP message contained in the TCP segment. Finally, it understands the HTTP <br />
protocol and so, for example, knows that the first bytes of an HTTP message will contain the <br />
string “GET,” “POST,” or “HEAD,” as shown in Figure 2.8 in the text. <br />
We will be using the <strong>Wireshark</strong> packet sniffer [http://www.wireshark.org/] for these labs, <br />
allowing us to display the contents of messages being sent/received from/by protocols at <br />
different levels of the protocol stack. (Technically speaking, <strong>Wireshark</strong> is a packet analyzer that <br />
uses a packet capture library in your computer). <strong>Wireshark</strong> is a free network protocol analyzer <br />
that runs on Windows, Linux/Unix, and Mac computers. It’s an ideal packet analyzer for our labs <br />
– it is stable, has a large user base and well-‐documented support that includes a user-‐guide <br />
(http://www.wireshark.org/docs/wsug_html_chunked/), <br />
1 <br />
References to figures and sections are for the 6 th edition of our text, Computer Networks, A Top-down<br />
Approach, 6 th ed., J.F. Kurose and K.W. Ross, Addison-‐Wesley/Pearson, 2012.
man pages (http://www.wireshark.org/docs/man-‐pages/), and a detailed FAQ <br />
(http://www.wireshark.org/faq.html), rich functionality that includes the capability to analyze <br />
hundreds of protocols, and a well-‐designed user interface. It operates in computers using <br />
Ethernet, serial (PPP and SLIP), 802.11 wireless LANs, and many other link-‐layer technologies <br />
(if the OS on which it's running allows <strong>Wireshark</strong> to do so). <br />
<strong>Getting</strong> <strong>Wireshark</strong><br />
In order to run <strong>Wireshark</strong>, you will need to have access to a computer that supports both <br />
<strong>Wireshark</strong> and the libpcap or WinPCap packet capture library. The libpcap software will be <br />
installed for you, if it is not installed within your operating system, when you install <strong>Wireshark</strong>. <br />
See http://www.wireshark.org/download.html for a list of supported operating systems and <br />
download sites <br />
Download and install the <strong>Wireshark</strong> software: <br />
• Go to http://www.wireshark.org/download.html and download and install the <strong>Wireshark</strong> <br />
binary for your computer. <br />
The <strong>Wireshark</strong> FAQ has a number of helpful hints and interesting tidbits of information, <br />
particularly if you have trouble installing or running <strong>Wireshark</strong>. <br />
Running <strong>Wireshark</strong><br />
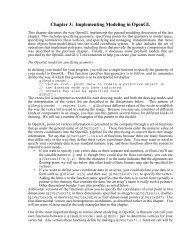
When you run the <strong>Wireshark</strong> program, you’ll get a startup screen, as shown below: <br />
Figure 2: Initial <strong>Wireshark</strong> Screen
Take a look at the upper left hand side of the screen – you’ll see an “Interface list”. This is the <br />
list of network interfaces on your computer. Once you choose an interface, <strong>Wireshark</strong> will <br />
capture all packets on that interface. In the example above, there is an Ethernet interface <br />
(Gigabit network Connection) and a wireless interface (“Microsoft”). <br />
If you click on one of these interfaces to start packet capture (i.e., for <strong>Wireshark</strong> to begin <br />
capturing all packets being sent to/from that interface), a screen like the one below will be <br />
displayed, showing information about the packets being captured. Once you start packet <br />
capture, you can stop it by using the Capture pull down menu and selecting Stop. <br />
Figure 3: <strong>Wireshark</strong> Graphical User Interface, during packet capture and analysis <br />
The <strong>Wireshark</strong> interface has five major components: <br />
• The command menus are standard pulldown menus located at the top of the <br />
window. Of interest to us now are the File and Capture menus. The File menu <br />
allows you to save captured packet data or open a file containing previously <br />
captured packet data, and exit the <strong>Wireshark</strong> application. The Capture menu <br />
allows you to begin packet capture.
• The packet-‐listing window displays a one-‐line summary for each packet captured, <br />
including the packet number (assigned by <strong>Wireshark</strong>; this is not a packet number <br />
contained in any protocol’s header), the time at which the packet was captured, the <br />
packet’s source and destination addresses, the protocol type, and protocol-‐specific <br />
information contained in the packet. The packet listing can be sorted according to any <br />
of these categories by clicking on a column name. The protocol type field lists the <br />
highest-‐level protocol that sent or received this packet, i.e., the protocol that is the <br />
source or ultimate sink for this packet. <br />
• The packet-‐header details window provides details about the packet selected <br />
(highlighted) in the packet-‐listing window. (To select a packet in the packet-‐listing <br />
window, place the cursor over the packet’s one-‐line summary in the packet-‐listing <br />
window and click with the left mouse button.). These details include information <br />
about the Ethernet frame (assuming the packet was sent/received over an Ethernet <br />
interface) and IP datagram that contains this packet. The amount of Ethernet and IP-layer<br />
detail displayed can be expanded or minimized by clicking on the plus minus <br />
boxes to the left of the Ethernet frame or IP datagram line in the packet details <br />
window. If the packet has been carried over TCP or UDP, TCP or UDP details will also <br />
be displayed, which can similarly be expanded or minimized. Finally, details about <br />
the highest-‐level protocol that sent or received this packet are also provided. <br />
• The packet-‐contents window displays the entire contents of the captured frame, in <br />
both ASCII and hexadecimal format. <br />
• Towards the top of the <strong>Wireshark</strong> graphical user interface, is the packet display <br />
filter field, into which a protocol name or other information can be entered in <br />
order to filter the information displayed in the packet-‐listing window (and hence <br />
the packet-‐header and packet-‐contents windows). In the example below, we’ll use <br />
the packet-‐display filter field to have <strong>Wireshark</strong> hide (not display) packets except <br />
those that correspond to HTTP messages. <br />
Taking <strong>Wireshark</strong> for a Test Run<br />
The best way to learn about any new piece of software is to try it out! We’ll assume that your <br />
computer is connected to the Internet via a wired Ethernet interface. Indeed, I recommend that <br />
you do this first lab on a computer that has a wired Ethernet connection, rather than just a <br />
wireless connection. Do the following <br />
1. Start up your favorite web browser, which will display your selected homepage. <br />
2. Start up the <strong>Wireshark</strong> software. You will initially see a window similar to that <br />
shown in Figure 2. <strong>Wireshark</strong> has not yet begun capturing packets. <br />
3. To begin packet capture, select the Capture pull down menu and select Interfaces. <br />
This will cause the “<strong>Wireshark</strong>: Capture Interfaces” window to be displayed, as <br />
shown in Figure 4.
Figure 4: <strong>Wireshark</strong> Capture Interface Window <br />
4. You’ll see a list of the interfaces on your computer as well as a count of the <br />
packets that have been observed on that interface so far. Click on Start for the <br />
interface on which you want to begin packet capture (in the case, the Gigabit <br />
network Connection). Packet capture will now begin -‐<strong>Wireshark</strong> is now <br />
capturing all packets being sent/received from/by your computer! <br />
5. Once you begin packet capture, a window similar to that shown in Figure 3 will <br />
appear. This window shows the packets being captured. By selecting Capture <br />
pulldown menu and selecting Stop, you can stop packet capture. But don’t stop <br />
packet capture yet. Let’s capture some interesting packets first. To do so, we’ll <br />
need to generate some network traffic. Let’s do so using a web browser, which <br />
will use the HTTP protocol that we will study in detail in class to download <br />
content from a website. <br />
<br />
6. While <strong>Wireshark</strong> is running, enter the URL: <br />
http://gaia.cs.umass.edu/wireshark-‐labs/INTRO-‐wireshark-‐file1.html <br />
and have that page displayed in your browser. In order to display this page, your <br />
browser will contact the HTTP server at gaia.cs.umass.edu and exchange HTTP <br />
messages with the server in order to download this page, as discussed in section <br />
2.2 of the text. The Ethernet frames containing these HTTP messages (as well as <br />
all other frames passing through your Ethernet adapter) will be captured by <br />
<strong>Wireshark</strong>. <br />
7. After your browser has displayed the INTRO-‐wireshark-‐file1.html page (it is a <br />
simple one line of congratulations), stop <strong>Wireshark</strong> packet capture by selecting <br />
stop in the <strong>Wireshark</strong> capture window. The main <strong>Wireshark</strong> window should <br />
now look similar to Figure 3. You now have live packet data that contains all <br />
protocol messages exchanged between your computer and other network <br />
entities! The HTTP message exchanges with the gaia.cs.umass.edu web server <br />
should appear somewhere in the listing of packets captured. But there will be <br />
many other types of packets displayed as well (see, e.g., the many different <br />
protocol types shown in the Protocol column in Figure 3). Even though the only <br />
action you took was to download a web page, there were evidently many other <br />
protocols running on your computer that are unseen by the user. We’ll learn <br />
much more about these protocols as we progress through the text! For now, <br />
you should just be aware that there is often much more going on than “meet’s <br />
the eye”!
8. Type in “http” (without the quotes, and in lower case – all protocol names are in <br />
lower case in <strong>Wireshark</strong>) into the display filter specification window at the top of the <br />
main <strong>Wireshark</strong> window. Then select Apply (to the right of where you entered <br />
“http”). This will cause only HTTP message to be displayed in the packet-‐listing <br />
window. <br />
9. Find the HTTP GET message that was sent from your computer to the <br />
gaia.cs.umass.edu HTTP server. (Look for an HTTP GET message in the “listing of <br />
captured packets” portion of the <strong>Wireshark</strong> window (see Figure 3) that shows “GET” <br />
followed by the gaia.cs.umass.edu URL that you entered. When you select the HTTP <br />
GET message, the Ethernet frame, IP datagram, TCP segment, and HTTP message <br />
header information will be displayed in the packet-‐header window 2 . By clicking on ‘+’ <br />
and ‘-‐‘ right-‐pointing and down-‐pointing arrowheads to the left side of the packet <br />
details window, minimize the amount of Frame, Ethernet, Internet Protocol, and <br />
Transmission Control Protocol information displayed. Maximize the amount <br />
information displayed about the HTTP protocol. Your <strong>Wireshark</strong> display should now <br />
look roughly as shown in Figure 5. (Note, in particular, the minimized amount of <br />
protocol information for all protocols except HTTP, and the maximized amount of <br />
protocol information for HTTP in the packet-‐header window). <br />
10. Exit <strong>Wireshark</strong> <br />
Congratulations! You’ve now completed the first lab. <br />
2 <br />
Recall that the HTTP GET message that is sent to the gaia.cs.umass.edu web server is contained <br />
within a TCP segment, which is contained (encapsulated) in an IP datagram, which is <br />
encapsulated in an Ethernet frame. If this process of encapsulation isn’t quite clear yet, review <br />
section 1.5 in the text
Figure 5: <strong>Wireshark</strong> window after step 9
What to hand in<br />
The goal of this first lab was primarily to introduce you to <strong>Wireshark</strong>. The following questions <br />
will demonstrate that you’ve been able to get <strong>Wireshark</strong> up and running, and have explored <br />
some of its capabilities. Answer the following questions, based on your <strong>Wireshark</strong> <br />
experimentation: <br />
1. List 3 different protocols that appear in the protocol column in the unfiltered packet-listing<br />
window in step 7 above. <br />
2. How long did it take from when the HTTP GET message was sent until the HTTP OK <br />
reply was received (By default, the value of the Time column in the packet-‐listing <br />
window is the amount of time, in seconds, since <strong>Wireshark</strong> tracing began. To display the <br />
Time field in time-‐of-‐day format, select the <strong>Wireshark</strong> View pull down menu, then select <br />
Time Display Format, then select Time-‐of-‐day.) <br />
3. What is the Internet address of the gaia.cs.umass.edu (also known as www-net.cs.umass.edu)<br />
What is the Internet address of your computer <br />
4. Print the two HTTP messages (GET and OK) referred to in question 2 above. To do so, <br />
select Print from the <strong>Wireshark</strong> File command menu, and select the “Selected Packet <br />
Only” and “Print as displayed” radial buttons, and then click OK.