Fact Book 2013 - Chandler-Gilbert Community College - Maricopa ...
Fact Book 2013 - Chandler-Gilbert Community College - Maricopa ...
Fact Book 2013 - Chandler-Gilbert Community College - Maricopa ...

Create successful ePaper yourself
Turn your PDF publications into a flip-book with our unique Google optimized e-Paper software.
<strong>Fact</strong> <strong>Book</strong> <strong>2013</strong><br />
The college of you.<br />
An EEO/AA institution<br />
1
Table of Contents<br />
Enrollment<br />
Fiscal Year Enrollment 2<br />
Fiscal Year Full-time Student<br />
Equivalent by Location 3<br />
Fall Enrollment 4<br />
Fall Full-time Student Equivalent<br />
by Location 5<br />
Fall Dual Enrollment 6<br />
Demographics<br />
Demographic Summary 7<br />
Age and Gender 8<br />
Ethnicity 9<br />
Enrollment Type 10<br />
Time of Attendance 11<br />
International Students 12<br />
Fall Student Residence 13<br />
Fall 2012 Students By ZIP Code 14<br />
Fall 2012 New High School Graduates 15<br />
Outcomes<br />
Graduates 16<br />
Transfer Students 17<br />
Awards at Transfer Institution 18<br />
Completion Agenda 19<br />
Human Resources<br />
Employees 20<br />
Facilities<br />
Facilities 21-22<br />
Financials<br />
Adopted Budget 23<br />
Financial Comparisons 24<br />
<strong>Community</strong><br />
Population 25-26<br />
Labor Statistics 27<br />
<strong>Chandler</strong>-<strong>Gilbert</strong> <strong>Community</strong> <strong>College</strong> • <strong>Fact</strong> <strong>Book</strong> <strong>2013</strong><br />
1
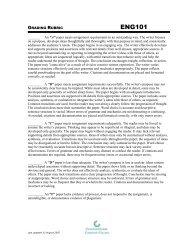
Fiscal Year Enrollment<br />
The headcount is the unduplicated number of students who attended during the fiscal year (fall, spring, and summer). One full-time<br />
student equivalent (FTSE) takes 30 credit hours in a fiscal year. Fiscal year FTSE is reported as credit hours divided by 30 credit hours.<br />
In the final fiscal year calculations, fall and spring are added together and divided by 2 (averaged) so it equals 30 credit hours to 1 FTSE.<br />
Fiscal year FTSE includes the average from fall and spring, as well as summer, short-term, and open-entry/open-exit.<br />
12-13<br />
11-12<br />
10-11<br />
09-10<br />
Enrollment<br />
Fiscal Year<br />
08-09<br />
07-08<br />
06-07<br />
05-06<br />
04-05<br />
03-04<br />
02-03<br />
0 2,000 4,000 6,000 8,000 10,000 12,000 14,000 16,000 18,000 20,000<br />
Number of Students<br />
FTSE<br />
Headcount<br />
Fiscal Year 02-03 03-04 04-05 05-06 06-07 07-08 08-09 09-10 10-11 11-12 12-13<br />
Headcount 12,179 12,416 12,707 13,240 14,033 15,101 15,696 16,388 17,938 19,611 19,791<br />
Yearly Change 13.7% 1.9% 2.3% 4.2% 6.0% 7.6% 3.9% 4.4% 9.5% 9.3% 0.9%<br />
FTSE 3,847.5 4,217.8 4,428.4 4,500.7 4,802.7 5,302.4 5,683.3 6,464.9 7,206.1 7,829.8 8,047.4<br />
Yearly Change 14.6% 9.6% 5.0% 1.6% 6.7% 10.4% 7.2% 13.8% 11.5% 8.7% 2.8%<br />
Source: <strong>Maricopa</strong> Trends<br />
10 Year Change in Headcount<br />
59.4%<br />
<strong>Chandler</strong>-<strong>Gilbert</strong> <strong>Community</strong> <strong>College</strong> • <strong>Fact</strong> <strong>Book</strong> <strong>2013</strong><br />
2
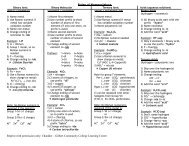
Fiscal Year FTSE by Location<br />
One full-time student equivalent (FTSE) takes 30 credit hours in a fiscal year. Fiscal year FTSE is reported as credit hours divided by<br />
30 credit hours. In the final fiscal year calculations, fall and spring are added together and divided by 2 (averaged) so it equals 30 credit<br />
hours to 1 FTSE. Fiscal year FTSE includes the average from fall and spring, as well as summer, short-term, and open-entry/open-exit.<br />
Effective fall 2011, CGCC became a coordinating college for dual enrollment. “Other” represents the dual enrollment locations, the high<br />
schools that offer dual enrollment classes.<br />
<strong>2013</strong><br />
2012<br />
2011<br />
2010<br />
Enrollment<br />
Fiscal Year<br />
2009<br />
2008<br />
2007<br />
2006<br />
2005<br />
2004<br />
2003<br />
0 1,000 2,000 3,000 4,000 5,000 6,000 7,000<br />
FTSE<br />
Fiscal Year 2003 2004 2005 2006 2007 2008 2009 2010 2011 2012 <strong>2013</strong><br />
Pecos 2,984.7 3,303.1 3,501.9 3,568.1 3,802.5 4,237.3 4,641.2 5,344.4 6,018.1 5,980.8 5,959.2<br />
Williams 636.5 699.4 655.1 686.3 701.4 734.7 732.6 902.7 963.0 963.4 1,002.5<br />
Other 222.6 211.6 267.9 242.3 298.6 327.9 305.6 213.3 218.3 881.9 1,085.6<br />
Sun Lakes 3.7 3.7 3.6 4.0 0.3 2.5 3.9 4.5 6.7 3.7 0.0<br />
Total 3,847.5 4,217.8 4,428.4 4,500.7 4,802.7 5,302.4 5,683.3 6,464.9 7,206.1 7,829.8 8,047.4<br />
Source: <strong>Maricopa</strong> Trends<br />
10 Year Percent Change<br />
43.3%<br />
<strong>Chandler</strong>-<strong>Gilbert</strong> <strong>Community</strong> <strong>College</strong> • <strong>Fact</strong> <strong>Book</strong> <strong>2013</strong><br />
3
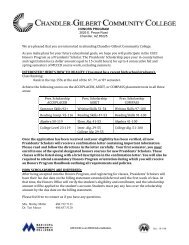
Fall Enrollment<br />
The headcount is the unduplicated number of students at the census day, the 45th day of the semester. For the full-time student<br />
equivalent (FTSE), one student takes 15 credit hours in the fall. Fall FTSE is reported as credit hours divided by 15 credit hours.<br />
2012<br />
2011<br />
2010<br />
2009<br />
Enrollment<br />
Fall<br />
2008<br />
2007<br />
2006<br />
2005<br />
2004<br />
2003<br />
0 2,000 4,000 6,000 8,000 10,000 12,000 14,000 16,000<br />
FTSE<br />
Headcount<br />
Number of Students<br />
Fall Semester 2003 2004 2005 2006 2007 2008 2009 2010 2011 2012<br />
Headcount 8,025 8,663 8,940 9,420 10,277 10,409 11,058 12,296 14,030 14,653<br />
Yearly Change 6.8% 8.0% 3.2% 5.4% 9.1% 1.3% 6.2% 11.2% 14.1% 4.4%<br />
FTSE 3,948.5 4,277.5 4,348.7 4,642.6 5,150.2 5,419.9 6,020.1 6,743.9 7,642.1 7,954.4<br />
Yearly Change 10.1% 8.3% 1.7% 6.8% 10.9% 5.2% 11.1% 12.0% 13.3% 4.1%<br />
Source: <strong>Maricopa</strong> Trends<br />
10 Year Change in Headcount<br />
82.6%<br />
<strong>Chandler</strong>-<strong>Gilbert</strong> <strong>Community</strong> <strong>College</strong> • <strong>Fact</strong> <strong>Book</strong> <strong>2013</strong><br />
4
Fall FTSE by Location<br />
For the full-time student equivalent (FTSE), one student takes 15 credit hours in the fall. Fall FTSE is reported as credit hours divided by<br />
15 credit hours. Effective fall 2011, CGCC became a coordinating college for dual enrollment. “Other” represents the dual enrollment<br />
locations, the high schools that offer dual enrollment classes.<br />
2012<br />
2011<br />
2010<br />
2009<br />
Enrollment<br />
Fiscal Year<br />
2008<br />
2007<br />
2006<br />
2005<br />
2004<br />
2003<br />
0 1,000 2,000 3,000 4,000 5,000 6,000 7,000<br />
FTSE<br />
Fall Semester 2003 2004 2005 2006 2007 2008 2009 2010 2011 2012<br />
Pecos 3,002.6 3,231.5 3,307.6 3,494.1 4,026.5 4,272.1 4,834.3 5,519.5 5,569.1 5,636.3<br />
Williams 623.0 602.5 627.7 656.4 667.3 624.8 799.5 819.1 836.2 863.5<br />
Other 319.2 443.6 408.0 492.1 500.9 527.8 377.3 391.9 1,232.1 1,454.6<br />
Sun Lakes 3.7 0.0 5.4 0.0 3.0 7.8 9.0 13.3 4.8 0.0<br />
Total 3,948.5 4,277.6 4,348.7 4,642.6 5,197.6 5,432.5 6,020.1 6,743.9 7,642.1 7,954.4<br />
Source: <strong>Maricopa</strong> Trends<br />
<strong>Chandler</strong>-<strong>Gilbert</strong> <strong>Community</strong> <strong>College</strong> • <strong>Fact</strong> <strong>Book</strong> <strong>2013</strong><br />
10 Year Percent Change<br />
101.5%<br />
5
Fall Dual Enrollment<br />
Dual enrollment began in 1998 and allows eligible high school students to earn lower-division college credit during their regular high<br />
school classes. The credits students earn through dual enrollment are treated the same as regular college credit. The courses are held on<br />
high school campuses and are taught by high school instructors who have met community college hiring qualificiations. One full- time<br />
student takes 15 credit hours in the fall. Fall FTSE is reported as credit hours divided by 15 credit hours. The course enrollment breakdown<br />
for fall 2012 was mathematics-31.3%; foreign languages and sign language-22%; English-21.6%; and sciences-16.7%. The remaining<br />
enrollment was in history, political science, psychology, business, computers, and art.<br />
2012<br />
2011<br />
2010<br />
Enrollment<br />
Fall<br />
2009<br />
2008<br />
2007<br />
2006<br />
2005<br />
2004<br />
2003<br />
0 500 1,000 1,500 2,000 2,500 3,000 3,500 4,000<br />
Number of Students<br />
Fall Semester 2003 2004 2005 2006 2007 2008 2009 2010 2011 2012<br />
Headcount 843 1,193 1,168 1,388 1,399 1,330 1,049 1,108 2,937 3,538<br />
Yearly Change 5.8% 41.5% -2.1% 18.8% 0.8% -4.9% -21.1% 5.6% 165.1% 20.5%<br />
% of <strong>College</strong> Fall Headcount 10.5% 13.8% 13.1% 14.7% 13.6% 12.8% 9.5% 9.0% 20.9% 24.1%<br />
FTSE 286.6 393.7 384.5 467.2 489.3 458.5 357.8 363.9 1,224.9 1,447.1<br />
Yearly Change 5.8% 37.4% -2.3% 21.5% 4.7% -6.3% -22.0% 1.7% 236.6% 18.1%<br />
% of <strong>College</strong> 45th Day FTSE 7.3% 9.2% 8.8% 10.1% 9.4% 8.4% 5.9% 5.4% 16.0% 18.2%<br />
Source: <strong>Maricopa</strong> Data Warehouse<br />
<strong>Chandler</strong>-<strong>Gilbert</strong> <strong>Community</strong> <strong>College</strong> • <strong>Fact</strong> <strong>Book</strong> <strong>2013</strong><br />
10 Year Change<br />
319.7% Headcount<br />
210.9% FTSE<br />
6
Demographic Summary<br />
Description of the student population in Fall 2012.<br />
Demographics<br />
STUDENT INFORMATION<br />
OTHER INFORMATION<br />
Students 14,653 Full-time faculty 133<br />
GENDER ETHNICITY/RACE Part-time faculty 500<br />
Female 46% American Indian or Alaska Native 2%<br />
Male 53% Asian 5%<br />
Undeclared 1% Black or African American 4%<br />
AGE Hispanic/Latino 19%<br />
15-19 52% Native Hawaiian or Pacific Islander 0%<br />
20-24 24% White 53%<br />
25-29 8% Two or More Races 2%<br />
30-39 9% Race and Ethnicity Unknown 14%<br />
40-49 5% Nonresident Alien 1%<br />
50-59 2% ACADEMIC LOAD<br />
60+ 7% Full-time 31%<br />
Undeclared 0% Part-time 69%<br />
Source: <strong>Maricopa</strong> Data Warehouse and Integrated Postsecondary Education Data System (IPEDS) Fall Enrollment Report.<br />
Term-to-Term Persistence<br />
Fall to Spring: 66.33% National Percentile: 19%<br />
This is the percent of students who were enrolled in the fall<br />
who re-enrolled in the spring term. The national percentile<br />
indicates that 81% of community colleges have a higher fall to<br />
spring persistence rate.<br />
Fall to Fall: 43.11% National Percentile: 18%<br />
This is the percent of students who enrolled in fall and who<br />
returned the next fall term. The national percentile indicates that<br />
82% of community colleges have a higher fall to fall<br />
persistence rate.<br />
Class Size and Student/Faculty Ratio<br />
Average Class Size: 23.29 National Percentile: 86%<br />
The national percentile indicates that 85% of community colleges<br />
have smaller classes.<br />
Student/Faculty Ratio: 19.35 National Percentile: 59%<br />
The national percentile indicates that 58% of community colleges<br />
have fewer students to faculty.<br />
Source: National <strong>Community</strong> <strong>College</strong> Benchmark Project (NCCBP), 2012<br />
<strong>Chandler</strong>-<strong>Gilbert</strong> <strong>Community</strong> <strong>College</strong> • <strong>Fact</strong> <strong>Book</strong> <strong>2013</strong><br />
7
Age and Gender<br />
Description of the student population in fall 2012 compared with faculty, staff and service area population. Core area includes<br />
<strong>Chandler</strong>, <strong>Gilbert</strong>, Queen Creek and Sun Lakes.<br />
Fall 2002<br />
Core Area<br />
Under 25,<br />
62.5%<br />
25-49, 31.7%<br />
CGCC Staff<br />
Demographics<br />
Under 25,<br />
71.3%<br />
25-49, 25.1%<br />
Under 25,<br />
75.0%<br />
50+, 4.1%<br />
Undeclared,<br />
1.7%<br />
Fall 2007<br />
50+, 2.7%<br />
Undeclared,<br />
1.0%<br />
25-49,<br />
21.6%<br />
Fall 2012<br />
50+, 2.5%<br />
Undeclared,<br />
1.0%<br />
CGCC Median Age: 20 National Percentile: 13%<br />
Students at 87% of community colleges are older.<br />
Source: National <strong>Community</strong> <strong>College</strong> Benchmark Project (NCCBP), 2012<br />
CGCC Faculty<br />
CGCC Students<br />
Gender<br />
0% 20% 40% 60% 80% 100%<br />
CGCC<br />
Students<br />
14,653<br />
Students<br />
Female Male Undeclared<br />
CGCC<br />
Faculty<br />
133 Fulltime<br />
Faculty<br />
CGCC<br />
Staff<br />
206 Fulltime<br />
Staff<br />
Core Area<br />
Population<br />
of 488,129<br />
Female 53% 59% 57% 51%<br />
Male 46% 41% 43% 49%<br />
Undeclared 1% - 0% 0%<br />
Source: <strong>Maricopa</strong> Trends; Integrated Postsecondary Education Data System (IPEDS)<br />
Human Resources Report, 2007-2011 American <strong>Community</strong> Survey 5-Year Estimate;<br />
Arizona Department of Administration Office of Employment and Population<br />
Statistics July 1, 2012, Population Estimates.<br />
<strong>Chandler</strong>-<strong>Gilbert</strong> <strong>Community</strong> <strong>College</strong> • <strong>Fact</strong> <strong>Book</strong> <strong>2013</strong><br />
8
Ethnicity<br />
Description of the student population in fall 2012 compared with faculty, staff and service area population. Core area includes<br />
<strong>Chandler</strong>, <strong>Gilbert</strong>, Queen Creek and Sun Lakes.<br />
Core Area<br />
American Indian or Alaska Native<br />
Asian<br />
Demographics<br />
CGCC Staff Fall 2012<br />
CGCC Faculty Fall 2012<br />
CGCC Fall 2012 Student<br />
Ethnicity/Race<br />
0% 10% 20% 30% 40% 50% 60% 70% 80% 90% 100%<br />
CGCC Fall 2012<br />
Student<br />
CGCC Faculty Fall<br />
2012<br />
CGCC Staff Fall 2012<br />
Black or African American<br />
Hispanic/Latino<br />
Native Hawaiian or Pacific Islander<br />
Core Area<br />
14,653 Students 133 Full-time Faculty 206 Full-time Staff Population of 488,129<br />
American Indian or Alaska Native 2% 0% 2% 1%<br />
Asian 5% 5% 2% 6%<br />
Black or African American 4% 6% 7% 4%<br />
Hispanic/Latino 19% 14% 24% 18%<br />
Native Hawaiian or Pacific Islander 0% 0% 0% 0%<br />
White 53% 74% 62% 68%<br />
Two or More Races 2% 2% 1% 2%<br />
Race and Ethnicity Unknown 14% 0% 0% 0%<br />
Nonresident Alien 1% 0% 0% -<br />
Source: <strong>Maricopa</strong> Data Warehouse, Integrated Postsecondary Education Data System (IPEDS) Human Resources Report, and 2007-2011 American <strong>Community</strong> Survey 5-Year<br />
Estimate.<br />
<strong>Chandler</strong>-<strong>Gilbert</strong> <strong>Community</strong> <strong>College</strong> • <strong>Fact</strong> <strong>Book</strong> <strong>2013</strong><br />
9<br />
White<br />
Two or More Races<br />
Race and Ethnicity Unknown<br />
Nonresident Alien
Enrollment Type<br />
New students attended CGCC for the first time in the fall or the previous summer. Former students attended CGCC the previous<br />
fall or any term before that. Continuing students attended CGCC the previous spring semester. Full-time students take 12 or<br />
more credit hours in a semester, while part-time students take less than 12 credit hours in a semester.<br />
Fall 2002<br />
100%<br />
Demographics<br />
Continuing,<br />
40.2%<br />
New, 46.5%<br />
Continuing,<br />
39.7%<br />
Former,<br />
13.4%<br />
New, 47.1%<br />
Continuing,<br />
42.4%<br />
Former,<br />
13.1%<br />
Fall 2007<br />
New, 44.9%<br />
Fall 2012<br />
Former,<br />
12.8%<br />
90%<br />
80%<br />
70%<br />
60%<br />
50%<br />
40%<br />
30%<br />
20%<br />
10%<br />
0%<br />
Full-time /<br />
Part-time<br />
Status<br />
2002 2007 2012<br />
Students<br />
Fall Semester<br />
2002 2007 2012<br />
% of<br />
Total<br />
Students<br />
% of<br />
Total<br />
Students<br />
Part-time<br />
Full-time<br />
% of<br />
Total<br />
Full-time 1,907 25.4% 3,011 29.3% 4,501 30.7%<br />
Part-time 5,606 74.6% 7,266 70.7% 10,152 69.3%<br />
Total 7,513 100.0% 10,277 100.0% 14,653 100.0%<br />
Source: <strong>Maricopa</strong> Trends<br />
<strong>Chandler</strong>-<strong>Gilbert</strong> <strong>Community</strong> <strong>College</strong> • <strong>Fact</strong> <strong>Book</strong> <strong>2013</strong><br />
10
Time of Attendance<br />
The primary time of attendance reflects when students take most of their classes. Classes starting prior to 4:30 p.m. are classified as<br />
“Day”; classes starting 4:30 p.m. or later are “Evening”; classes scheduled on Saturday or Sunday are “Weekend”; classes that do not have a<br />
designated time or location, such as online, are classified as “Non-traditional.”<br />
100%<br />
90%<br />
80%<br />
Demographics<br />
Percent of Headcount<br />
70%<br />
60%<br />
50%<br />
40%<br />
30%<br />
20%<br />
10%<br />
0%<br />
Primary Time of<br />
Attendance by<br />
Category<br />
Students<br />
Fall Semester<br />
2007 2008 2009<br />
2010 2011 2012<br />
% of<br />
Total<br />
Students<br />
% of<br />
Total<br />
Students<br />
% of<br />
Total<br />
Students<br />
<strong>Chandler</strong>-<strong>Gilbert</strong> <strong>Community</strong> <strong>College</strong> • <strong>Fact</strong> <strong>Book</strong> <strong>2013</strong><br />
% of<br />
Total<br />
Students<br />
% of<br />
Total<br />
Students<br />
Day 7,606 74.0% 6,072 58.3% 6,751 61.1% 7,806 63.5% 7,749 55.2% 7,744 52.8%<br />
Evening 2,671 26.0% 2,110 20.3% 2,209 20.0% 2,150 17.5% 2,152 15.3% 2,115 14.4%<br />
Weekend 316 3.0% 386 3.5% 388 3.2% 332 2.4% 276 1.9%<br />
Non-traditional 1,889 18.1% 1,694 15.3% 1,938 15.8% 3,784 27.0% 4,515 30.8%<br />
Unknown 22 0.2% 18 0.2% 14 0.1% 13 0.1% 3 0.0%<br />
Total 10,277 100% 10,409 100% 11,058 100% 12,296 100% 14,030 100% 14,653 100%<br />
Source: <strong>Maricopa</strong> Trends<br />
Fall 2007 Fall 2008 Fall 2009 Fall 2010 Fall 2011 Fall 2012<br />
Weekend<br />
Non-traditional<br />
Evening<br />
Day<br />
% of<br />
Total<br />
11
International Students<br />
Students with a Visa include F-1 student, F-2 student spouse, diplomatic, exchange visitor, temporary visitors for business, pleasure or<br />
special occupation; employment authorization; finance, treaty, or investment traders; and the dependents for any of the foregoing.<br />
600<br />
500<br />
Demographics<br />
Number of Students<br />
400<br />
300<br />
200<br />
100<br />
0<br />
International Students Visa<br />
Status<br />
2007 2008 2009 2010 2011 2012<br />
Fall Semster<br />
Fall Semester<br />
2007 2008 2009 2010 2011 2012<br />
Students % of<br />
Total<br />
Students<br />
% of<br />
Total<br />
Students<br />
% of<br />
Total<br />
Students<br />
% of<br />
Total<br />
Students<br />
% of<br />
Total<br />
Students with a Visa<br />
Permanent Resident<br />
Refugee<br />
Students<br />
% of<br />
Total<br />
Students with a Visa 111 1.1% 106 1.0% 99 0.9% 115 0.9% 76 0.5% 74 0.5%<br />
Permanent Resident 447 4.3% 430 4.1% 484 4.4% 510 4.1% 527 3.8% 521 3.6%<br />
Refugee 9 0.1% 8 0.1% 7 0.1% 10 0.1% 9 0.1% 16 0.1%<br />
Total International<br />
Students<br />
567 5.5% 544 5.2% 590 5.3% 635 5.2% 612 4.4% 611 4.2%<br />
Total <strong>College</strong> Enrollment 10,277 10,409 11,058 12,296 14,030 14,653<br />
Source: <strong>Maricopa</strong> Data Warehouse<br />
<strong>Chandler</strong>-<strong>Gilbert</strong> <strong>Community</strong> <strong>College</strong> • <strong>Fact</strong> <strong>Book</strong> <strong>2013</strong><br />
12
Fall Student Residence<br />
Students by East Valley, CGCC Core Area and city. Core Area includes <strong>Chandler</strong>, <strong>Gilbert</strong>, Queen Creek and Sun Lakes. ZIP codes were<br />
used to obtain population figures for Ahwatukee.<br />
Demographics<br />
Fall 45th Day<br />
East Valley by City 2002 2007 2012<br />
Ahwatukee 138 313 517<br />
Apache Junction 44 49 41<br />
<strong>Chandler</strong> 2,375 3,206 4,239<br />
<strong>Gilbert</strong> 2,584 3,564 5,576<br />
Mesa 1,334 1,310 1,843<br />
Queen Creek and San Tan Valley 253 893 1,472<br />
Sun Lakes 1 2<br />
Tempe 273 207 243<br />
Total 7,002 9,542 13,933<br />
% of All Students 93% 93% 95%<br />
Core Area 2002 2007 2012<br />
Total 5,213 7,663 11,289<br />
% of All Students 69% 75% 77%<br />
Total Fall Students 7,513 10,277 14,653<br />
Source: <strong>Maricopa</strong> Data Warehouse<br />
Student Success in Courses<br />
Percent of Student Population<br />
East Valley and Core Area Students as a<br />
Percent of the Total Student Population<br />
100%<br />
90%<br />
80%<br />
70%<br />
60%<br />
50%<br />
40%<br />
30%<br />
20%<br />
10%<br />
0%<br />
2002 2007 2012<br />
Fall<br />
East Valley<br />
Core Area<br />
Success Rate: 74.85% National Percentile: 54%<br />
The success rate is the number of students who received a grade of A, B, C, or P divided by all students who enrolled in courses numbered<br />
100 and above. This means that nearly 75% of the students received an A, B, C, or P, and about 25% received grades of D, F, W or<br />
withdrawal failing. The national percentile indicates that 53% of community colleges have fewer students who succeeded in courses<br />
(receive grades of A, B, C, or P) and more who fail, withdraw or get a D.<br />
Source: National <strong>Community</strong> <strong>College</strong> Benchmark Project (NCCBP), 2012<br />
<strong>Chandler</strong>-<strong>Gilbert</strong> <strong>Community</strong> <strong>College</strong> • <strong>Fact</strong> <strong>Book</strong> 2012 <strong>2013</strong><br />
13
Fall 2012 Students By ZIP Code<br />
Students who graduated from high school in 2012 and attended CGCC in Fall 2012.<br />
Demographics<br />
<strong>Chandler</strong>-<strong>Gilbert</strong> <strong>Community</strong> <strong>College</strong> • <strong>Fact</strong> <strong>Book</strong> <strong>2013</strong><br />
Source: <strong>Maricopa</strong> Data Warehouse<br />
14
Fall 2012 New High School Graduates<br />
Students who graduated from high school in 2012 and attended CGCC in fall 2012.<br />
Demographics<br />
Districts and<br />
High Schools<br />
2012 East Valley High School Graduates at CGCC in Fall 2012 by School District<br />
% of 2012 EV<br />
% of 2012 EV<br />
Districts and<br />
Districts and<br />
Students HS Grads at<br />
Students HS Grads at<br />
Students<br />
High Schools<br />
High Schools<br />
CGCC Fall 2012<br />
CGCC Fall 2012<br />
<strong>Chandler</strong> High School District Higley High School District Tempe High School District<br />
% of 2012 EV<br />
HS Grads at<br />
CGCC Fall 2012<br />
Basha 135 9.2% Higley 52 3.5% Compadre 2 0.1%<br />
<strong>Chandler</strong> 99 6.7% Williams Field 64 4.3% Corona del Sol 48 3.3%<br />
Hamilton 139 9.4% Total 116 7.9% Desert Vista 63 4.3%<br />
Perry 110 7.5% Queen Creek High School District Marco de Niza 7 0.5%<br />
Total 483 32.7% Queen Creek 69 4.7% McClintock 4 0.3%<br />
<strong>Gilbert</strong> High Scool District Total 69 4.7% Mt. Point 44 3.0%<br />
Campo Verde 1 0.1% Mesa High School District Tempe 2 0.1%<br />
Desert Ridge 73 4.9% Dobson 21 1.4% Total 170 11.5%<br />
<strong>Gilbert</strong> 142 9.6% Mesa 27 1.8% Charters & Private High Schools<br />
Highland 94 6.4%<br />
Mesa Distance<br />
Learning<br />
1 0.1%<br />
Charters &<br />
Private<br />
107 7.3%<br />
Mesquite 135 9.2% Mountain View 9 0.6% Total 107 7.3%<br />
Total 445 30.2% Red Mountain 11 0.7% Apache Junction District<br />
Skyline 14 0.9% Apache Junction 1 0.1%<br />
Westwood 1 0.1% Total 1 0.1%<br />
Total 84 5.7% Source: <strong>Maricopa</strong> Data Warehouse<br />
All 2012 High School Graduates Students Percent<br />
East Valley 1,475 83.6%<br />
All Other Arizona HS 111 6.3%<br />
Out-of-State and Other U.S. 103 5.8%<br />
Foreign 14 0.8%<br />
Unknown/Other 62 3.5%<br />
Total 1,765 100.0%<br />
<strong>Chandler</strong>-<strong>Gilbert</strong> <strong>Community</strong> <strong>College</strong> • <strong>Fact</strong> <strong>Book</strong> <strong>2013</strong><br />
15
Graduates<br />
Students can earn multiple degrees and certificates. The most common combination of awards is an associates degree and the Arizona<br />
General Education Certificate (AGEC). The AGEC allows students to transfer their general eduation credits to Arizona universities as a<br />
block. The total students provides an unduplicated count of the number of students that earned a degree, certificate or multiple awards.<br />
Outcomes<br />
Number of Awards<br />
2,000<br />
1,800<br />
1,600<br />
1,400<br />
1,200<br />
1,000<br />
800<br />
600<br />
400<br />
200<br />
0<br />
Fiscal Year<br />
2007-08 2008-09 2009-10 2010-11 2011-12<br />
Degrees 416 514 545 747 925<br />
Certificates 216 170 167 168 167<br />
AGECs 219 409 473 607 765<br />
Total Awards 851 1,093 1,185 1,522 1,857<br />
Total Students 550 631 673 889 1,035<br />
Source: <strong>Maricopa</strong> Data Warehouse.<br />
2007-08 2008-09 2009-10 2010-11 2011-12<br />
Fiscal Year<br />
Number of Degrees and<br />
Certificates Earned<br />
2,000<br />
1,800<br />
1,600<br />
1,400<br />
1,200<br />
1,000<br />
800<br />
600<br />
400<br />
200<br />
0<br />
Percent of First-Time Degree-Seeking Students Who Receive a Degree Within Three Years<br />
CGCC Percentage: 16.85% National Percentile: 39%<br />
This means that 61% of community colleges have a higher percentage of students graduating in three years.<br />
Source: National <strong>Community</strong> <strong>College</strong> Benchmarking Project (NCCBP), 2012<br />
<strong>Chandler</strong>-<strong>Gilbert</strong> <strong>Community</strong> <strong>College</strong> • <strong>Fact</strong> <strong>Book</strong> <strong>2013</strong><br />
16
Transfer Students<br />
Transfers are CGCC students who transferred 12 or more credit hours from CGCC to either Arizona State University, Northern Arizona<br />
University or University of Arizona.<br />
Arizona State University Northern Arizona University University of Arizona<br />
Outcomes<br />
2012<br />
2011<br />
2010<br />
2009<br />
2008<br />
Fall<br />
0 1,000 2,000 3,000<br />
New Transfer ASU<br />
Total Attending ASU<br />
Total Attending<br />
ASU<br />
New Transfer<br />
ASU<br />
2012<br />
2011<br />
2010<br />
2009<br />
2008<br />
0 200 400 600<br />
Total Attending<br />
NAU<br />
New Transfer NAU<br />
Total Attending NAU<br />
New Transfer<br />
NAU<br />
Total Attending<br />
UA<br />
2012<br />
2011<br />
2010<br />
2009<br />
2008<br />
0 100 200 300<br />
New<br />
Transfer UA<br />
New Transfer UA<br />
Total Attending UA<br />
Total<br />
Attending<br />
New<br />
Transfer<br />
2008 2,143 401 236 71 159 17 2,538 489<br />
2009 2,245 502 308 94 175 32 2,728 628<br />
2010 2,405 511 388 147 199 28 2,992 686<br />
2011 2,384 514 458 166 219 43 3,061 723<br />
2012 2,541 624 527 160 254 37 3,322 821<br />
Source: Articulation System Stimulating Interinstitutional Student Transfer (ASSIST).<br />
Performance After Transfer<br />
GPA First Year After Transfer: 3.0 National Percentile: 75%<br />
Average Number of Credits Completed: 20.82 National Percentile: 50%<br />
Percent Enrolled in University for Second Year: 89.05% National Percentile: 95%<br />
<strong>Chandler</strong>-<strong>Gilbert</strong> <strong>Community</strong> <strong>College</strong> • <strong>Fact</strong> <strong>Book</strong> <strong>2013</strong><br />
This means 74% of community colleges report<br />
transfer GPAs of less than 3.0; 94% report a<br />
lower university second year enrollment rate;<br />
and, 49% of community college students<br />
complete fewer university credit hours.<br />
Source: National <strong>Community</strong> <strong>College</strong> Benchmark Project<br />
(NCCBP), 2012.<br />
17
Awards at Transfer Institution<br />
Awards at the transfer institution provides the number of CGCC transfer students that received a degree at Arizona State University,<br />
Northern Arizona University or University of Arizona.<br />
2,200<br />
2,000<br />
1,800<br />
1,600<br />
1,400<br />
Outcomes<br />
Degrees<br />
1,200<br />
1,000<br />
800<br />
600<br />
400<br />
200<br />
0<br />
2007-08 2008-09 2009-10 2010-11 2011-12<br />
Year<br />
ASU NAU UA<br />
Year ASU NAU UA Total<br />
2007-08 1,221 160 77 1,458<br />
2008-09 1,333 151 101 1,585<br />
2009-10 1,392 175 93 1,660<br />
2010-11 1,568 220 151 1,939<br />
2011-12 1,593 269 140 2,002<br />
Source: Articulation System Stimulating Interinstitutional Student<br />
Transfer (ASSIST).<br />
<strong>Chandler</strong>-<strong>Gilbert</strong> <strong>Community</strong> <strong>College</strong> • <strong>Fact</strong> <strong>Book</strong> <strong>2013</strong><br />
18
Completion Agenda<br />
Outcomes<br />
ACCESS<br />
PATHWAYS<br />
COMPLETION<br />
Completion Agenda: Access, Persistence/Retention and Completion<br />
Indicator Measure District NCCBP CGCC<br />
High School<br />
Graduates<br />
Faculty<br />
Ratios<br />
Instructional<br />
Delivery<br />
Mode<br />
Successful<br />
Course<br />
Completion<br />
Student<br />
Persistence<br />
Successful<br />
Transfer to<br />
Ariz Public<br />
Universities<br />
Degree and<br />
Program<br />
Graduated 2010-Attended summer I and II, fall 2010 and spring 2011* 16,574 N/A 2,258<br />
Percent Prior Year High School Graduates Enrolled 27.8% 21.9% 19.0%<br />
Average Credit Section Size 22.1 19.7 23.3<br />
Faculty/Student Ratio 16.5 18.3 19.4<br />
Percent Credit Hours Taught by Full-Time Faculty 37.4% 50.3% 38.9%<br />
Percent Credit Hours Taught by Part-Time Faculty 62.6% 49.7% 61.1%<br />
Percent Sections Taught by Full-Time Faculty 34.7% 48.1% 36.0%<br />
Percent Sections Taught by Part-Time Faculty 65.3% 51.9% 64.0%<br />
Number of Online Sections 3,509 N/A 127<br />
Distance Learning Percent of Credit Hours 19.2% 12.7% 7.4%<br />
Distance Learning Percent of Total Credit Sections 19.9% 12.0% 8.4%<br />
Developmental Course Successful Completion (English) 63.9% 64.6% 71.3%<br />
Developmental Course Successful Completion (Math) 56.2% 57.3% 58.2%<br />
<strong>College</strong> Level (100+) Successful Course Completion 73.2% 74.3% 74.9%<br />
Distance Learning Successful Course Completion 61.1% 65.1% 60.3%<br />
Retention Fall to Spring (Credit Students) 60.3% 71.6% 66.3%<br />
Retention Fall to Fall (Credit Students) 38.50% 48.4% 43.1%<br />
Credit Developmental Success, First <strong>College</strong> Level Math 59.1% 65.6% 67.3%<br />
Credit Developmental Success, First <strong>College</strong> Level English 71.0% 71.0% 78.4%<br />
Number of Student Transfers with 12+ <strong>Maricopa</strong> Hours in 2011-12 ** 30,808 N/A 3,503<br />
Number of New Transfers with 12+ <strong>Maricopa</strong> Hours in 2011-12 ** 6,935 N/A 1,014<br />
Percent of First-Time, Full-Time, Degree/Cert Seeking Students who<br />
Transfer or Complete in 3 Years† 29.9% 37.5% 30.3%<br />
3 Year Completer Rate for First-Time, Full-Time Degree or Certificate<br />
Seeking Students† 17.4% 20.2% 16.9%<br />
Total Number of Degrees & Certificates Awarded†<br />
2010-11 21,396 N/A 1,522<br />
2011-12 23,947 N/A 1,857<br />
Number of People Receiving Degrees & Certificates***<br />
2010-11 14,289 N/A 889<br />
2011-12 15,400 N/A 1,035<br />
The Completion<br />
Agenda is a<br />
national goal to<br />
increase student<br />
completion rates by<br />
50% over the next<br />
decade.<br />
Source: Except where<br />
noted, the National<br />
<strong>Community</strong> <strong>College</strong><br />
Benchmark Project<br />
(NCCBP) 2012 report,<br />
which reported on<br />
data from the 2010-11<br />
Academic Year.<br />
* 2040 Report; <strong>Maricopa</strong><br />
Office of Institutional<br />
Effectiveness.<br />
** Articulation<br />
System Stimulating<br />
Interinstitutional Student<br />
Transfer (ASSIST).<br />
*** <strong>Maricopa</strong> Office of<br />
Institutional Effectiveness.<br />
† Integrated Postsecondary<br />
Education Data System<br />
(IPEDS)<br />
<strong>Chandler</strong>-<strong>Gilbert</strong> <strong>Community</strong> <strong>College</strong> • <strong>Fact</strong> <strong>Book</strong> <strong>2013</strong><br />
19
Employees<br />
Employee information was based on the Integrated Postsecondary Education Data System (IPEDS) Human Resources Report for Fall<br />
2012. All employees were grouped based on the 2010 Standard Occupational Classification (SOC) system used by Federal statistical<br />
agencies. More information about the SOC system can be found at http://www.bls.gov/soc/<br />
Human Resources<br />
Employees by Occupational Category Number Percent<br />
Faculty 133 39.2%<br />
Librarians 5 1.5%<br />
Library Technicians 4 1.2%<br />
Other Teachers and Instructional Support Staff 18 5.3%<br />
Management 13 3.8%<br />
Business and Financial 11 3.2%<br />
Computer, Engineering and Science 18 5.3%<br />
<strong>Community</strong> Service, Legal, Arts and Media 22 6.5%<br />
Service 30 8.8%<br />
Office and Administrative Support 77 22.7%<br />
Natural Resources, Construction and Maintenance 8 2.4%<br />
Production, Transportation and Material Moving 0 0.0%<br />
Total Employees 339 100.0%<br />
Source: Integrated Postsecondary Education Data System (IPEDS), Fall 2012 Human Resources Report.<br />
% of Minority Employees National Percentile: 80%<br />
This means that 79% of community colleges have a smaller percentage of<br />
minority employees.<br />
Source: National <strong>Community</strong> <strong>College</strong> Benchmark Project (NCCBP), 2012<br />
<strong>Chandler</strong>-<strong>Gilbert</strong> <strong>Community</strong> <strong>College</strong> • <strong>Fact</strong> <strong>Book</strong> <strong>2013</strong><br />
20
Facilities<br />
Total number of buildings, gross square feet (GSF) and acres of land.<br />
Location<br />
Number of<br />
Size (GSF)<br />
Buildings<br />
Total Acres<br />
Pecos Campus 17 340,914 127<br />
Williams Campus 9 224,992 56<br />
Sun Lakes Center 1 11,068 0<br />
Total 27 576,974 183<br />
Facilities<br />
Pecos Campus Buildings<br />
Size (GSF)<br />
Year<br />
Constructed<br />
Year<br />
Remodeled<br />
AGA - Agave Hall 29,310 1-1-1986 2000<br />
BRD - Bradshaw Hall 33,934 1-1-1986 2000<br />
BA - Bradshaw Annex 1,440 1-1-2000<br />
PSB - Public Safety Building 4,874 1-1-1986<br />
LIB - Library 60,670 1-1-1998<br />
CHO - Cholla Hall 41,707 1-1-1998<br />
SAG - Saguaro Hall 20,510 1-1-1998<br />
EST - Estrella Hall 17,012 1-1-1998<br />
FSB - Facilities Services Building 5,113 1-1-1998<br />
PAC - Arnette Scott Ward<br />
Performing Arts Center<br />
31,652 6-2-2002<br />
SC - Student Center 20,510 1-2-2003<br />
BKS - <strong>Book</strong>store 2,400 1-1-2003<br />
ATB - Athletic Training Building 1,668 7-1-2004<br />
GIL - Gila Hall 3,581 8-1-2006<br />
ACR - Athletic<br />
Concession/Restrooms<br />
790 8-1-2007<br />
JAC - Jacaranda Hall 3,990 8-1-2008<br />
JAV - Javelina Hall 3,991 9-1-2009<br />
IRN - Ironwood Hall 57,446 11-1-2009<br />
ETC - Ramada 1,755 8-30-2012<br />
Total 342,353<br />
<strong>Chandler</strong>-<strong>Gilbert</strong> <strong>Community</strong> <strong>College</strong> • <strong>Fact</strong> <strong>Book</strong> <strong>2013</strong><br />
Pecos Campus Acreage Acres<br />
Year<br />
Purchased<br />
Original Parcel 79.32 1981<br />
Athletics Parcel 37.11 1995<br />
<strong>Gilbert</strong> Road Entrance 2.89 2003<br />
City Right of Ways -1.4 2006<br />
Corner Land (Pecos/<strong>Gilbert</strong><br />
Roads)<br />
10 2009<br />
Total 127.92<br />
Sun Lakes Center Building Size (GSF)<br />
Year<br />
Constructed<br />
First Floor 5,000 Fall 1997<br />
Second Floor & Main<br />
September<br />
6,068<br />
Entry/Lobby<br />
2006<br />
Total 11,068<br />
Source: CGCC Facilities Services<br />
21
Facilities<br />
Total number of buildings, gross square feet (GSF), and acres of land.<br />
Williams Campus - Non-Residential Buildings<br />
Size (GSF)<br />
Year<br />
Constructed<br />
Year<br />
Remodeled<br />
Facilities<br />
THOM - Thomas Hall 10,930 1958 1996<br />
PEC - Physical Education Center 23,118 1968 1994<br />
MSB - Mortuary Science Building 6,383 1979 2000<br />
BLUF - Bluford Hall 92,866 1984 2000<br />
EUTC - Electric Utility Technology Classroom 1,848 2006<br />
FACB - Facilities Building 3,024 1984 2009<br />
HNGR - Hangar 21,892 2008<br />
EGEL - Engel Hall 28,659 2008<br />
BAYL - Baylor Hall Complex 18,377 1973 & 1985 2009<br />
BRID - Bridget Hall 17,895 1-1-2011<br />
Total 224,992<br />
Residence Halls<br />
Homes<br />
Williams Campus Residential Size (GSF) Year Constructed<br />
5830 S Twining St (Bldg 324 / 40 bedrooms) 18,897 1968<br />
5815 S Sterling Ave (Bldg 326 / 40 bedrooms) 18,897 1968<br />
5829 S Twining St (Bldg 334 / 40 bedrooms) 18,107 1972<br />
7303 E Tahoe Ave (Bldg 344 / 40 bedrooms) 18,107 1972<br />
5816 S Avery St (Bldg 354 / 40 bedrooms) 18,107 1972<br />
Total = 200 Bedrooms 92,115<br />
7150-7263 E Trent Ave or E Thistle Ave<br />
5706-5762 S Raven, S Amulet Ave or S Rowen original construction in 1956<br />
(Original unit numbers 9001-9045)<br />
remodeled in 1970s<br />
16 Two Bedroom, Two Bath Homes 17,920 1975<br />
15 Three Bedroom, Two Bath Homes 20,400 1975<br />
3 Five Bedroom, Two Bath Homes 4,971 1975<br />
Total = 92 Bedrooms 43,291<br />
Note: All housing is under a 30-year ground lease beginning 3/2001 and is managed and operated by<br />
a third party.<br />
Source: CGCC Facilities Services<br />
<strong>Chandler</strong>-<strong>Gilbert</strong> <strong>Community</strong> <strong>College</strong> • <strong>Fact</strong> <strong>Book</strong> <strong>2013</strong><br />
22
Financials<br />
Adopted Budget<br />
Annual Budget Summary<br />
Budgets FY 12-13 FY13-14<br />
Increase /<br />
Decrease<br />
<strong>Chandler</strong>-<strong>Gilbert</strong> <strong>Community</strong> <strong>College</strong> • <strong>Fact</strong> <strong>Book</strong> <strong>2013</strong><br />
Percent<br />
Change<br />
General Fund $46,456,181 $ 47,319,280 $ 863,099 1.9%<br />
Auxiliary Fund 3,998,452 3,997,799 (653) 0.0%<br />
Restricted Fund 15,268,179 17,654,314 2,386,135 15.6%<br />
Plant Fund 752,000 752,000 0 0.0%<br />
Total Budget $66,474,812 $69,723,393 $3,248,581 4.9%<br />
General Fund Expenditures by Function FY 12-13 FY13-14<br />
Increase /<br />
Decrease<br />
Percent<br />
Change<br />
Instruction $23,235,656 $ 23,944,755 $ 709,099 3.1%<br />
Academic Support 5,802,740 5,974,154 171,414 3.0%<br />
Administration 2,454,986 2,432,240 (22,746) -0.9%<br />
Student Services 4,670,363 4,608,090 (62,273) -1.3%<br />
Operations/Maintenance 5,731,366 5,786,854 55,488 1.0%<br />
General Institutional 3,810,064 3,819,484 9,420 0.2%<br />
Public Service 179,874 182,571 2,697 1.5%<br />
Scholarships 571,132 571,132 0 0.0%<br />
Total by Function $46,456,181 $47,319,280 $ 863,099 1.9%<br />
General Fund Expenditures by Object FY 12-13 FY13-14<br />
Increase /<br />
Decrease<br />
Percent<br />
Change<br />
Salaries & Wages $30,017,837 $ 30,135,882 $ 118,045 0.4%<br />
Employee Benefits 8,422,536 8,900,306 477,770 5.7%<br />
Contract Service 2,142,199 2,224,531 82,332 3.8%<br />
Supplies & Materials 1,095,789 1,060,689 (35,100) -3.2%<br />
Fixed Charges 402,303 417,303 15,000 3.7%<br />
Communication & Utilities 1,596,724 1,596,724 0 0.0%<br />
Travel 101,296 103,796 2,500 2.5%<br />
Miscellaneous & Transfers 2,677,497 2,880,049 202,552 7.6%<br />
Total By Object $46,456,181 $47,319,280 $ 863,099 1.9%<br />
The General Fund is the largest and<br />
main operating budget. It accounts<br />
for unrestricted resources that will<br />
be expended in the current year for<br />
operating purposes.<br />
The Auxiliary Fund includes<br />
revenues and expenditures that<br />
support a variety of self-supporting<br />
activities.<br />
The Restricted Fund accounts for<br />
all restricted activity such as grants,<br />
student financial aid and Proposition<br />
301-a statewide November 2000<br />
referendum that raised sales taxes<br />
for education (community colleges<br />
are required to use the funds<br />
for workforce development and<br />
training). Revenue sources include<br />
federal, state and local funds for<br />
grants or contracts, Proposition 301<br />
sales tax revenue and federal financial<br />
aid funding.<br />
The Plant Fund is the capital<br />
budget fund.<br />
23
Financial Comparisons<br />
Compares the <strong>Maricopa</strong> <strong>Community</strong> <strong>College</strong>s to national benchmarks.<br />
% of Funds From Local Sources: 61.9% National Percentile: 97%<br />
% of Funds From State: 7.3% National Percentile: 18%<br />
% of Funds From Tuition and Fees: 30.8% National Percentile: 32%<br />
Financials<br />
The <strong>Maricopa</strong> <strong>Community</strong> <strong>College</strong>s are disproportionately funded from local property taxes compared to other community colleges<br />
in the United States. Ninety-six percent of community colleges receive a smaller percent of their revenue from local sources; 68% of<br />
community colleges receive a larger percentage from tuition; and, 82% of community colleges receive a greater percent from state<br />
funds.<br />
Tuition: $76 National Percentile: 17%<br />
Tution is for 2012-13. The national percentile indicates that 83% of community colleges have higher tuition charges than <strong>Maricopa</strong>.<br />
Cost Per Credit Hour: $99 National Percentile: 16%<br />
Cost Per Student FTSE: $2,971 National Percentile: 16%<br />
This indicates that 84% of community colleges have higher costs than <strong>Maricopa</strong>.<br />
Source: National <strong>Community</strong> <strong>College</strong> Benchmark Project (NCCBP), 2012<br />
<strong>Chandler</strong>-<strong>Gilbert</strong> <strong>Community</strong> <strong>College</strong> • <strong>Fact</strong> <strong>Book</strong> <strong>2013</strong><br />
24
Population<br />
Population trends by <strong>Maricopa</strong> County, select Arizona cities and the CGCC core area cities. The core area includes <strong>Chandler</strong>, <strong>Gilbert</strong>,<br />
Queen Creek and Sun Lakes.<br />
600,000<br />
500,000<br />
<strong>Community</strong><br />
Populatiom<br />
400,000<br />
300,000<br />
200,000<br />
100,000<br />
0<br />
County & City<br />
1990 2000 2010 2012 Estimate<br />
Year<br />
Population<br />
1990 2000 2010<br />
2012<br />
Estimate<br />
1990 to<br />
2010<br />
Percent Change<br />
2000 to<br />
2010<br />
2000 to 2012<br />
2 Year %<br />
Change<br />
2010 to<br />
2012<br />
<strong>Maricopa</strong> County 2,122,101 3,072,149 3,817,117 3,884,705 79.9% 24.2% 26.4% 1.8%<br />
<strong>Chandler</strong> 90,533 176,581 236,126 241,214 160.8% 33.7% 36.6% 2.2%<br />
<strong>Gilbert</strong> 29,188 109,967 208,453 219,666 614.2% 89.6% 99.8% 5.4%<br />
Mesa 288,091 396,375 439,041 444,856 52.4% 10.8% 12.2% 1.3%<br />
Queen Creek 2,667 4,316 26,361 27,249 888.4% 510.8% 542.0% 3.4%<br />
Sun Lakes 6,578 11,936 13,975 - 112.5% 17.1% - -<br />
Tempe 141,865 158,625 161,719 164,659 14.0% 2.0% 3.8% 1.8%<br />
Core Area 128,966 302,800 484,915 488,129 276.0% 60.1% 68.0% 0.7%<br />
Source: U.S. Census 1990, 2000 and 2010, and Arizona Department of Administration Office of Employment and Population Statistics July 1,<br />
<strong>Chandler</strong><br />
<strong>Gilbert</strong><br />
Queen Creek<br />
Core Area<br />
2012, Population Estimates. Population estimates for Sun Lakes were not available.<br />
<strong>Chandler</strong>-<strong>Gilbert</strong> <strong>Community</strong> <strong>College</strong> • <strong>Fact</strong> <strong>Book</strong> <strong>2013</strong><br />
25
Population<br />
Population trends by <strong>Maricopa</strong> County, select Arizona cities and the CGCC core area cities. The core area includes <strong>Chandler</strong>, <strong>Gilbert</strong>,<br />
Queen Creek and Sun Lakes.<br />
<strong>Community</strong><br />
Ethnicity US AZ<br />
<strong>Maricopa</strong><br />
County<br />
<strong>Chandler</strong> <strong>Gilbert</strong> Mesa<br />
Queen<br />
Creek<br />
Sun<br />
Lakes<br />
Tempe<br />
American Indian or Alaska Native 0.7% 4.1% 1.6% 1.1% 0.6% 2.0% 1.2% 0.6% 2.9%<br />
Asian 4.7% 2.7% 3.3% 7.4% 6.1% 1.9% 1.8% 0.6% 6.7%<br />
Black or African American 12.2% 3.8% 4.7% 4.8% 3.8% 3.0% 3.4% 1.5% 4.6%<br />
Hispanic/Latino 16.1% 29.4% 29.4% 22.2% 15.2% 25.7% 16.1% 1.2% 20.7%<br />
Native Hawaiian or Pacific Islander 0.2% 0.2% 0.2% 0.1% 0.1% 0.3% 0.0% 0.0% 0.5%<br />
White 64.2% 58.2% 59.1% 62.1% 71.7% 65.5% 76.4% 95.6% 61.4%<br />
Two or More Races 1.9% 1.6% 1.6% 2.2% 2.4% 1.6% 1.0% 0.5% 2.8%<br />
Race and Ethnicity Unknown 0.2% 0.1% 0.1% 0.1% 0.2% 0.1% 0.1% 0.0% 0.3%<br />
Source: 2007-2011 American <strong>Community</strong> Survey 5-Year Estimate<br />
Educational Level<br />
High<br />
School+<br />
Bachelor's<br />
or Higher<br />
Arizona 85.2% 26.4%<br />
<strong>Maricopa</strong> County 85.8% 29.1%<br />
<strong>Chandler</strong> 92.3% 39.6%<br />
<strong>Gilbert</strong> 95.3% 38.0%<br />
Mesa 86.4% 23.5%<br />
Queen Creek 95.8% 32.6%<br />
Sun Lakes 90.2% 41.3%<br />
Tempe 90.2% 41.3%<br />
Source: Educational Level: Percentages of Educational<br />
Attainment of Individuals 25 Years + from Selected<br />
Social Characteristics in the United States, 2007-2011<br />
American <strong>Community</strong> Survey, 5-Year Estimates. American<br />
<strong>Fact</strong> Finder: US Census.<br />
<strong>Chandler</strong>-<strong>Gilbert</strong> <strong>Community</strong> <strong>College</strong> • <strong>Fact</strong> <strong>Book</strong> <strong>2013</strong><br />
26
Labor Statistics<br />
Unemployment trends in Arizona, <strong>Maricopa</strong> County, select Arizona cities and the CGCC core area cities. The core area includes <strong>Chandler</strong>,<br />
<strong>Gilbert</strong>, Queen Creek and Sun Lakes.<br />
<strong>Community</strong><br />
12%<br />
10%<br />
8%<br />
6%<br />
4%<br />
2%<br />
0%<br />
Unemployment<br />
Location Percent Number<br />
Arizona 8.5% 257,254<br />
<strong>Maricopa</strong> County 7.1% 134,724<br />
Phoenix-Mesa-Glendale 7.2% 147,614<br />
<strong>Chandler</strong> 6.0% 7,968<br />
<strong>Gilbert</strong> 5.7% 6,559<br />
Mesa 6.9% 15,464<br />
Queen Creek 5.6% 739<br />
Sun Lakes 9.4% 284<br />
Tempe 6.3% 6,238<br />
Arizona Unemployment Rate<br />
June 2003 to June <strong>2013</strong><br />
2003 2004 2005 2006 2007 2008 2009 2010 2011 2012 <strong>2013</strong><br />
Source: Arizona Deparment of Administration, Office of Employment and Populations Statistics Local Area<br />
Unemployment Statistics. Published as Special Unemployment Report, June <strong>2013</strong>.<br />
http://www.azstats.gov/pubs/labor/specrates<strong>2013</strong>.pdf<br />
<strong>Chandler</strong>-<strong>Gilbert</strong> <strong>Community</strong> <strong>College</strong> • <strong>Fact</strong> <strong>Book</strong> <strong>2013</strong><br />
27