Horizontal cone penetration testing in sand - Geo-Engineering
Horizontal cone penetration testing in sand - Geo-Engineering
Horizontal cone penetration testing in sand - Geo-Engineering

Create successful ePaper yourself
Turn your PDF publications into a flip-book with our unique Google optimized e-Paper software.
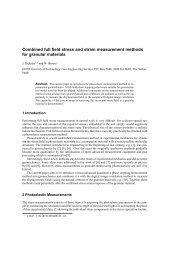
Proceed<strong>in</strong>gs of the XVth Int Conf. Soil Mech. and Foundation Eng<strong>in</strong>., Istanbul, Turkey, 2001, pp. 555-558.<br />
<strong>Horizontal</strong> <strong>cone</strong> <strong>penetration</strong> <strong>test<strong>in</strong>g</strong> <strong>in</strong> <strong>sand</strong><br />
Essai de sondage horizontal dans les sables<br />
W. Broere, <strong>Geo</strong>technical Laboratory, Delft University of Technology, The Netherlands<br />
A.F. van Tol, Rotterdam Public Works & <strong>Geo</strong>technical Laboratory, Delft University of Technology, The Netherlands<br />
ABSTRACT: The <strong>cone</strong> resistance and sleeve friction measured when a <strong>penetration</strong> test is executed <strong>in</strong> a horizontal direction differ from<br />
those obta<strong>in</strong>ed when sound<strong>in</strong>g <strong>in</strong> the traditional vertical direction. In a 2m diameter calibration chamber several test series have been<br />
executed <strong>in</strong> differently graded <strong>sand</strong>s and at different densities. These tests show that the ratio of horizontal over vertical <strong>cone</strong> resistance<br />
depends on the density of the <strong>sand</strong> and less on the gradation. The ratio of sleeve frictions on the other hand depends strongly on the<br />
gradation and not so much on the density. These differences will lead to small changes <strong>in</strong> soil classification charts.<br />
RÉSUMÉ: La résistance à la pénétration et le frottement latéral, mesuré quand un essai de sondage aurait exécuté dans un direction<br />
horizontal, différent de ces mesuré à la verticale. Un nombre des essais a exécuté dans un chambre de calibration sur sables avec des<br />
courbes de distribution granulométrique différentes et des densités différentes. Ces essais démontrent que le ratio de la résistance à la<br />
pénétration horizontal divisé par cette mesuré vertical dépend de la densité, mais pas de la distribution granulométrique. Le ratio du<br />
frottements latéral toutefois dépend de la distribution granulométrique et mo<strong>in</strong>s de la densité. Ces différences amènera des changements<br />
limités aux diagrammes de la classification des sols.<br />
1 Introduction<br />
The <strong>cone</strong> <strong>penetration</strong> test (CPT) has been used extensively over the<br />
last decades to measure <strong>in</strong> situ soil properties. Measurements are<br />
traditionally taken from ground level <strong>in</strong> a vertical downward direction,<br />
to ga<strong>in</strong> <strong>in</strong>formation about stratification and soil properties.<br />
In recent years there has been a grow<strong>in</strong>g number of underground<br />
construction works, such as tunnel bor<strong>in</strong>g projects, for which a<br />
soil <strong>in</strong>vestigation is needed over large distances as well as to great<br />
depths. The typical <strong>in</strong>terval between bor<strong>in</strong>gs or CPTs from the<br />
ground surface for such a project lies somewhere <strong>in</strong> the range of<br />
50 to 100m, but this may not always be sufficient. In the case<br />
of a bored tunnel, the soil <strong>in</strong>vestigation can be complemented by<br />
<strong>cone</strong> <strong>penetration</strong> tests orig<strong>in</strong>at<strong>in</strong>g from the tunnel bor<strong>in</strong>g mach<strong>in</strong>e<br />
<strong>in</strong> a horizontal forward direction, as proposed by e.g. van Deen et<br />
al. (1999). Although it would not be possible to change the alignment<br />
of the tunnel based on this <strong>in</strong>formation, the test results could<br />
be used to f<strong>in</strong>etune the bor<strong>in</strong>g process and improve control of the<br />
face support or reduce the settlements caused by the tunnel bor<strong>in</strong>g<br />
mach<strong>in</strong>e.<br />
Although the equipment used to perform a vertical CPT is easily<br />
converted for use <strong>in</strong> a horizontal <strong>cone</strong> <strong>penetration</strong> test (HCPT),<br />
the <strong>in</strong>terpretation of the test results is not so easily converted. The<br />
<strong>in</strong>terpretation of CPTs is normally made us<strong>in</strong>g analytical and empirical<br />
models, which all implicitely or explicitely assume that<br />
the <strong>penetration</strong> direction is vertical, or that the stress component<br />
perpendicular to the <strong>penetration</strong> direction is radially uniform. In<br />
vertical CPTs this is the effective horizontal stress σ h ′ after all, and<br />
Houlsby & Hitchman (1988) have shown that this stress component<br />
governs the <strong>cone</strong> resistance <strong>in</strong> calibration chamber tests <strong>in</strong> <strong>sand</strong>.<br />
In the case of HCPT however the stress state perpendicular to<br />
the <strong>cone</strong> is not radially uniform, as it varies between σ h ′ and the<br />
effective vertical stress σ v ′ . Comb<strong>in</strong>ed with the fact that most soils<br />
have been deposited <strong>in</strong> a layerwise manner, it is to be expected<br />
that the measurements obta<strong>in</strong>ed with HCPT differ from those <strong>in</strong><br />
vertical CPT.<br />
Such differences have been observed <strong>in</strong> calibration chamber<br />
tests as well as field tests. Field measurements, reported by van<br />
Deen et al. (1999), show that the horizontal <strong>cone</strong> resistance is<br />
greater than the vertical, up to three times greater <strong>in</strong> clay. Other<br />
tests, <strong>in</strong> <strong>sand</strong> and peat layers, show a similar although less extreme<br />
behaviour. Van Deen’s observation <strong>in</strong> a <strong>sand</strong> layer has a horizontal<br />
over vertical <strong>cone</strong> resistance ratio qc H/V = 1.8.<br />
A number of calibration chamber tests on <strong>sand</strong>s has been executed<br />
by Broere & van Tol (1998) on a uniformly distributed <strong>sand</strong>.<br />
These tests showed a horizontal <strong>cone</strong> resistance qc H greater than<br />
the vertical <strong>cone</strong> resistance qc V at the same depth. The horizontal<br />
<strong>cone</strong> resistance was on average 1.2 times the vertical for medium<br />
dense <strong>sand</strong> and close to one for very loose or dense <strong>sand</strong>s. Extreme<br />
qc<br />
H/V ratios of 0.9 and 1.6 were observed however. The horizontal<br />
sleeve friction was clearly lower than the vertical sleeve friction,<br />
with fs<br />
H approximately 0.8fs V , but showed little dependancy on<br />
the density of the <strong>sand</strong>.<br />
These tests give no <strong>in</strong>dication however of the <strong>in</strong>fluence of the<br />
gra<strong>in</strong> size distribution of the <strong>sand</strong> on the horizontal <strong>cone</strong> resistance<br />
or sleeve friction, although the difference between field observation<br />
and calibration chamber tests <strong>in</strong>dicates that there may be an<br />
<strong>in</strong>fluence. To test that hypothesis a number of calibration chamber<br />
tests has been performed on differently graded <strong>sand</strong>s.<br />
2 Calibration Chamber Tests<br />
2.1 The DUT Calibration Chamber<br />
The calibration chamber at Delft University of Technology (DUT)<br />
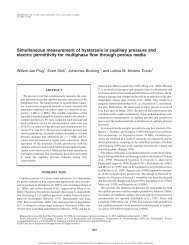
is a 2m diameter rigid wall calibration chamber, as sketched <strong>in</strong><br />
figure 1. This chamber differs <strong>in</strong> a number of ways from the calibration<br />
chamber types most often used, as described by Park<strong>in</strong><br />
(1988).<br />
Most notable is the fact that the DUT chamber is a rigid wall<br />
chamber, mean<strong>in</strong>g that the lateral boundaries are <strong>in</strong>flexible and prevent<br />
horizontal deformation at this po<strong>in</strong>t. In normal operation the<br />
upper boundary rema<strong>in</strong>s free and unloaded and the lower boundary<br />
is formed by a stiff perforated steel plate.<br />
On top of this plate a fluidisation system is <strong>in</strong>stalled, consist<strong>in</strong>g<br />
of filter dra<strong>in</strong>s connected to a pump and several water reservoirs.<br />
This fluidisation system can be used to fluidise the <strong>sand</strong> bed <strong>in</strong> the<br />
tank. A couple of vibrators affixed to the sides of the tank can then<br />
be used to densify the <strong>sand</strong> bed. After fluidisation and densification<br />
1
Proceed<strong>in</strong>gs of the XVth Int Conf. Soil Mech. and Foundation Eng<strong>in</strong>., Istanbul, Turkey, 2001, pp. 555-558.<br />
1900<br />
f<strong>in</strong>e middle coarse<br />
<strong>sand</strong><br />
100<br />
90<br />
3230<br />
780 240 230 ztop<br />
Vibrator<br />
Upper sound<strong>in</strong>g lock<br />
Lower sound<strong>in</strong>g lock<br />
Fluidisation system<br />
passed sieve (%)<br />
80<br />
70<br />
60<br />
50<br />
40<br />
30<br />
20<br />
10<br />
0<br />
0.050 0.100 0.200 0.500 1.0 2.0<br />
sieve aperture (mm)<br />
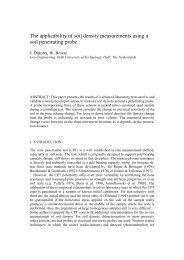
Figure 2. Sieve curves for all <strong>sand</strong>s<br />
1<br />
2<br />
Table 1. M<strong>in</strong>imal and maximal densities<br />
Sand e m<strong>in</strong> emax<br />
1 0.470 0.818<br />
2 0.498 0.801<br />
3 0.454 0.749<br />
4 0.431 0.746<br />
3 4<br />
Figure 1. DUT calibration chamber<br />
the water can be dra<strong>in</strong>ed if so desired, allow<strong>in</strong>g tests on saturated or<br />
unsaturated <strong>sand</strong> samples. All calibration chamber tests described<br />
<strong>in</strong> this article have been made <strong>in</strong> unsaturated samples.<br />
The ma<strong>in</strong> advantage of the fluidisation method, over the commonly<br />
used pluviation method, is the relative ease with which a<br />
sample can be prepared. As there is no need to completely excavate<br />
the chamber each time, a saturated sample can be prepared<br />
with<strong>in</strong> an hour, as opposed to the days required for a pluviated<br />
sample. The ma<strong>in</strong> disadvantage is that the sample obta<strong>in</strong>ed <strong>in</strong> this<br />
way is less uniform, as segragation or slight density differences<br />
may occur. Without undisturbed sampl<strong>in</strong>g these density differences<br />
cannot be detected and only the overall density of the <strong>sand</strong><br />
can be measured. Also, due to the repeated fluidisation of the <strong>sand</strong>,<br />
part of the f<strong>in</strong>es may be washed out over time, slightly chang<strong>in</strong>g<br />
the gra<strong>in</strong> size distribution.<br />
A further special feature of the tank is of course the presence<br />
of two locks <strong>in</strong> the side of the wall, as sketched <strong>in</strong> figure 1. These<br />
locks are specially designed to allow a horizontal <strong>penetration</strong> to be<br />
made us<strong>in</strong>g a standard 35mm <strong>cone</strong>.<br />
2.2 The Sands<br />
In the different test series four different <strong>sand</strong>s have been used.<br />
The first two <strong>sand</strong>s are rather similar, both a uniformly distributed<br />
f<strong>in</strong>e <strong>sand</strong> of alluvial orig<strong>in</strong>. The difference between the two lies<br />
<strong>in</strong> the fact that the first <strong>sand</strong> had been used <strong>in</strong> the chamber over<br />
an extended period of time and that as a result most f<strong>in</strong>es had<br />
been washed out. The second <strong>sand</strong> was taken from a fresh batch<br />
and as a result conta<strong>in</strong>ed a small percentage of f<strong>in</strong>es. The third<br />
and fourth <strong>sand</strong>s were obta<strong>in</strong>ed by mix<strong>in</strong>g this alluvial <strong>sand</strong> <strong>in</strong><br />
different proportions with a commercially available coarse river<br />
<strong>sand</strong>, which had been washed to remove part of the orig<strong>in</strong>al f<strong>in</strong>es.<br />
The four <strong>sand</strong>s are characterised by their sieve curves <strong>in</strong> figure 2.<br />
For these <strong>sand</strong>s the m<strong>in</strong>imal and maximal densities have been<br />
obta<strong>in</strong>ed by pour<strong>in</strong>g dry <strong>sand</strong> through a funnel respectively vibrat-<br />
<strong>in</strong>g and compact<strong>in</strong>g a moist sample for an extended period of time.<br />
The result<strong>in</strong>g e m<strong>in</strong> and e max are listed <strong>in</strong> table 1.<br />
As said before some segregation may occur due to the fluidisation<br />
process, as f<strong>in</strong>er particles tend to float upwards. This has been<br />
checked by tak<strong>in</strong>g samples of the densified <strong>sand</strong> bed at different<br />
depths. Especially for the artificially mixed non-uniform <strong>sand</strong>s 3<br />
& 4 some segragation has been observed <strong>in</strong> the uppermost 20 cm.<br />
Below this layer the <strong>sand</strong> shows no discernible segregation and the<br />
sieve curves shown <strong>in</strong> figure 2 are obta<strong>in</strong>ed from samples taken<br />
from this lower region. Sands 1 & 2 are very uniformly graded<br />
and as a result show no segregation at all. The effect of the segregation<br />
is a slightly larger error <strong>in</strong> the determ<strong>in</strong>ation of the relative<br />
density of the <strong>sand</strong> at the depth of the horizontal sound<strong>in</strong>g. This<br />
error is however ma<strong>in</strong>ly attributed to density fluctuations caused<br />
by the densification process. As the overall error marg<strong>in</strong> rema<strong>in</strong>s<br />
below 5% <strong>in</strong> all cases, segregation and density fluctuations are not<br />
considered major problems for these tests.<br />
2.3 Overview of Test Series<br />
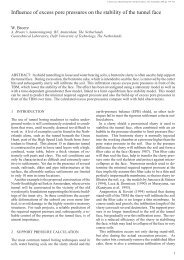
All tests have been made us<strong>in</strong>g standard 10cm 2 electrical <strong>cone</strong>s<br />
equipped with friction sleeves. In each test a <strong>sand</strong> bed was prepared<br />
by fluidisation and densification and a s<strong>in</strong>gle horizontal CPT was<br />
made us<strong>in</strong>g either the upper or lower lock position. In the same<br />
<strong>sand</strong> bed also up to three vertical tests were executed, as sketched <strong>in</strong><br />
figure 3. The result<strong>in</strong>g (vertical) <strong>cone</strong> resistance and sleeve friction<br />
at the depth of the horizontal test were then compared to the results<br />
of the horizontal test.<br />
All <strong>in</strong> all 69 horizontal and 151 vertical CPTs have been executed<br />
<strong>in</strong> the different <strong>sand</strong>s. The number of horizontal and vertical<br />
CPTs differs as <strong>in</strong> some cases two or only a s<strong>in</strong>gle vertical test<br />
has been made <strong>in</strong> the same sample. In the first <strong>sand</strong> 29 horizontal<br />
tests have been made us<strong>in</strong>g the lower lock position and 10 us<strong>in</strong>g the<br />
upper lock position. In all but 13 cases three vertical CPTs were<br />
made <strong>in</strong> each sample. In those 13 cases only a s<strong>in</strong>gle vertical CPT<br />
was made for each HCPT. In the other 3 <strong>sand</strong>s 10 horizontal tests<br />
were made, accompagnied by two vertical tests <strong>in</strong> each sample.<br />
For each of the <strong>sand</strong>s the vibration time was varied to obta<strong>in</strong><br />
different overall densities of the <strong>sand</strong> bed, result<strong>in</strong>g <strong>in</strong> relative densities<br />
10% < D r < 80%.<br />
2
Proceed<strong>in</strong>gs of the XVth Int Conf. Soil Mech. and Foundation Eng<strong>in</strong>., Istanbul, Turkey, 2001, pp. 555-558.<br />
240 230 1980<br />
550 400 400 550<br />
.. .. .. .. .. .. . .<br />
.. .. .. .. .. ..<br />
.<br />
.. .. .. .. .. .. ..<br />
. .. .. .. .. .. .. .. .. ..<br />
.. .. .. . .. .. .. ... .. .. .. .. .. . .. .. ..<br />
.. .. .. ... .. .. . .. .. .. . .. .. ..<br />
.. .. .. ... .. .. . .. .. .. . .. .. ..<br />
.. .. .. ... .. .. . . .. .. .. .. ... .. .. . ... .. .. .. .. .. .. .. .. ..<br />
. .. .. . ... .. .. .. .. .. .. .. .. ..<br />
. .. .. . ... .. .. .. .. .. .. .. .. ..<br />
. ... .. .. . .. .. .. .. ... .. .. ... .. .. . .. .. .. .. .. .. ... .. .. ..<br />
. .. .. . .. .. .. .. .. .. ... .. .. ..<br />
.. .. . .. .. .. .. .. ... .. .. ..<br />
.. . .. .. .. .. ... .. .. ..<br />
. .. .. .. .. .. .. ..<br />
.. .. .. .. .. ..<br />
.. .. .. ..<br />
.. ..<br />
.. .. .. .. .. .. . .. .. . .. .. . .. .. . .. .. . .. .. . .. .. . .. .. . .. .. . .. .. . .. .. . .. ..<br />
. .. .<br />
. ..<br />
. ... .<br />
.. .. .. .. .. .. .. .. .. .. .. .. .. .. .. .. .. .. .. .. .. .. ..<br />
.. .<br />
..<br />
.<br />
. .. . .. .. .. . .. .. . .. .. . .. .. . .. .. . .. .. . .. .. . .. .. . .. .. . .. .. . .. .. . .. .. . .. .. . .. .. . .. .. . .. .. . .. .. . .. .. . .. .. . .. .. . .. .. . .. .. . .. .. . .. .. . .. .. . .. ..<br />
. .. .<br />
. ..<br />
. .<br />
.<br />
.<br />
544 – 1030<br />
..<br />
fs H /σ v<br />
′<br />
8<br />
7<br />
6<br />
5<br />
4<br />
3<br />
Figure 3. Locations of vertical and horizontal CPTs<br />
qc H /σ v<br />
′<br />
1000<br />
900<br />
800<br />
700<br />
2<br />
1<br />
0<br />
Sand 1<br />
Sand 2<br />
Sand 3<br />
Sand 4<br />
0 1 2 3 4 5 6 7 8<br />
f V s /σ ′ v<br />
Figure 5. <strong>Horizontal</strong> vs. vertical sleeve friction<br />
600<br />
500<br />
400<br />
300<br />
200<br />
100<br />
0<br />
Sand 1<br />
Sand 2<br />
Sand 3<br />
Sand 4<br />
0 100 200 300 400 500 600 700 800 900 1000<br />
q V c /σ ′ v<br />
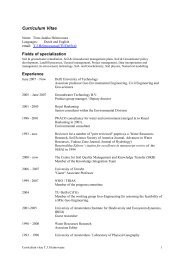
Figure 4. <strong>Horizontal</strong> vs. vertical <strong>cone</strong> resistance<br />
3 Results<br />
The horizontal <strong>cone</strong> resistance qc H has been compared to the vertical<br />
<strong>cone</strong> resistanceqc V measured at the same depth and <strong>in</strong> the same<br />
sample <strong>in</strong> figure 4. Similarly the horizontal sleeve friction has been<br />
plotted aga<strong>in</strong>st vertical sleeve friction <strong>in</strong> figure 5. The results have<br />
been normalised by the vertical effective stress σ v ′ , even though<br />
the results from calibration chamber tests by Houlsby & Hitchmann<br />
(1988) <strong>in</strong>dicate that a normalisation by horizontal effective<br />
stress is more useful. Also a similar normalisation is suggested by<br />
Wroth (1984), but he also <strong>in</strong>dicates that such a normalisation may<br />
be impractical as <strong>in</strong> many cases the horizontal effective stress is<br />
not precisely known. This is the case <strong>in</strong> a rigid wall calibration<br />
chamber such as used <strong>in</strong> these tests, and as a result a normalisation<br />
by vertical effective stress is choosen.<br />
3.1 <strong>Horizontal</strong> Cone Resistance<br />
It can be ga<strong>in</strong>ed from figure 4 that the horizontal <strong>cone</strong> resistance is<br />
on average larger than the vertical <strong>cone</strong> resistance. This can also<br />
be seen <strong>in</strong> figure 6, where the ratio of horizontal <strong>cone</strong> resistance<br />
over vertical <strong>cone</strong> resistance qc<br />
H/V has been plotted aga<strong>in</strong>st relative<br />
density.<br />
For medium dense <strong>sand</strong>s the average ratio qc<br />
H/V is approximately<br />
1.2. For loose and very dense <strong>sand</strong>s this ratio tends towards<br />
1. This <strong>in</strong>dicates that not only the different stress state around the<br />
<strong>cone</strong> <strong>in</strong>fluences the horizontal <strong>cone</strong> resistance, but that it is also<br />
affected by the density of the <strong>sand</strong>.<br />
If on the other hand the results from the four <strong>sand</strong>s are compared<br />
to each other, there is no significant difference between those,<br />
<strong>in</strong>dicat<strong>in</strong>g that the gra<strong>in</strong> size distribution does not <strong>in</strong>fluence horizontal<br />
<strong>cone</strong> resistance, at least not differently than vertical <strong>cone</strong><br />
resistance.<br />
That for normally consolidated <strong>sand</strong>s the horizontal <strong>cone</strong> resistance<br />
is expected to be somewhat larger than the vertical has<br />
been expla<strong>in</strong>ed by Broere (2001) us<strong>in</strong>g an elastic cavity expansion<br />
model. Based on this simple model a <strong>cone</strong> resistance ratio<br />
q H/V<br />
c<br />
∝ 1 + K<br />
K<br />
with K the horizontal stress coefficient, is calculated, i.e.<br />
qc<br />
H/V ≈ 1.5 for normally consolidated <strong>sand</strong>s. This is somewhat<br />
larger than the observed ratio, as might be expected from a completely<br />
elastic model.<br />
The observed ratio qc<br />
H/V ≈ 1 at low densities can be understood<br />
if it is supposed that at low densities the stress level has little<br />
or no <strong>in</strong>fluence on the <strong>cone</strong> resistance, as evident from Schmertmann<br />
(1975), so that also differences <strong>in</strong> the stress state have little<br />
<strong>in</strong>fluence on the <strong>cone</strong> resistance.<br />
3.2 <strong>Horizontal</strong> Sleeve Friction and Friction Ratio<br />
In contrast to the <strong>cone</strong> resistance, the horizontal sleeve friction does<br />
show a clear <strong>in</strong>fluence of the <strong>sand</strong> type used. This can be seen <strong>in</strong><br />
the plot of horizontal vs. vertical sleeve friction (figure 5) or even<br />
more pronounced if the ratio of horizontal over vertical friction<br />
ratios is considered. See figure 7 for a plot of Rf<br />
H/V vs. relative<br />
density.<br />
The mean Rf<br />
H/V is 0.72 for <strong>sand</strong> 1 and 1.20, 0.77 and 0.60 for<br />
<strong>sand</strong> 2, 3 and 4 respectively. On the other hand there is little or<br />
no <strong>in</strong>fluence of the density of the <strong>sand</strong>. The high value of Rf<br />
H/V<br />
(1)<br />
3
Proceed<strong>in</strong>gs of the XVth Int Conf. Soil Mech. and Foundation Eng<strong>in</strong>., Istanbul, Turkey, 2001, pp. 555-558.<br />
q H/V<br />
c<br />
2.0<br />
1.5<br />
1.0<br />
<strong>in</strong> <strong>sand</strong>, and the field test results given by van Deen (1999), it is<br />
clear that some slight modifications are needed to those charts if<br />
they are to be used for the <strong>in</strong>terpretation of HCPT results.<br />
As the horizontal <strong>cone</strong> resistance is on average slightly higher<br />
and the friction ratio slightly lower than their vertical conterparts,<br />
the bounds between different soil types shift slightly upward and<br />
to the left. There is however a severe lack of data from silt, clay<br />
and peats, so that no reliable classification charts for HCPT can<br />
be constructed as yet. If a detailed soil classification is based on<br />
HCPTs and exist<strong>in</strong>g classifcation charts, one should take care, as<br />
the horizontal and vertical measurements <strong>in</strong> clay or peat may differ<br />
by a factor of 2 or more.<br />
0.5<br />
0<br />
Sand 1<br />
Sand 2<br />
Sand 3<br />
Sand 4<br />
0 0.1 0.2 0.3 0.4 0.5 0.6 0.7 0.8 0.9 1.0<br />
D r<br />
Figure 6.<br />
density<br />
R H/V<br />
f<br />
4.0<br />
3.5<br />
3.0<br />
2.5<br />
2.0<br />
1.5<br />
1.0<br />
0.5<br />
0<br />
Ratio of horizontal over vertical <strong>cone</strong> resistance vs. relative<br />
Sand 1<br />
Sand 2<br />
Sand 3<br />
Sand 4<br />
0 0.1 0.2 0.3 0.4 0.5 0.6 0.7 0.8 0.9 1.0<br />
D r<br />
Figure 7. Ratio of horizontal over vertical friction ratio vs. relative density<br />
for <strong>sand</strong> 2 is partly due to the two extreme values (2.4 & 3.5),<br />
but all other measurements for this <strong>sand</strong> also yield relatively large<br />
ratios of friction ratio. If those two values are discarded the mean<br />
Rf<br />
H/V for <strong>sand</strong> 2 drops to 1.01, but even <strong>in</strong> that case the differences<br />
between the different <strong>sand</strong> types cannot be attributed to statistical<br />
fluctuations only.<br />
It is no more than expected that the friction ratio <strong>in</strong>creases with<br />
an <strong>in</strong>creas<strong>in</strong>g fraction of f<strong>in</strong>es and decreases if a larger coarse <strong>sand</strong><br />
fraction is present. Given the available data it seems however that<br />
the horizontal sleeve friction reacts stronger to such changes <strong>in</strong><br />
gra<strong>in</strong> size distribution than does the vertical sleeve friction, whilst<br />
at the same time the average horizontal friction ratio is lower than<br />
its vertical counterpart. Although such a comb<strong>in</strong>ation of effects<br />
would expla<strong>in</strong> the observed ratios, the underly<strong>in</strong>g physics are not<br />
completely clear.<br />
5 Conclusions<br />
The <strong>cone</strong> resistance and sleeve friction measured when perform<strong>in</strong>g<br />
a CPT <strong>in</strong> <strong>sand</strong> <strong>in</strong> a horizontal direction differ from those obta<strong>in</strong>ed<br />
<strong>in</strong> vertical tests. The horizontal <strong>cone</strong> resistance for medium dense<br />
<strong>sand</strong>s is on average 20% higher than the vertical <strong>cone</strong> resistance.<br />
For low densities the horizontal and vertical <strong>cone</strong> resistance are<br />
almost equal. This ratio apparently does not depends on the gra<strong>in</strong><br />
size distribution of the <strong>sand</strong>.<br />
The horizontal sleeve friction on the other hand is <strong>in</strong> most cases<br />
lower than the vertical sleeve friction, but the ratio depends on the<br />
gra<strong>in</strong> size distribution of the <strong>sand</strong>. For coarse <strong>sand</strong>s with hardly any<br />
f<strong>in</strong>es the horizontal friction ratio is apprximately 60% of the vertical<br />
friction ratio, whereas for f<strong>in</strong>e <strong>sand</strong>s with a low f<strong>in</strong>es content it can<br />
be equal or even somewhat larger than the vertical friction ratio.<br />
The observed differences <strong>in</strong> both horizontal <strong>cone</strong> resistance and<br />
sleeve friction will lead to shifts <strong>in</strong> the boundaries between different<br />
soil types <strong>in</strong> a soil classification chart based on HCPT, as compared<br />
to those composed from vertical <strong>penetration</strong> tests. As there is at<br />
present limited HCPT data available no reliable classification chart<br />
encompass<strong>in</strong>g all soil types can be drawn yet. When an exist<strong>in</strong>g<br />
classification chart is used to identify soil based on HCPT data care<br />
should be taken with respect to the differences between horizontal<br />
and vertical CPT stated above.<br />
REFERENCES<br />
Broere, W. 2001. Tunnel Face Stability & New CPT Applications. PhD<br />
thesis, Delft University of Technology, Delft.<br />
Broere, W. & A.F. van Tol 1998. <strong>Horizontal</strong> <strong>cone</strong> <strong>penetration</strong> <strong>test<strong>in</strong>g</strong>. In<br />
Robertson, P.K. & P.W. Mayne (eds), <strong>Geo</strong>technical Site Characterization,<br />
Proc. ISC’98, pp. 989–994. Balkema.<br />
Deen, J.K. van, G. Greeuw, R. van den Hondel, M.Th. van Staveren, F.J.M.<br />
Hoefsloot & B. Vanhout 1999. Horizonal CPTs for reconnaissance before<br />
the TBM front. In Barends, F.B.J., J. L<strong>in</strong>denberg, H.J. Luger,<br />
L. de Quelerij & A. Verruijt (eds), XII. ECSMGE <strong>Geo</strong>technical Eng<strong>in</strong>eer<strong>in</strong>g<br />
for Transportation Infrastructure, pp. 2023–2030. Rotterdam,<br />
Balkema.<br />
Houlsby, G.T. & R. Hitchman 1988. Calibration chamber tests of a <strong>cone</strong><br />
penetrometer <strong>in</strong> <strong>sand</strong>. Géotechnique, 38(1):39–44.<br />
Lunne, T., P.K. Robertson & J.J.M. Powell 1997. Cone Penetration Test<strong>in</strong>g<br />
<strong>in</strong> <strong>Geo</strong>technical Practice. London, Blackie.<br />
Park<strong>in</strong>, A.K. 1988. The calibration of <strong>cone</strong> penetrometers. In Ruiter, J. de<br />
(ed.), Penetration Test<strong>in</strong>g 1988, pp. 221–243. Rotterdam, Balkema.<br />
Schmertmann, J.H. 1975. Measurement of <strong>in</strong> situ shear strength. In<br />
ASCE Specialty Conference on In Situ Measurements of Soil Properties,<br />
volume II, pp. 57–138. New York, ASCE.<br />
Wroth, C.P. 1984. The <strong>in</strong>terpretation of <strong>in</strong> situ soil tests. Géotechnique,<br />
34(4):449–489.<br />
4 Impact on Soil Classification Charts<br />
Several soil classification charts based on corrected <strong>cone</strong> resistance<br />
q t and friction ratio R f have been presented <strong>in</strong> literature. See e.g.<br />
Lunne et al. (1998) for an overview of the most common charts.<br />
Given the differences noted above between vertical CPT and HCPT<br />
4