Effectiveness of Marine Protected Areas in the Philippines for ...
Effectiveness of Marine Protected Areas in the Philippines for ...
Effectiveness of Marine Protected Areas in the Philippines for ...

Create successful ePaper yourself
Turn your PDF publications into a flip-book with our unique Google optimized e-Paper software.
Contributed Paper<br />
<strong>Effectiveness</strong> <strong>of</strong> <strong>Mar<strong>in</strong>e</strong> <strong>Protected</strong> <strong>Areas</strong> <strong>in</strong> <strong>the</strong><br />
Philipp<strong>in</strong>es <strong>for</strong> Biodiversity Conservation<br />
REBECCA WEEKS, ∗ GARRY R. RUSS,† ANGEL C. ALCALA,‡ AND ALAN T. WHITE§<br />
∗ School <strong>of</strong> <strong>Mar<strong>in</strong>e</strong> and Tropical Biology and Australian Research Council Centre <strong>of</strong> Excellence <strong>for</strong> Coral Reef Studies, James Cook<br />
University, Townsville, Queensland 4811, Australia, email rebecca.weeks@jcu.edu.au<br />
†School <strong>of</strong> <strong>Mar<strong>in</strong>e</strong> and Tropical Biology and Australian Research Council Centre <strong>of</strong> Excellence <strong>for</strong> Coral Reef Studies, James Cook<br />
University, Townsville, Queensland 4811, Australia<br />
‡Silliman University Angelo K<strong>in</strong>g Center <strong>for</strong> Research and Environmental Management, Silliman University, Dumaguete City 6200,<br />
Philipp<strong>in</strong>es<br />
§Asia-Pacific Program, The Nature Conservancy, 923 Nuùanu Avenue, Honolulu, HI 96817, U.S.A.<br />
Abstract: Quantify<strong>in</strong>g <strong>the</strong> extent to which exist<strong>in</strong>g reserves meet conservation objectives and identify<strong>in</strong>g<br />
gaps <strong>in</strong> coverage are vital to develop<strong>in</strong>g systematic protected-area networks. Despite widespread recognition<br />
<strong>of</strong> <strong>the</strong> Philipp<strong>in</strong>es as a global priority <strong>for</strong> mar<strong>in</strong>e conservation, limited work has been undertaken to evaluate<br />
<strong>the</strong> conservation effectiveness <strong>of</strong> exist<strong>in</strong>g mar<strong>in</strong>e protected areas (MPAs). Targets <strong>for</strong> MPA coverage <strong>in</strong><br />
<strong>the</strong> Philipp<strong>in</strong>es have been specified <strong>in</strong> <strong>the</strong> 1998 Fisheries Code legislation, which calls <strong>for</strong> 15% <strong>of</strong> coastal<br />
municipal waters (with<strong>in</strong> 15 km <strong>of</strong> <strong>the</strong> coastl<strong>in</strong>e) to be protected with<strong>in</strong> no-take MPAs, and <strong>the</strong> Philipp<strong>in</strong>e<br />
<strong>Mar<strong>in</strong>e</strong> Sanctuary Strategy (2004), which aims to protect 10% <strong>of</strong> coral reef area <strong>in</strong> no-take MPAs by 2020.<br />
We used a newly compiled database <strong>of</strong> nearly 1000 MPAs to measure progress toward <strong>the</strong>se targets. We<br />
evaluated conservation effectiveness <strong>of</strong> MPAs <strong>in</strong> two ways. First, we determ<strong>in</strong>ed <strong>the</strong> degree to which mar<strong>in</strong>e<br />
bioregions and conservation priority areas are represented with<strong>in</strong> exist<strong>in</strong>g MPAs. Second, we assessed <strong>the</strong><br />
size and spac<strong>in</strong>g patterns <strong>of</strong> reserves <strong>in</strong> terms <strong>of</strong> best-practice recommendations. We found that <strong>the</strong> current<br />
extent and distribution <strong>of</strong> MPAs does not adequately represent biodiversity. At present just 0.5% <strong>of</strong> municipal<br />
waters and 2.7–3.4% <strong>of</strong> coral reef area <strong>in</strong> <strong>the</strong> Philipp<strong>in</strong>es are protected <strong>in</strong> no-take MPAs. Moreover,<br />
85% <strong>of</strong> no-take area is <strong>in</strong> just two sites; 90% <strong>of</strong> MPAs are
2 <strong>Effectiveness</strong> <strong>of</strong> <strong>Mar<strong>in</strong>e</strong> <strong>Protected</strong> <strong>Areas</strong><br />
Filip<strong>in</strong>a de Santuarios Mar<strong>in</strong>os (2004), que pretende proteger 10% del área de arrecifes de coral en AMP<br />
s<strong>in</strong> captura para 2020. Utilizamos una base de datos de cerca de 1000 AMP recién compilada para medir<br />
el progreso hacia esas metas. Evaluamos la efectividad de la conservación de las AMP de dos maneras.<br />
Primero, determ<strong>in</strong>amos el nivel de representación de las bioregiones mar<strong>in</strong>as y las áreas prioritarias en las<br />
AMP existentes. Segundo, evaluamos el tamaño y los patrones espaciales de las reservas en térm<strong>in</strong>os de las<br />
recomendaciones para las mejores prácticas. Encontramos que la extensión y distribución actual de las AMP<br />
no representa la biodiversidad adecuadamente. Actualmente, solo 0.5% de las aguas municipales y 2.7–3.4%<br />
de la superficie de arrecife de coral en las Filip<strong>in</strong>as está protegidoenAMPs<strong>in</strong>captura.Más aun, 85% de<br />
la superficie s<strong>in</strong> captura está en solo dos sitios; 90% de las AMP tienen
Weeks et al. 3<br />
WCMC 2007], MPA Global [Wood 2007]), and peerreviewed<br />
and gray literature. We compiled <strong>the</strong>se data<br />
<strong>in</strong>to a new geodatabase <strong>of</strong> Philipp<strong>in</strong>e MPAs with ArcGIS<br />
(version 9.2; ESRI, Redlands, Cali<strong>for</strong>nia). We removed<br />
duplicate records, comb<strong>in</strong>ed records that were dist<strong>in</strong>ct<br />
zones with<strong>in</strong> a s<strong>in</strong>gle protected area (e.g., core and buffer<br />
zones), and used <strong>the</strong> rema<strong>in</strong><strong>in</strong>g 985 MPAs <strong>in</strong> our analyses.<br />
We split MPAs <strong>in</strong>to two categories on <strong>the</strong> basis <strong>of</strong> <strong>the</strong>ir<br />
governance. Community-based MPAs were those designated<br />
under local or municipal level ord<strong>in</strong>ances and governed<br />
by community organizations with or without assistance<br />
from local government units (White et al. 2006a).<br />
Nationally designated sites were those designated under<br />
<strong>the</strong> National Integrated <strong>Protected</strong> <strong>Areas</strong> System (NIPAS)<br />
Act (1992) or Ramsar Convention or declared as World<br />
Heritage Sites under <strong>the</strong> United Nations Educational, Scientific,<br />
and Cultural Organization (UNESCO) legislation<br />
and governed primarily by a national government agency.<br />
Many database records were <strong>in</strong>complete, with miss<strong>in</strong>g<br />
data values <strong>for</strong> one or more data fields. Ra<strong>the</strong>r than exclud<strong>in</strong>g<br />
sites without all spatial <strong>in</strong><strong>for</strong>mation (n = 385),<br />
which would have resulted <strong>in</strong> an underestimate <strong>of</strong> MPA<br />
extent, we substituted <strong>in</strong>complete records <strong>of</strong> MPA size<br />
with median values <strong>for</strong> that MPA type (nationally designated<br />
= 64.57 km 2 , community-based = 0.12 km 2 ).<br />
Geographical coord<strong>in</strong>ates were available <strong>for</strong> 43% <strong>of</strong> sites;<br />
<strong>the</strong> location <strong>of</strong> o<strong>the</strong>r sites was only available to municipality<br />
(56%) or prov<strong>in</strong>cial (1%) level. We estimated <strong>the</strong><br />
locations <strong>for</strong> <strong>the</strong>se sites us<strong>in</strong>g a gazetteer.<br />
Conservation <strong>Effectiveness</strong><br />
A gap analysis provides a framework <strong>for</strong> assess<strong>in</strong>g <strong>the</strong><br />
extent to which biodiversity features are represented<br />
with<strong>in</strong> a protected-area network (Jenn<strong>in</strong>gs 2000). We<br />
used this approach to determ<strong>in</strong>e how well exist<strong>in</strong>g MPAs<br />
<strong>in</strong> <strong>the</strong> Philipp<strong>in</strong>es represent mar<strong>in</strong>e bioregions, conservation<br />
priority areas, and mar<strong>in</strong>e corridors identified by<br />
<strong>the</strong> Philipp<strong>in</strong>e Biodiversity Conservation Priority-Sett<strong>in</strong>g<br />
Program (Ong et al. 2002). Six mar<strong>in</strong>e bioregions, 35<br />
<strong>in</strong>tegrated priority areas, and n<strong>in</strong>e mar<strong>in</strong>e biodiversity<br />
corridors were identified through a series <strong>of</strong> expert workshops.<br />
Bioregion del<strong>in</strong>eation was determ<strong>in</strong>ed on <strong>the</strong> basis<br />
<strong>of</strong> <strong>the</strong> geology <strong>of</strong> <strong>the</strong> Philipp<strong>in</strong>e archipelago and extant<br />
reef fish assemblages. Priority areas were identified on<br />
<strong>the</strong> basis <strong>of</strong> biogeographic representativeness, ecosystem<br />
diversity, ecosystem function, threat status, species richness,<br />
and endemism. <strong>Areas</strong> identified as priorities <strong>for</strong> 11<br />
taxonomic groups (cetaceans, dugongs, seagrasses, seaweed,<br />
corals, mangroves, molluscs, reef fishes, turtles,<br />
elasmobranchs, and whale sharks) were <strong>in</strong>tegrated and<br />
classified <strong>in</strong>to extremely high (n = 13), very high (n =<br />
12), and high (n = 10) priorities. <strong>Mar<strong>in</strong>e</strong> biodiversity<br />
corridors were identified as <strong>the</strong> areas <strong>of</strong> importance <strong>for</strong><br />
connectivity between bioregions (Ong et al. 2002).<br />
We overlaid polygon feature layers <strong>for</strong> <strong>the</strong> bioregions,<br />
priority areas, and corridors with a po<strong>in</strong>t-feature shapefile<br />
<strong>of</strong> <strong>the</strong> locations <strong>of</strong> MPAs. To quantify <strong>the</strong> degree to<br />
which each feature was represented by exist<strong>in</strong>g MPAs,<br />
we identified MPAs occurr<strong>in</strong>g with<strong>in</strong> each feature polygon<br />
and summed <strong>the</strong>ir area and no-take area from <strong>the</strong><br />
MPA attribute table. We determ<strong>in</strong>ed levels <strong>of</strong> representation<br />
as <strong>the</strong> percentage <strong>of</strong> <strong>the</strong> area <strong>of</strong> each biodiversity<br />
feature with<strong>in</strong> MPAs.<br />
In addition to quantify<strong>in</strong>g current levels <strong>of</strong> representation,<br />
we estimated whe<strong>the</strong>r exist<strong>in</strong>g MPAs represent<br />
biodiversity better than would be expected by chance.<br />
We compared <strong>the</strong> observed number and area <strong>of</strong> MPAs<br />
occurr<strong>in</strong>g <strong>in</strong> each bioregion with <strong>the</strong> expected number<br />
on <strong>the</strong> basis <strong>of</strong> <strong>the</strong> null hypo<strong>the</strong>sis that <strong>the</strong> distribution <strong>of</strong><br />
MPAs is proportional to <strong>the</strong> area <strong>of</strong> municipal waters <strong>in</strong><br />
each bioregion. We also compared <strong>the</strong> number <strong>of</strong> MPAs<br />
with<strong>in</strong> priority regions with <strong>the</strong> mean number occurr<strong>in</strong>g<br />
with<strong>in</strong> 100 random distributions generated with Hawth’s<br />
Analysis random po<strong>in</strong>ts tool <strong>for</strong> ArcGIS (Beyer 2004).<br />
We used a size–frequency distribution to identify <strong>the</strong><br />
proportion <strong>of</strong> MPAs that meet m<strong>in</strong>imum size requirements<br />
on <strong>the</strong> basis <strong>of</strong> recommendations <strong>in</strong> <strong>the</strong> literature.<br />
We <strong>the</strong>n per<strong>for</strong>med a simple analysis <strong>of</strong> connectivity between<br />
MPAs by calculat<strong>in</strong>g <strong>the</strong> Euclidean distance to <strong>the</strong><br />
nearest MPA <strong>for</strong> each site. The observed <strong>in</strong>ter-MPA distances<br />
were compared with recommendations <strong>for</strong> MPA<br />
network design taken from Shanks (2003) and Jones<br />
et al. (2008).<br />
Feasibility <strong>of</strong> Atta<strong>in</strong><strong>in</strong>g Conservation Targets<br />
We assessed <strong>the</strong> feasibility <strong>of</strong> meet<strong>in</strong>g MPA coverage targets<br />
under a best-case scenario <strong>of</strong> one no-take MPA designated<br />
<strong>for</strong> every coastal barangay (<strong>the</strong> smallest political<br />
unit with<strong>in</strong> a city or municipal government). Although<br />
optimistic, this scenario is <strong>the</strong>oretically viable given that<br />
at least four municipalities have achieved this target. Annual<br />
growth rates <strong>of</strong> MPA implementation used to predict<br />
target atta<strong>in</strong>ment dates were assumed to be <strong>the</strong> maximum<br />
historical rate (97 MPAs per year <strong>in</strong> 2002). The<br />
future MPAs were assumed to be <strong>the</strong> current median size<br />
<strong>of</strong> community-based MPAs and to be located on coral<br />
reefs.<br />
Results<br />
MPA Extent<br />
As <strong>of</strong> 2008 at least 985 MPAs had been established <strong>in</strong><br />
<strong>the</strong> Philipp<strong>in</strong>es (Fig. 1), and <strong>the</strong>y covered approximately<br />
14,943 km 2 . Of <strong>the</strong>se, 942 MPAs had a no-take component,<br />
with a comb<strong>in</strong>ed no-take area <strong>of</strong> 1459 km 2 .<br />
Thus, 4.9% <strong>of</strong> coastal municipal waters (with<strong>in</strong> 15 km<br />
<strong>of</strong> <strong>the</strong> coastl<strong>in</strong>e) were protected with<strong>in</strong> MPAs, with 0.5%<br />
with<strong>in</strong> no-take areas. Estimates <strong>of</strong> coral reef area <strong>in</strong> <strong>the</strong><br />
Conservation Biology<br />
Volume **, No. *, 2009
4 <strong>Effectiveness</strong> <strong>of</strong> <strong>Mar<strong>in</strong>e</strong> <strong>Protected</strong> <strong>Areas</strong><br />
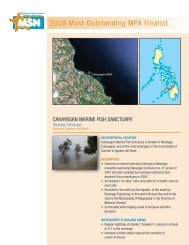
Figure 1. Distribution <strong>of</strong> mar<strong>in</strong>e protected areas (MPAs) throughout <strong>the</strong> Philipp<strong>in</strong>es (mar<strong>in</strong>e bioregions and<br />
corridors identified by Ong et al. [2002]). The enlarged area shows <strong>the</strong> highest concentration <strong>of</strong> MPAs <strong>in</strong> <strong>the</strong><br />
Visayan Sea bioregion. The MPAs with <strong>the</strong> largest no-take areas are Tubbataha Reef National Park and Apo Reef<br />
Natural Park. Siargao <strong>Protected</strong> Landscape and Seascape is <strong>the</strong> largest <strong>in</strong>dividual MPA, although some <strong>for</strong>ms <strong>of</strong><br />
fish<strong>in</strong>g are allowed <strong>in</strong> much <strong>of</strong> its area. The Turtle Islands Wildlife Sanctuary is <strong>the</strong> most isolated MPA.<br />
Conservation Biology<br />
Volume **, No. *, 2009
Weeks et al. 5<br />
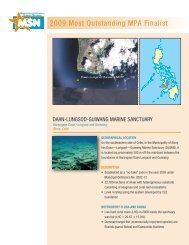
Figure 2. Cumulative growth <strong>in</strong> <strong>the</strong> number (l<strong>in</strong>es) and area (bars) <strong>of</strong> mar<strong>in</strong>e protected areas (MPAs) <strong>in</strong> <strong>the</strong><br />
Philipp<strong>in</strong>es between 1970 and 2008. Only MPAs with data available <strong>for</strong> year <strong>of</strong> designation are plotted<br />
( n = 527).<br />
Philipp<strong>in</strong>es varied between 20,000 km 2 (A.C.A, personal<br />
communication) and 26,000 km 2 (Burke et al. 2002). Account<strong>in</strong>g<br />
<strong>for</strong> this potential range, we estimated that between<br />
2.7% and 3.4% <strong>of</strong> coral reef area <strong>in</strong> <strong>the</strong> Philipp<strong>in</strong>es<br />
is protected with<strong>in</strong> no-take MPAs. Communitybased<br />
MPAs comprised 95% <strong>of</strong> records <strong>in</strong> our database,<br />
with a comb<strong>in</strong>ed estimated area <strong>of</strong> 628 km 2 and no-take<br />
area <strong>of</strong> 206 km 2 .<br />
There was an almost-exponential <strong>in</strong>crease <strong>in</strong> <strong>the</strong> number<br />
and area <strong>of</strong> MPAs <strong>in</strong> <strong>the</strong> Philipp<strong>in</strong>es follow<strong>in</strong>g passage<br />
<strong>of</strong> <strong>the</strong> Local Government Code <strong>in</strong> 1991 (Fig. 2). Almost<br />
50% <strong>of</strong> current MPAs were established be<strong>for</strong>e <strong>the</strong> Fisheries<br />
Code <strong>of</strong> 1998, which set <strong>the</strong> target <strong>of</strong> 15% <strong>of</strong> coastal<br />
municipal waters with<strong>in</strong> no-take MPAs. The <strong>in</strong>crease <strong>in</strong><br />
area <strong>of</strong> no-take MPAs has been more modest, with notable<br />
<strong>in</strong>creases <strong>in</strong> 1983, 1988, and 2007 with <strong>the</strong> declaration<br />
and expansion <strong>of</strong> two large no-take MPAs, Tubbataha<br />
Reef National Park (968 km 2 )andApoReefNaturalPark<br />
(275 km 2 ) (Fig. 2). Growth <strong>in</strong> <strong>the</strong> number and area <strong>of</strong><br />
MPAs slowed after 2002. We believe, however, this is<br />
due to a time lag between MPA implementation and appearance<br />
<strong>in</strong> databases, ra<strong>the</strong>r than a real decl<strong>in</strong>e <strong>in</strong> <strong>the</strong><br />
number <strong>of</strong> sites be<strong>in</strong>g designated (Fig. 2).<br />
Representation <strong>of</strong> Bioregions, Priority <strong>Areas</strong>, and Corridors<br />
The number and extent <strong>of</strong> MPAs varied among different<br />
mar<strong>in</strong>e bioregions (number: χ 2 = 368.90, df=5,<br />
p < 0.001, extent: χ 2 = 2641.46, df=5, p < 0.001). The<br />
Visayan Sea bioregion had 67% <strong>of</strong> all MPAs, 2.5 times<br />
more than expected on <strong>the</strong> basis <strong>of</strong> its municipal water<br />
area (Fig. 1, Table 1). The Sulu Sea bioregion had<br />
nearly three times fewer MPAs than expected. Never<strong>the</strong>less,<br />
<strong>in</strong> terms <strong>of</strong> <strong>the</strong> total area <strong>of</strong> MPAs, <strong>the</strong> Sulu Sea and<br />
South Ch<strong>in</strong>a Sea bioregions were best protected, with<br />
1.25% and 0.66% <strong>of</strong> <strong>the</strong>ir municipal water area with<strong>in</strong> notake<br />
MPAs, respectively (Table 1). These bioregions conta<strong>in</strong>ed<br />
<strong>the</strong> large no-take areas <strong>of</strong> Tubbataha Reef National<br />
Park and Apo Reef Natural Park, respectively (Fig. 1).<br />
The high number <strong>of</strong> MPAs <strong>in</strong> <strong>the</strong> Visayan Sea did not result<br />
<strong>in</strong> a large area protected; only 1.50% <strong>of</strong> municipal<br />
waters were with<strong>in</strong> MPAs and 0.17% were with<strong>in</strong> notake<br />
MPAs (Table 1). No-take area <strong>of</strong> <strong>in</strong>dividual MPAs did<br />
not differ significantly among bioregions (Kruskal–Wallis,<br />
χ 2 = 3.47, df=5, p = 0.6285).<br />
Distance to <strong>the</strong> nearest neighbor <strong>for</strong> exist<strong>in</strong>g MPAs was<br />
significantly smaller than expected from <strong>the</strong> random distributions<br />
<strong>of</strong> MPAs (nearest neighbor ratio = 0.314, p <<br />
0.001, and bootstrapped p value from 10,000 iterations).<br />
Philipp<strong>in</strong>e MPAs were clustered <strong>in</strong> <strong>the</strong> sou<strong>the</strong>rn area <strong>of</strong><br />
<strong>the</strong> Visayan Sea bioregion (Fig. 1).<br />
Representation <strong>of</strong> mar<strong>in</strong>e conservation priority areas<br />
with<strong>in</strong> no-take MPAs varied between 0% and 48%. The<br />
Tubbataha Reef priority area was best represented, with<br />
48% coverage with<strong>in</strong> a s<strong>in</strong>gle large no-take MPA. Two very<br />
high-priority regions (Balabac Island and Cuyo Islands)<br />
did not conta<strong>in</strong> any MPAs. <strong>Mar<strong>in</strong>e</strong> corridors were not well<br />
represented by current MPAs; four <strong>of</strong> <strong>the</strong> n<strong>in</strong>e corridors<br />
did not conta<strong>in</strong> any MPAs. At best, <strong>the</strong> M<strong>in</strong>doro Calavite<br />
Conservation Biology<br />
Volume **, No. *, 2009
6 <strong>Effectiveness</strong> <strong>of</strong> <strong>Mar<strong>in</strong>e</strong> <strong>Protected</strong> <strong>Areas</strong><br />
Table 1. Representation <strong>of</strong> mar<strong>in</strong>e bioregions with<strong>in</strong> Philipp<strong>in</strong>e mar<strong>in</strong>e protected areas (MPAs).<br />
Number<br />
MPA coverage (km 2 )<br />
Municipal waters b<br />
protected (%)<br />
<strong>Mar<strong>in</strong>e</strong> bioregion a <strong>of</strong> MPAs all no take all no take<br />
Celebes Sea 50 2345.13 7.37 6.77 0.02<br />
Nor<strong>the</strong>rn Philipp<strong>in</strong>e Sea 35 2469.60 7.54 6.52 0.02<br />
South Ch<strong>in</strong>a Sea 51 1836.93 283.71 4.26 0.66<br />
Sou<strong>the</strong>rn Philipp<strong>in</strong>e Sea 102 3500.02 33.16 12.67 0.12<br />
Sulu Sea 90 3573.35 991.29 4.52 1.25<br />
Visayan Sea 663 1219.50 136.50 1.50 0.17<br />
a <strong>Mar<strong>in</strong>e</strong> bioregions taken from Ong et. al. (2002).<br />
b Municipal water boundaries (15 km <strong>of</strong>fshore) were calculated follow<strong>in</strong>g DENR (2001).<br />
Tablas Triangle had 1.24% <strong>of</strong> its area <strong>in</strong>side no-take<br />
MPAs.<br />
<strong>Mar<strong>in</strong>e</strong> protected areas represented priority areas <strong>for</strong><br />
mar<strong>in</strong>e conservation better than expected if <strong>the</strong>y were<br />
placed randomly (t test, t =−5.2797, df=99, p < 0.001).<br />
More than 50% <strong>of</strong> total MPA area and 70% <strong>of</strong> total no-take<br />
area was with<strong>in</strong> extremely high priority regions. This<br />
result was due, however, to <strong>the</strong> location <strong>of</strong> <strong>the</strong> largest<br />
no-take area <strong>in</strong> <strong>the</strong> Philipp<strong>in</strong>es (Tubbataha Reef MPA)<br />
be<strong>in</strong>g <strong>in</strong> an extremely high priority region.<br />
Size and Spac<strong>in</strong>g <strong>of</strong> Individual MPAs<br />
The size <strong>of</strong> MPAs ranged from 0.01 km 2 to 2789.14 km 2<br />
(Siargao <strong>Protected</strong> Landscape and Seascape, Fig. 1) (mean<br />
23.60 km 2 and median 0.15 km 2 , n = 604) (Fig. 3).<br />
The no-take area <strong>of</strong> MPAs ranged from 0.01 km 2 to<br />
968.28 km 2 (mean 2.48 km 2 and median 0.12 km 2 , n =<br />
571). The substantial difference between mean and median<br />
no-take area was due to <strong>the</strong> disproportionate contribution<br />
<strong>of</strong> <strong>the</strong> two largest no-take MPAs, Tubbataha Reef<br />
National Park (968.28 km 2 ) and Apo Reef Natural Park<br />
(274.69 km 2 ) (Fig. 1). These two MPAs have >85% <strong>of</strong><br />
<strong>the</strong> total extent <strong>of</strong> no-take area <strong>in</strong> <strong>the</strong> Philipp<strong>in</strong>es. N<strong>in</strong>ety<br />
percent <strong>of</strong> all MPAs <strong>for</strong> which spatial data were available<br />
had a total area <strong>of</strong>
Weeks et al. 7<br />
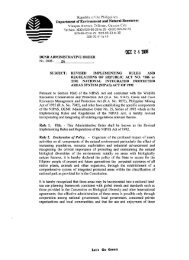
Figure 4. Frequency <strong>of</strong> distance<br />
to <strong>the</strong> nearest mar<strong>in</strong>e protected<br />
area (MPA), show<strong>in</strong>g<br />
recommended distances between<br />
MPAs <strong>in</strong> a network designed on<br />
<strong>the</strong> basis <strong>of</strong> predicted larval<br />
dispersal distances taken from<br />
(a) Jones et al. (2008) and (b)<br />
Shanks (2003). All locations are<br />
estimated to be accurate to<br />
with<strong>in</strong> 5 km. Euclidean distance<br />
between MPAs was measured<br />
with <strong>the</strong> Hawth’s analysis<br />
distance between po<strong>in</strong>ts ( Beyer<br />
2004) extension <strong>for</strong> ArcGIS.<br />
<strong>in</strong> no-take MPAs (Table 2). This fails to achieve Fisheries<br />
Code or Philipp<strong>in</strong>e <strong>Mar<strong>in</strong>e</strong> Sanctuary Strategy targets.<br />
To achieve <strong>the</strong> Philipp<strong>in</strong>e <strong>Mar<strong>in</strong>e</strong> Sanctuary Strategy<br />
target <strong>of</strong> 10% <strong>of</strong> coral reef area <strong>in</strong> no-take MPAs, an additional<br />
2030 km 2 <strong>of</strong> coral reef no-take area is required.<br />
If one community-based no-take MPA were established<br />
per coastal barangay, an <strong>in</strong>crease <strong>in</strong> <strong>the</strong> size <strong>of</strong> no-take<br />
MPAs to 0.31 km 2 would be required (Table 2), which is<br />
almost three times larger than <strong>the</strong> current median size.<br />
If <strong>the</strong> maximum historical rate <strong>of</strong> MPA implementation<br />
(97 MPAs per year <strong>in</strong> 2002) were to cont<strong>in</strong>ue, this target<br />
would not be reached until 2076. To meet <strong>the</strong> target by<br />
2020 would require <strong>the</strong> designation <strong>of</strong> at least 545 MPAs<br />
(≥0.31 km 2 )everyyear.<br />
Table 2. Percentage <strong>of</strong> target area protected under different no-take<br />
mar<strong>in</strong>e-protected-area (MPA) scenarios.<br />
1 km Reef<br />
Municipal <strong>of</strong>fshore area b<br />
Scenario a waters (%) (%) (%)<br />
Current 0.48 5.02 1.89 c<br />
Current, plus 1 MPA/coastal 0.27 2.78 7.28<br />
barangay (0.12 km 2 )<br />
Current, plus 1 MPA/coastal<br />
barangay (0.31 km 2 )<br />
1.19 12.2 10.24<br />
a A barangay is <strong>the</strong> smallest political unit with<strong>in</strong> a city or municipal<br />
government.<br />
b Reef area estimate taken from Spald<strong>in</strong>g et al. (2001).<br />
c Accounts <strong>for</strong> <strong>the</strong> reef area only <strong>in</strong> Tubbataha Reef and Apo Reef<br />
MPAs.<br />
Discussion<br />
Our results provide <strong>the</strong> first comprehensive nationalscale<br />
assessment <strong>of</strong> <strong>the</strong> conservation effectiveness <strong>of</strong><br />
MPAs <strong>in</strong> <strong>the</strong> Philipp<strong>in</strong>es. Results <strong>in</strong>dicate that <strong>the</strong> current<br />
extent, distribution, and size <strong>of</strong> MPAs are <strong>in</strong>adequate<br />
to fulfill conservation objectives at this scale.<br />
Although <strong>in</strong>dividual MPAs can achieve local-scale fisheries<br />
objectives (e.g., Alcala & Russ 2006), <strong>the</strong>y do<br />
not constitute a comprehensive national MPA network<br />
that is needed to achieve an adequate representation <strong>of</strong><br />
biodiversity.<br />
We estimated that 0.5% <strong>of</strong> coastal municipal waters<br />
and between 2.7% and 3.4% <strong>of</strong> coral reef area <strong>in</strong> <strong>the</strong><br />
Philipp<strong>in</strong>es are currently protected with<strong>in</strong> no-take MPAs.<br />
This falls well short <strong>of</strong> legislated targets. Although <strong>the</strong>re<br />
is some uncerta<strong>in</strong>ty <strong>in</strong> our estimate <strong>of</strong> <strong>the</strong> extent <strong>of</strong> MPA<br />
coverage as a result <strong>of</strong> sites with miss<strong>in</strong>g spatial <strong>in</strong><strong>for</strong>mation,<br />
this is unlikely to alter our results significantly.<br />
Assign<strong>in</strong>g m<strong>in</strong>imum (0.01 km 2 ), median (0.12 km 2 ), or<br />
mean (0.28 km 2 ) values to sites with miss<strong>in</strong>g size data<br />
resulted <strong>in</strong> a maximum difference <strong>in</strong> estimates <strong>of</strong> 63 km 2<br />
<strong>of</strong> no-take area. This difference is
8 <strong>Effectiveness</strong> <strong>of</strong> <strong>Mar<strong>in</strong>e</strong> <strong>Protected</strong> <strong>Areas</strong><br />
<strong>in</strong> <strong>the</strong> country, it does not appear to be an achievable or<br />
appropriate goal. Without more specific guidance as to<br />
how biodiversity should be protected (e.g., proportional<br />
representation <strong>of</strong> habitat types), it would be possible to<br />
fulfill <strong>the</strong> legislated requirements by establish<strong>in</strong>g MPAs<br />
exclusively between 10 km and 15 km <strong>of</strong>fshore, but such<br />
an action would not protect <strong>the</strong> coral reef ecosystems<br />
that are most at threat from overexploitation.<br />
The Philipp<strong>in</strong>e <strong>Mar<strong>in</strong>e</strong> Sanctuary Strategy target was<br />
agreed upon through a series <strong>of</strong> expert workshops (P.M.<br />
Al<strong>in</strong>o, personal communication) and has a more solid scientific<br />
basis. This target was adopted <strong>in</strong> <strong>the</strong> Draft National<br />
Plan <strong>of</strong> Action <strong>of</strong> <strong>the</strong> Philipp<strong>in</strong>es under <strong>the</strong> Coral Triangle<br />
Initiative. Never<strong>the</strong>less, <strong>the</strong> target <strong>of</strong> protect<strong>in</strong>g 10% <strong>of</strong><br />
reef area falls short <strong>of</strong> general recommendations that a<br />
m<strong>in</strong>imum <strong>of</strong> 20% and an optimum <strong>of</strong> 30%–50% <strong>of</strong> area be<br />
set aside <strong>in</strong> mar<strong>in</strong>e reserves (Roberts et al. 2002a; Airame<br />
et al. 2003; Jones et al. 2008).<br />
The distribution <strong>of</strong> MPAs <strong>in</strong> <strong>the</strong> Philipp<strong>in</strong>es is not representative<br />
<strong>of</strong> mar<strong>in</strong>e biodiversity. The Sulu Sea bioregion<br />
and mar<strong>in</strong>e biodiversity corridors, <strong>in</strong> particular, are<br />
poorly represented. The pronounced bias <strong>in</strong> <strong>the</strong> distribution<br />
<strong>of</strong> MPAs toward <strong>the</strong> Visayan Sea reflects <strong>the</strong> history<br />
<strong>of</strong> community-based management ef<strong>for</strong>ts, which orig<strong>in</strong>ated<br />
at Sumilon and Apo islands (Alcala & Russ 2006)<br />
and <strong>the</strong> locations <strong>of</strong> NGOs and academic <strong>in</strong>stitutions that<br />
cont<strong>in</strong>ue to facilitate <strong>the</strong> establishment <strong>of</strong> MPAs <strong>in</strong> that<br />
region (Pollnac et al. 2001; White et al. 2002, 2006b).<br />
Although representation <strong>of</strong> bioregions does not confer<br />
protection <strong>of</strong> features and processes occurr<strong>in</strong>g with<strong>in</strong><br />
<strong>the</strong>m, biogeographic classifications such as <strong>the</strong>se provide<br />
a useful framework <strong>for</strong> <strong>the</strong> assessment <strong>of</strong> protected-area<br />
representativeness where f<strong>in</strong>e-scale distribution data are<br />
unavailable (Day et al. 2002; Lourie & V<strong>in</strong>cent 2004).<br />
<strong>Areas</strong> identified as <strong>the</strong> highest priorities <strong>for</strong> mar<strong>in</strong>e<br />
conservation conta<strong>in</strong>ed more MPAs than expected by<br />
chance. This suggests that <strong>the</strong> distribution <strong>of</strong> MPAs may<br />
be targeted toward areas <strong>of</strong> conservation importance.<br />
Never<strong>the</strong>less, caution should be taken when <strong>in</strong>terpret<strong>in</strong>g<br />
this result. Prioritizations undertaken by expert work<strong>in</strong>g<br />
groups are liable to spatial and taxonomic bias toward areas<br />
<strong>of</strong> expertise <strong>of</strong> <strong>the</strong> participants. It is possible that <strong>the</strong><br />
del<strong>in</strong>eation <strong>of</strong> priority areas was <strong>in</strong>fluenced by <strong>the</strong> availability<br />
<strong>of</strong> biodiversity data, which is typically greatest <strong>in</strong><br />
regions with many MPAs. As such, it may be <strong>the</strong> case that<br />
<strong>the</strong> location <strong>of</strong> priority areas reflects <strong>the</strong> distribution <strong>of</strong><br />
MPAs, ra<strong>the</strong>r than vice versa.<br />
The size and spac<strong>in</strong>g <strong>of</strong> MPAs should be varied to account<br />
<strong>for</strong> natural variation <strong>in</strong> larval dispersal distances<br />
(Halpern & Warner 2003; Roberts et al. 2003; Jones et al.<br />
2008). Our results <strong>in</strong>dicate that Philipp<strong>in</strong>e MPAs do not<br />
con<strong>for</strong>m to this pattern. No fully protected MPAs were<br />
<strong>of</strong> <strong>in</strong>termediate size (10–100 km 2 ) as recommended by<br />
Halpern & Warner (2003), and only two no-take MPAs<br />
exceeded this size. The median no-take area <strong>of</strong> Philipp<strong>in</strong>e<br />
MPAs is just 0.12 km 2 , compared with 6 km 2 <strong>in</strong><br />
Lat<strong>in</strong> America and <strong>the</strong> Caribbean (Guarderas et al. 2008)<br />
and 4.6 km 2 globally (Wood et al. 2008). Recent evidence<br />
suggests that local retention <strong>of</strong> larvae is more common<br />
than previously thought (Almany et al. 2007; Planes<br />
et al. 2009), which <strong>in</strong>dicates that even small MPAs provide<br />
some recruitment benefits with<strong>in</strong> and close to <strong>the</strong>ir<br />
boundaries (Planes et al. 2009). Never<strong>the</strong>less, such small<br />
MPAs are unlikely to provide protection <strong>for</strong> larger, more<br />
mobile species (Sale et al. 2005) and contribute little toward<br />
achiev<strong>in</strong>g regional conservation objectives, which<br />
are typically stated as percent area targets.<br />
Typically, Philipp<strong>in</strong>e MPAs are spaced 1–5 km apart,<br />
distances that are likely to promote larval connectivity<br />
(Shanks 2003; Jones et al. 2008). Connectivity is not determ<strong>in</strong>ed<br />
by distance alone, however, and larval dispersal<br />
models that account <strong>for</strong> <strong>the</strong> direction and strength <strong>of</strong> water<br />
movement and species’ larval characteristics would<br />
be required to better predict connectivity between MPAs<br />
(Planes et al. 2009).<br />
N<strong>in</strong>ety-five percent <strong>of</strong> MPAs <strong>in</strong> our database were<br />
community based. Although community-based MPAs<br />
have been widely proposed as a fisheries management<br />
tool that is compatible with biodiversity conservation<br />
objectives (Alcala & Russ 2006; Christie & White 2007),<br />
<strong>the</strong>ir contribution toward achiev<strong>in</strong>g conservation targets<br />
has <strong>of</strong>ten been overlooked because <strong>of</strong> <strong>the</strong>ir small size<br />
and poor levels <strong>of</strong> documentation. Previous attempts to<br />
assess <strong>the</strong> effectiveness <strong>of</strong> protected-area networks have<br />
excluded sites that did not meet criteria on <strong>the</strong> basis <strong>of</strong><br />
m<strong>in</strong>imum size or data availability. For example, Mora et<br />
al. (2006) excluded many MPAs because <strong>of</strong> <strong>the</strong>ir small<br />
size or lack <strong>of</strong> recognition by national governments. Rodrigues<br />
et al. (2004) only considered protected areas >1<br />
km 2 ; application <strong>of</strong> this criterion would have excluded<br />
93% <strong>of</strong> <strong>the</strong> MPAs <strong>in</strong> our database. Such criteria clearly<br />
underestimate <strong>the</strong> number and extent <strong>of</strong> MPAs <strong>in</strong> regions<br />
where community-based management prevails. The MPA<br />
Global Database (Wood 2007) currently lists 202 MPAs<br />
<strong>in</strong> <strong>the</strong> Philipp<strong>in</strong>es, just 20% <strong>of</strong> <strong>the</strong> sites we considered.<br />
Community-based MPAs constitute most <strong>of</strong> <strong>the</strong> number,<br />
but not <strong>the</strong> area <strong>of</strong> <strong>the</strong> MPAs <strong>in</strong> <strong>the</strong> Philipp<strong>in</strong>es. The<br />
future projections derived from a best-case scenario <strong>in</strong>dicated<br />
that even if adopted throughout <strong>the</strong> Philipp<strong>in</strong>es,<br />
community-based MPAs would not be sufficient to fulfill<br />
conservation targets without a significant <strong>in</strong>crease <strong>in</strong><br />
<strong>the</strong>ir size. Never<strong>the</strong>less, <strong>in</strong> <strong>the</strong> context <strong>of</strong> <strong>the</strong> Philipp<strong>in</strong>es,<br />
widespread <strong>in</strong>creases <strong>in</strong> <strong>the</strong> no-take area <strong>of</strong> MPAs are unlikely<br />
because <strong>of</strong> socioeconomic constra<strong>in</strong>ts imposed by<br />
<strong>the</strong> high dependence <strong>of</strong> local communities on mar<strong>in</strong>e<br />
resources and low spatial mobility <strong>of</strong> fishers.<br />
The <strong>in</strong>ability to meet conservation targets with<br />
community-based MPAs alone highlights <strong>the</strong> importance<br />
<strong>of</strong> large no-take areas such a Tubbataha Reef National Park<br />
and Apo Reef Natural Park. Toge<strong>the</strong>r <strong>the</strong>se two sites comprise<br />
more than 85% <strong>of</strong> <strong>the</strong> total no-take area <strong>of</strong> MPAs <strong>in</strong><br />
<strong>the</strong> Philipp<strong>in</strong>es. Never<strong>the</strong>less, much <strong>of</strong> this area is a buffer<br />
Conservation Biology<br />
Volume **, No. *, 2009
Weeks et al. 9<br />
zone <strong>in</strong> open sea, and as such does not conta<strong>in</strong> coral reef.<br />
Ensur<strong>in</strong>g <strong>the</strong> cont<strong>in</strong>ued protection <strong>of</strong> <strong>the</strong>se large no-take<br />
MPAs should be a high priority. Larger and more remote<br />
sites present a greater en<strong>for</strong>cement challenge (White &<br />
Palaganas 1991), but if managed well, funds generated<br />
through tourism can contribute toward costs (Tongson<br />
& Dygico 2004).<br />
Most <strong>of</strong> <strong>the</strong> large MPAs <strong>in</strong> <strong>the</strong> Philipp<strong>in</strong>es allow extractive<br />
activities with<strong>in</strong> <strong>the</strong>ir boundaries. Thus, <strong>the</strong>y provide<br />
little protection to mar<strong>in</strong>e biodiversity. They do, however,<br />
<strong>of</strong>fer an exist<strong>in</strong>g commitment to <strong>the</strong> management<br />
<strong>of</strong> mar<strong>in</strong>e resources. Opportunities may exist to <strong>in</strong>crease<br />
<strong>the</strong> conservation value <strong>of</strong> <strong>the</strong>se sites, ei<strong>the</strong>r through designat<strong>in</strong>g<br />
<strong>the</strong>ir entire area as no-take (Apo Reef Natural Park<br />
was established <strong>in</strong> 1996, but only became fully no-take <strong>in</strong><br />
2007) or by establish<strong>in</strong>g core no-take zones with<strong>in</strong> <strong>the</strong>m.<br />
This approach may be more expedient than identify<strong>in</strong>g<br />
new sites <strong>for</strong> large no-take MPAs.<br />
The number and area <strong>of</strong> MPAs can be mislead<strong>in</strong>g <strong>in</strong>dicators<br />
<strong>of</strong> conservation effectiveness if MPAs are not well<br />
managed and en<strong>for</strong>ced (McClanahan 1999; Chape et al.<br />
2005; Mora et al. 2006). Globally, MPA management effectiveness<br />
is low (Kelleher et al. 1995), and many MPAs<br />
fail to meet <strong>the</strong>ir management objectives (Jameson 2002).<br />
Fisheries benefits <strong>of</strong> MPAs <strong>in</strong> <strong>the</strong> Philipp<strong>in</strong>es are conditional<br />
on good levels <strong>of</strong> en<strong>for</strong>cement and compliance<br />
(Alcala & Russ 2006; Samoilys et al. 2007). The same is<br />
likely to be true <strong>for</strong> conservation benefits. Estimates <strong>of</strong><br />
<strong>the</strong> proportion <strong>of</strong> exist<strong>in</strong>g MPAs that are well managed<br />
and en<strong>for</strong>ced were made with data from <strong>the</strong> <strong>Mar<strong>in</strong>e</strong> <strong>Protected</strong><br />
Area Rat<strong>in</strong>g System (White et al. 2006b). Of <strong>the</strong><br />
251 MPAs surveyed, just 12% are rated as “susta<strong>in</strong>ed,”<br />
which means <strong>the</strong>y have a fully operational en<strong>for</strong>cement<br />
system, management plan, and monitor<strong>in</strong>g program. A<br />
fur<strong>the</strong>r 35% are rated as “en<strong>for</strong>ced.” If <strong>the</strong>se figures are<br />
accurate, our results are optimistic assessments <strong>of</strong> conservation<br />
effectiveness.<br />
A major challenge to quantify<strong>in</strong>g <strong>the</strong> extent <strong>of</strong> any<br />
protected-area system is <strong>the</strong> dynamic nature <strong>of</strong> <strong>the</strong> network<br />
itself and <strong>of</strong> <strong>the</strong> data available about it (Mora et al.<br />
2006). The MPA database we compiled is <strong>the</strong> most comprehensive<br />
to date <strong>for</strong> <strong>the</strong> Philipp<strong>in</strong>es. There are likely<br />
to be more MPAs, however, <strong>for</strong> which data were unavailable.<br />
Ongo<strong>in</strong>g ef<strong>for</strong>ts to collect and verify data <strong>for</strong> exist<strong>in</strong>g<br />
and newly designated MPAs will likely result <strong>in</strong> <strong>the</strong><br />
revised estimates <strong>of</strong> coverage and extent and will allow<br />
more comprehensive assessments <strong>of</strong> <strong>the</strong>ir effectiveness.<br />
Conclusions<br />
Our results <strong>in</strong>dicate an urgent need to expand <strong>the</strong> area<br />
with<strong>in</strong> no-take MPAs <strong>in</strong> <strong>the</strong> Philipp<strong>in</strong>es. This should be<br />
done strategically, to address biases <strong>in</strong> <strong>the</strong> representation<br />
<strong>of</strong> bioregions and target priority areas <strong>for</strong> mar<strong>in</strong>e conservation.<br />
The development <strong>of</strong> systematic, regional-scale<br />
networks <strong>of</strong> MPAs that address both fisheries susta<strong>in</strong>ability<br />
and biodiversity conservation objectives should be<br />
a priority. To better satisfy conservation objectives, we<br />
recommend that <strong>the</strong> Philipp<strong>in</strong>es work on three th<strong>in</strong>gs<br />
to improve MPA implementation and effectiveness. First,<br />
cont<strong>in</strong>ue ef<strong>for</strong>ts to <strong>in</strong>crease <strong>the</strong> number and, where possible,<br />
size <strong>of</strong> community-based MPAs. Second, designate<br />
additional large no-take areas specifically to address conservation<br />
goals. F<strong>in</strong>ally, cont<strong>in</strong>ue to build capacity <strong>of</strong> both<br />
local government-supported MPAs and national agencymanaged<br />
MPAs to improve overall management effectiveness<br />
and governance <strong>of</strong> <strong>in</strong>dividual sites.<br />
Acknowledgments<br />
We thank staff at Coastal Conservation and Education<br />
Foundation and <strong>the</strong> Silliman University Angelo K<strong>in</strong>g Center<br />
<strong>for</strong> Research and Environmental Management <strong>for</strong> assistance<br />
<strong>in</strong> compil<strong>in</strong>g <strong>the</strong> MPA database and support <strong>the</strong>ir<br />
ongo<strong>in</strong>g ef<strong>for</strong>ts to establish MPAs <strong>in</strong> <strong>the</strong> Philipp<strong>in</strong>es.<br />
We are grateful to two anonymous reviewers <strong>for</strong> provid<strong>in</strong>g<br />
helpful comments on an earlier version <strong>of</strong> this<br />
manuscript. R.W. is supported by a Northcote Graduate<br />
Scholarship.<br />
Literature Cited<br />
Abesamis, R. A., A. C. Alcala, and G. R. Russ. 2006. How much does <strong>the</strong><br />
fishery at Apo Island benefit from spillover <strong>of</strong> adult fish from <strong>the</strong><br />
adjacent mar<strong>in</strong>e reserve? Fishery Bullet<strong>in</strong> 104:360–375.<br />
Agardy, T. P. et al. 2003. Dangerous targets? Unresolved issues<br />
and ideological clashes around mar<strong>in</strong>e protected areas. Aquatic<br />
Conservation-<strong>Mar<strong>in</strong>e</strong> and Freshwater Ecosystems 13:353–367.<br />
Airame, S., J. E. Dugan, K. D. Lafferty, H. Leslie, D. A. McArdle, and<br />
R. R. Warner. 2003. Apply<strong>in</strong>g ecological criteria to mar<strong>in</strong>e reserve<br />
design: a case study from <strong>the</strong> Cali<strong>for</strong>nia Channel Islands. Ecological<br />
Applications 13:S170–S184.<br />
Alcala, A. C., and G. R. Russ. 2006. No-take mar<strong>in</strong>e reserves and reef<br />
fisheries management <strong>in</strong> <strong>the</strong> Philipp<strong>in</strong>es: a new people power revolution.<br />
Ambio 35:245–254.<br />
Alcala, A. C., G. R. Russ, A. P. Maypa, and H. P. Calumpong. 2005.<br />
A long-term, spatially replicated experimental test <strong>of</strong> <strong>the</strong> effect <strong>of</strong><br />
mar<strong>in</strong>e reserves on local fish yields. Canadian Journal <strong>of</strong> Fisheries<br />
and Aquatic Sciences 62:98–108.<br />
Almany, G. R., M. L. Berumen, S. R. Thorrold, S. Planes, and G. P. Jones.<br />
2007. Local replenishment <strong>of</strong> coral reef fish populations <strong>in</strong> a mar<strong>in</strong>e<br />
reserve. Science 316:742–744.<br />
Areco, H. O., W. L. Campos, F. Fuentes, and P. M. Al<strong>in</strong>o. 2004. Proceed<strong>in</strong>gs<br />
<strong>of</strong> <strong>the</strong> workshops towards <strong>the</strong> <strong>for</strong>mulation <strong>of</strong> <strong>the</strong> Philipp<strong>in</strong>e<br />
<strong>Mar<strong>in</strong>e</strong> Sanctuary Strategy. University <strong>of</strong> <strong>the</strong> Philipp<strong>in</strong>es <strong>Mar<strong>in</strong>e</strong><br />
Science Institute, Diliman, Quezon City. Also available from http://<br />
www.elib.gov.ph/details.php?uid=8f92581a9ecad86851e6cf42ba<br />
31b102.<br />
Beyer, H. L. 2004. Hawth’s analysis tools <strong>for</strong> ArcGIS. SpatialEcology.com.<br />
Available from http://www.spatialecology.com/htools<br />
(accessed September 2008).<br />
Burke, L., E. Selig, and M. Spald<strong>in</strong>g. 2002. Reefs at risk <strong>in</strong> Sou<strong>the</strong>ast Asia.<br />
World Resources Institute, Wash<strong>in</strong>gton, D.C.<br />
Carpenter, K. E. 2005. The center <strong>of</strong> <strong>the</strong> center <strong>of</strong> mar<strong>in</strong>e shore fish<br />
biodiversity: <strong>the</strong> Philipp<strong>in</strong>e Islands. Environmental Biology <strong>of</strong> Fishes<br />
72:467–480.<br />
Conservation Biology<br />
Volume **, No. *, 2009
10 <strong>Effectiveness</strong> <strong>of</strong> <strong>Mar<strong>in</strong>e</strong> <strong>Protected</strong> <strong>Areas</strong><br />
Chape, S., J. Harrison, M. Spald<strong>in</strong>g, and I. Lysenko. 2005. Measur<strong>in</strong>g<br />
<strong>the</strong> extent and effectiveness <strong>of</strong> protected areas as an <strong>in</strong>dicator <strong>for</strong><br />
meet<strong>in</strong>g global biodiversity targets. Philosophical Transactions <strong>of</strong><br />
<strong>the</strong> Royal Society B-Biological Sciences 360:443–455.<br />
Christie, P., A. White, and E. Deguit. 2002. Start<strong>in</strong>g po<strong>in</strong>t or solution?<br />
Community-based mar<strong>in</strong>e protected areas <strong>in</strong> <strong>the</strong> Philipp<strong>in</strong>es. Journal<br />
<strong>of</strong> Environmental Management 66:441–454.<br />
Christie, P., and A. T. White. 2007. Best practices <strong>for</strong> improved<br />
governance <strong>of</strong> coral reef mar<strong>in</strong>e protected areas. Coral Reefs<br />
26:1047–1056.<br />
Coral Triangle Initiative. 2008. Regional plan <strong>of</strong> action (“Manila draft”).<br />
Coral Triangle Initiative, Manila.<br />
Day, J., et al. 2002. The representative areas program <strong>for</strong> protect<strong>in</strong>g biodiversity<br />
<strong>in</strong> <strong>the</strong> Great Barrier Reef World Heritage Area. International<br />
Coral Reef Symposium 9:687–696.<br />
DENR (Department <strong>of</strong> Environment and Natural Resources). 2001. Adm<strong>in</strong>istrative<br />
order 17: guidel<strong>in</strong>es <strong>for</strong> del<strong>in</strong>eat<strong>in</strong>g/delimit<strong>in</strong>g municipal<br />
waters. DENR, Manila.<br />
Guarderas, P. A., S. D. Hacker, and J. Lubchenco. 2008. Current Status<br />
<strong>of</strong> <strong>Mar<strong>in</strong>e</strong> <strong>Protected</strong> <strong>Areas</strong> <strong>in</strong> Lat<strong>in</strong> America and <strong>the</strong> Caribbean.<br />
Conservation Biology 22:1630–1640.<br />
Halpern, B. S., and R. R. Warner. 2003. Match<strong>in</strong>g mar<strong>in</strong>e reserve design<br />
to reserve objectives. Proceed<strong>in</strong>gs <strong>of</strong> <strong>the</strong> Royal Society <strong>of</strong> London<br />
Series B-Biological Sciences 270:1871–1878.<br />
Jameson, S. C. 2002. The three screen doors: can mar<strong>in</strong>e “protected”<br />
areas be effective? <strong>Mar<strong>in</strong>e</strong> Pollution Bullet<strong>in</strong> 44:1177–1183.<br />
Jenn<strong>in</strong>gs, M. D. 2000. Gap analysis: concepts, methods, and recent<br />
results. Landscape Ecology 15:5–20.<br />
Jones, G. P., et al. 2008. Connectivity and <strong>the</strong> design <strong>of</strong> mar<strong>in</strong>e protected<br />
area networks <strong>in</strong> <strong>the</strong> coral triangle. Coral Triangle Initiative,<br />
Townsville, Queensland.<br />
Kelleher, G., C. Bleakey, and S. Wells, editors. 1995. A global representative<br />
system <strong>of</strong> mar<strong>in</strong>e protected areas. The World Bank, Wash<strong>in</strong>gton,<br />
D.C.<br />
Lourie, S. A., and A. C. J. V<strong>in</strong>cent. 2004. Us<strong>in</strong>g biogeography to<br />
help set priorities <strong>in</strong> mar<strong>in</strong>e conservation. Conservation Biology<br />
18:1004–1020.<br />
Margules, C. R., and R. L. Pressey. 2000. Systematic conservation plann<strong>in</strong>g.<br />
Nature 405:243–253.<br />
McClanahan, T. R. 1999. Is <strong>the</strong>re a future <strong>for</strong> coral reef parks <strong>in</strong> poor<br />
tropical countries? Coral Reefs 18:321–325.<br />
Mora, C., S. Andrefouet, M. J. Costello, C. Kranenburg, A. Rollo, J.<br />
Veron, K. J. Gaston, and R. A. Myers. 2006. Coral reefs and <strong>the</strong><br />
global network <strong>of</strong> mar<strong>in</strong>e protected areas. Science 312:1750–1751.<br />
Ong, P. S., L. E. Afuang, and R. G. Rosell-Ambal, editors. 2002. Philipp<strong>in</strong>e<br />
biodiversity conservation priorities: a second iteration <strong>of</strong> <strong>the</strong><br />
National Biodiversity Strategy and Action Plan. Department <strong>of</strong> Environment<br />
and Natural Resources <strong>Protected</strong> <strong>Areas</strong> and Wildlife Bureau,<br />
Conservation International Philipp<strong>in</strong>es, Biodiversity Conservation<br />
Program University <strong>of</strong> <strong>the</strong> Philipp<strong>in</strong>es Center <strong>for</strong> Integrative<br />
and Development Studies, and Foundation <strong>for</strong> <strong>the</strong> Philipp<strong>in</strong>e Environment,<br />
Quezon City, Philipp<strong>in</strong>es.<br />
Planes, S., G. P. Jones, and S. R. Thorrold. 2009. Larval dispersal connects<br />
fish populations <strong>in</strong> a network <strong>of</strong> mar<strong>in</strong>e protected areas. Proceed<strong>in</strong>gs<br />
<strong>of</strong> <strong>the</strong> National Academy <strong>of</strong> Sciences <strong>of</strong> <strong>the</strong> United States<br />
<strong>of</strong> America 106:5693–5697.<br />
Pollnac, R. B., B. R. Craw<strong>for</strong>d, and M. L. G. Gorospe. 2001. Discover<strong>in</strong>g<br />
factors that <strong>in</strong>fluence <strong>the</strong> success <strong>of</strong> community-based mar<strong>in</strong>e<br />
protected areas <strong>in</strong> <strong>the</strong> Visayas, Philipp<strong>in</strong>es. Ocean & Coastal Management<br />
44:683–710.<br />
Roberts, C. M., B. S. Halpern, R. R. Warner, and S. R. Palumbi. 2002a.<br />
Design<strong>in</strong>g mar<strong>in</strong>e reserve networks: why small, isolated protected<br />
areas are not enough. Conservation Biology <strong>in</strong> Practice 2:9–17.<br />
Roberts, C. M., et al. 2002b. <strong>Mar<strong>in</strong>e</strong> biodiversity hotspots and conservation<br />
priorities <strong>for</strong> tropical reefs. Science 295:1280–1284.<br />
Roberts, C. M., et al. 2003. Ecological criteria <strong>for</strong> evaluat<strong>in</strong>g candidate<br />
sites <strong>for</strong> mar<strong>in</strong>e reserves. Ecological Applications 13:S199–S214.<br />
Rodrigues, A. S. L., et al. 2004. <strong>Effectiveness</strong> <strong>of</strong> <strong>the</strong> global protected area<br />
network <strong>in</strong> represent<strong>in</strong>g species diversity. Nature 428:640–643.<br />
Russ, G. R., A. C. Alcala, A. P. Maypa, H. P. Calumpong, and A. White.<br />
2004. <strong>Mar<strong>in</strong>e</strong> reserve benefits local fisheries. Ecological Applications<br />
14:597–606.<br />
Sale, P. F., et al. 2005. Critical science gaps impede use <strong>of</strong> no-take fishery<br />
reserves. Trends <strong>in</strong> Ecology & Evolution 20:74–80.<br />
Samoilys,M.A.,K.M.Mart<strong>in</strong>-Smith,B.G.Giles,B.Cabrera,J.A.Anticamara,<br />
E. O. Brunio, and A. C. J. V<strong>in</strong>cent. 2007. <strong>Effectiveness</strong> <strong>of</strong> five<br />
small Philipp<strong>in</strong>es’ coral reef reserves <strong>for</strong> fish populations depends<br />
on site-specific factors, particularly en<strong>for</strong>cement history. Biological<br />
Conservation 136:584–601.<br />
Shanks, A. L. 2003. Propagule dispersal distance and <strong>the</strong> size and spac<strong>in</strong>g<br />
<strong>of</strong> mar<strong>in</strong>e reserves. Ecological Applications 13:S159–S169.<br />
Spald<strong>in</strong>g, M., C. Ravilious, and E. P. Green 2001. World atlas <strong>of</strong> coral<br />
reefs. University <strong>of</strong> Cali<strong>for</strong>nia Press, Berkeley.<br />
Tongson, E., and M. Dygico. 2004. User fee system <strong>for</strong> mar<strong>in</strong>e ecotourism:<br />
<strong>the</strong> Tubbataha Reef experience. Coastal Management<br />
32:17–23.<br />
UNEP WCMC (United Nations Environment Programme World Conservation<br />
Monitor<strong>in</strong>g Centre). 2007. World database on protected<br />
areas. UNEP WCMC, Cambridge, United K<strong>in</strong>gdom.<br />
White, A., E. Deguit, and W. Jatulan. 2006a. Integrated Coastal Management<br />
<strong>in</strong> Philipp<strong>in</strong>e local governance: evolution and benefits. Coastal<br />
Management 34:287–302.<br />
White, A., A. B. T. Meneses, M. Ovenden, and S. Tesch. 2006b. Susta<strong>in</strong><strong>in</strong>g<br />
mar<strong>in</strong>e protected areas through cont<strong>in</strong>ued monitor<strong>in</strong>g and<br />
evaluation: <strong>the</strong> MPA report guide and management rat<strong>in</strong>g system.<br />
International Coral Reef Symposium 10:1466–1470.<br />
White, A. T., C. A. Courtney, and A. Salamanca. 2002. Experience with<br />
mar<strong>in</strong>e protected area plann<strong>in</strong>g and management <strong>in</strong> <strong>the</strong> Philipp<strong>in</strong>es.<br />
Coastal Management 30:1–26.<br />
White, A. T., and V. P. Palaganas. 1991. Phillip<strong>in</strong>e Tubbataha Reef national<br />
mar<strong>in</strong>e park: status, management issues and proposed plan.<br />
Environmental Conservation 18:148–157.<br />
White, A. T., H. P. Vogt, and T. Ar<strong>in</strong>. 2000. Philipp<strong>in</strong>e coral reefs under<br />
threat: The economic losses caused by reef destruction. <strong>Mar<strong>in</strong>e</strong><br />
Pollution Bullet<strong>in</strong> 40:598–605.<br />
Wood, L. J. 2007. MPA global: a database <strong>of</strong> <strong>the</strong> world’s mar<strong>in</strong>e protected<br />
areas. Sea Around Us Project, United Nations Environment Programme<br />
World Conservation Monitor<strong>in</strong>g Centre & World Wildlife<br />
Fund, Vancouver, B.C.<br />
Wood, L. J., L. Fish, J. Laughren, and D. Pauly. 2008. Assess<strong>in</strong>g progress<br />
towards global mar<strong>in</strong>e protection targets: shortfalls <strong>in</strong> <strong>in</strong><strong>for</strong>mation<br />
and action. Oryx 42:340–351.<br />
Conservation Biology<br />
Volume **, No. *, 2009