The Parkersburg, IA EF-5 Tornado - Atmospheric and Oceanic ...
The Parkersburg, IA EF-5 Tornado - Atmospheric and Oceanic ...
The Parkersburg, IA EF-5 Tornado - Atmospheric and Oceanic ...

Create successful ePaper yourself
Turn your PDF publications into a flip-book with our unique Google optimized e-Paper software.
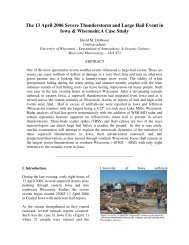
<strong>The</strong> <strong>Parkersburg</strong>, <strong>IA</strong> <strong>EF</strong>-5 <strong>Tornado</strong>: Destruction Amidst the Rain<br />
Sarah A. Monette<br />
University of Wisconsin - Madison Department of <strong>Atmospheric</strong> <strong>and</strong> <strong>Oceanic</strong> Science<br />
1225 W. Dayton Street, Madison, WI 53706, USA<br />
AOS 453 Final Case Study<br />
Abstract<br />
On May 25, 2008, at 5:00PM local time, the city of <strong>Parkersburg</strong>, <strong>IA</strong>, experienced a tornado<br />
which produced peak wind gusts of 92 meters per second, or 205 miles per hour, based on<br />
damage assessment of homes <strong>and</strong> other buildings. (Marshall et al., 2008) <strong>The</strong>refore, this<br />
tornado was classified as an <strong>EF</strong>-5, the first one to record a 5 on the Fujita, or Enhanced<br />
Fujita, Scale in Iowa since 1976. Unfortunately, 8 people lost their lives in what is now<br />
known as the <strong>Parkersburg</strong> <strong>Tornado</strong>. <strong>The</strong> focus of this case study is to investigate the synoptic<br />
<strong>and</strong> mesoscale parameters which combined to produced a supercell capable of generating the<br />
<strong>EF</strong>-5 <strong>Parkersburg</strong> tornado. Aided by synoptic scale lifting mechanisms including upper level<br />
divergence, at both 300 mb <strong>and</strong> 500 mb, <strong>and</strong> a surface warm front combined with moisture<br />
flux from the mesoscale low level jet, the environment in <strong>Parkersburg</strong> featured<br />
thermodynamic <strong>and</strong> wind shear instability favorable for the development of a significant<br />
tornado. This instability includes a conditionally unstable lapse rate, large ratio of CAPE to<br />
CIN, veering wind with height, as well as positive surface relative helicity. In addition to this<br />
instability, the intensity of the tornado was further enhanced by interactions with gravity<br />
waves just prior to tornadic development. This combination of mesoscale phenomenon<br />
allowed an <strong>EF</strong>-5 tornado to be produced from what storm chasers described as a heavy<br />
precipitating supercell, an event rarely seen, which will be discussed with the assistance of a<br />
Miller diagram.<br />
Introduction<br />
May 25, 2008, will be a day most<br />
Iowans will potentially remember for the rest of<br />
their lives. In a state where 85% of the<br />
tornadoes recorded between 1980 <strong>and</strong> 2008<br />
were at the lower end of the Enhanced Fujita<br />
Scale (<strong>EF</strong>0, <strong>EF</strong>1), the tornado that touched<br />
down at 4:48 PM local time on this day would<br />
be one for the record books. Around 5:00 PM<br />
local time, 22Z, the tornado reached peak<br />
intensity around <strong>Parkersburg</strong>, <strong>IA</strong>, with<br />
estimated winds at 92, meters per second (m/s),<br />
205 miles per hour (mph), based on damage<br />
assessment, earning an <strong>EF</strong>-5 rating (above 200<br />
mph) on the Enhance Fujita Scale. This was<br />
the first tornado to record a 5 on the Fujita (or<br />
Enhanced Fujita) Scale since a F5 tornado<br />
struck Boone <strong>and</strong> Stony counties on June 13 th ,<br />
1976. However, unlike the F5 tornado in<br />
1976, the tornado that struck <strong>Parkersburg</strong> <strong>and</strong><br />
its surrounding communities killed 8 people,<br />
cutting a 43 mile long path from Aplington<br />
through <strong>Parkersburg</strong> to the<br />
Balckhawk/Buchanan county line.<br />
<strong>Parkersburg</strong> is located approximately 100<br />
miles west of Dubuque, <strong>IA</strong>, <strong>and</strong> 150 miles<br />
northwest of Davenport, <strong>IA</strong>. (Cogil, et al.,<br />
2008; <strong>Parkersburg</strong> - New Hartford -<br />
Dunkerton <strong>EF</strong>5 <strong>Tornado</strong> of May 25, 2008,<br />
2008; Service Assessment: <strong>EF</strong>5 <strong>Tornado</strong> in<br />
<strong>Parkersburg</strong> <strong>and</strong> New Hartford, Iowa, 2009)<br />
For a better visual, please see the surface<br />
analysis in Figure 1 for the exact location of<br />
<strong>Parkersburg</strong>, <strong>IA</strong>.<br />
1
Figure 1: Location of <strong>Parkersburg</strong> in Iowa.<br />
<strong>Tornado</strong>es are generally form through<br />
two different mechanisms. <strong>The</strong> first<br />
mechanism creates a shear line tornado, which<br />
will not be discussed in this paper. Almost all<br />
violent, like the one which struck <strong>Parkersburg</strong>,<br />
are produced by supercell storms. Supercell<br />
thunderstorms, conceptualized in Figure 10, are<br />
unique when compared to airmass<br />
thunderstorms. A supercell features a rotating<br />
mesocyclone. This rotating mesocyclone acts<br />
as a dynamic wall surrounding the updraft.<br />
<strong>The</strong>refore, entrainment of dry air, as well as<br />
precipitation loading, the two processes which<br />
suppress the updraft, are reduced. Precipitation<br />
loading is defined as droplets accumulating<br />
mass,weighing down the updraft <strong>and</strong> reducing<br />
upward vertical acceleration. Without these<br />
two processes interfering with the updraft, the<br />
supercell is able to persist for hours as long as<br />
the right environment is available. Supercells<br />
can be grouped into three different types: low<br />
precipitating, classic, <strong>and</strong> heavy precipitating.<br />
According to Miller (2006), the classic<br />
supercell is responsible for producing most of<br />
the violent tornadoes. However, according to<br />
storm chaser reports, <strong>and</strong> the radar image in<br />
Figure 11, the tornado which struck<br />
<strong>Parkersburg</strong>, <strong>IA</strong>, was rain-wrapped, indicating<br />
formation from a heavy precipitating supercell.<br />
It is hypothesized that the supercell<br />
which spawned the tornado that struck<br />
<strong>Parkersburg</strong> was initially initiated by synoptic<br />
scale forcings, such as ascending vertical<br />
motions in the form of upper level divergence<br />
<strong>and</strong> surface fronts, combined with a mesoscale<br />
environment ideal for the production of a<br />
strong <strong>and</strong> violent tornado. In addition, since<br />
the supercell was heavy precipitating, external<br />
forces, such as gravity waves, also enhanced<br />
the tornado. <strong>The</strong>refore, this case study will<br />
first investigate the synoptic environment<br />
around the time of the tornado, 22Z. Next, the<br />
mesoscale environment, including the role of<br />
a low level jet for moisture flux as well as<br />
severe index parameters such as instability<br />
<strong>and</strong> helicity derived from the 22Z sounding at<br />
<strong>Parkersburg</strong>, will be analyzed to underst<strong>and</strong><br />
how the advantageously the environment in<br />
<strong>Parkersburg</strong> was for the produced of a violent<br />
tornado. In addition, gravity waves will be<br />
investigated as further mechanisms for<br />
producing an <strong>EF</strong>5 tornado from a heavy<br />
precipitating supercell. <strong>The</strong> characteristics of<br />
a heavy precipitating supercell, <strong>and</strong> the<br />
mechanisms which allow them to produce<br />
violent tornadoes, will be examined. Finally,<br />
a Miller Diagram of the synoptic features at<br />
22Z will be analyzed to describe the favorable<br />
synoptic environment for heavy precipitating<br />
supercells.<br />
II. Data<br />
Date used for this case study was<br />
obtained from the ETA mathematical<br />
coordinate system model run at initialized at<br />
12Z on 25 May 2008. Figures were then<br />
generated utilizing the General Meteorology<br />
Package (GEMPAK). Radar data from the<br />
NEXRCOMP, the National Weather Service<br />
NEXRAD Composition of the United States<br />
at 1 kilometer (km) resolution, was used to<br />
generate radar images using the Global<br />
Atmosphere Research Program (GARP) for<br />
analysis. In addition, figures were obtained<br />
from various scientific sources. Synoptic<br />
figures were obtained from Service<br />
Assessment: <strong>EF</strong>5 <strong>Tornado</strong> in <strong>Parkersburg</strong> <strong>and</strong><br />
New Hartford, Iowa (2009), which utilized<br />
mesoscale graphics valid at 22Z from the<br />
Storm Prediction Center (SPC), as well as the<br />
Local Analysis <strong>and</strong> Prediction System to<br />
created a sounding for valid at 22Z. Also, the<br />
Rapid Update Cycle (RUC) model was used<br />
to produce a hodograph <strong>and</strong> sounding for Fort<br />
2
Dodge. Other mesoscale analysis graphics<br />
were obtained from Marshall et al (2008).<br />
III. Synoptic Analysis<br />
22Z 25 May 2008<br />
In images obtained through the SPC<br />
mesoscale analysis <strong>and</strong> made available by the<br />
Service Assessment: <strong>EF</strong>5 <strong>Tornado</strong> in<br />
<strong>Parkersburg</strong> <strong>and</strong> New Hartford, Iowa (2009),<br />
by 22Z on 25 May 2008, when the tornado is<br />
reportedly on the ground in <strong>Parkersburg</strong>, a<br />
region of upper level divergence is observed at<br />
300 mb over Iowa, observed in Figure 2a.<br />
Collocated with the region of divergence is a<br />
jet streak extending northwest with a local<br />
maximum of 100 knot winds over South<br />
Dakota. According to the Service Assessment:<br />
<strong>EF</strong>5 <strong>Tornado</strong> in <strong>Parkersburg</strong> <strong>and</strong> New Hartford,<br />
Iowa (2009), this region of upper level<br />
divergence is due to the its location in the rightrear<br />
quadrant of the jet streak. However, this<br />
appears counterintuitive, since the right-rear<br />
quadrant of a jet streak is a region of upper<br />
level convergence, as indicated by crossing the<br />
k-direction with the acceleration of the wind.<br />
Previously, at 12Z, a jet maximum of<br />
100 knots was located in central Minnesota,<br />
with a 90 knot streak extending from South<br />
Dakota to Minnesota. Unfortunately, based on<br />
the nature of the figure from the Service<br />
Assessment: <strong>EF</strong>5 <strong>Tornado</strong> in <strong>Parkersburg</strong> <strong>and</strong><br />
New Hartford, Iowa (2009), it is unclear<br />
whether the jet streak present at 22Z is the<br />
same jet streak present at 12Z, or if a new jet<br />
streak has formed as the one present at 12Z<br />
propagated northeastward. In addition, it is<br />
possible that, by re-orientation the jet, the rightrear<br />
of the jet is actually the left-entrance<br />
region of the jet, which experiences upper level<br />
divergence. This region could also experience<br />
divergence through other mechanisms, such as<br />
curvature, <strong>and</strong> the jet streak is merely in the<br />
vicinity of the upper level divergence. Ten<br />
hours earlier, a broad trough was be observed<br />
encompassing the western United States,<br />
extending from the California/Mexico border<br />
through Minnesota, with a corresponding<br />
ridge peaking over Wisconsin. Due to this<br />
change in curvature, a region of upper level<br />
divergence would be observed, due to the<br />
subgeostrophic nature of the winds through<br />
the base of a trough <strong>and</strong> supergeostrophic<br />
winds through the peak of a ridge.<br />
<strong>The</strong>refore, if this trough propagated in the ten<br />
hour, Iowa could be located in the region of<br />
upper level divergence due to curvature.<br />
Whatever the mechanism, it is apparent there<br />
is upper level divergence at 300 mb.<br />
Another reason for this divergence is<br />
found at 500 mb, Figure 2b. Located over<br />
Iowa are embedded shortwave troughs, as<br />
determined in the black height contours.<br />
<strong>The</strong>se shortwave troughs, with their local<br />
maximum in vorticity, would create positive<br />
vorticity advection (PVA) into the <strong>Parkersburg</strong><br />
region in the westerly flow. This PVA also<br />
promotes rising motion through upper level<br />
divergence, <strong>and</strong> could also be responsible for<br />
the divergence observed at 300 mb. This<br />
upper level divergence acts as the dynamical<br />
forcing needed to induce rising motion. By<br />
the law of conservation of mass, this upper<br />
level divergence would induce ascending<br />
vertical motion from the surface to replace the<br />
evacuated mass.<br />
At 850 mb, moisture can be observed<br />
over northwest Iowa, indicated by the high<br />
dew point temperatures observed in Figure 2c.<br />
<strong>The</strong>se dew point temperatures are<br />
approximately 15 °C in the <strong>Parkersburg</strong><br />
region. In comparison, according to Figure 4,<br />
the observed temperature of approximately 16<br />
°C at 850 mb, indicating an atmosphere close<br />
to saturation. <strong>The</strong>se dew point temperatures<br />
are also indicative of strong moisture<br />
transport, resulting from the south-southwest<br />
winds at this level. This wind direction could<br />
be the result of the surface pressure systems.<br />
During the early morning of 25 May 2008, at<br />
12Z, the surface low pressure, now located in<br />
Minnesota as seen in Figure 2d, was located in<br />
North Dakota.. In addition, there was a region<br />
of high pressure over the eastern United<br />
3
States. <strong>The</strong>refore, the conjunction of the<br />
cyclonic winds around the surface low pressure<br />
<strong>and</strong> anti-cyclonic winds around the surface<br />
high pressure would produce southsouthwesterly<br />
winds in the <strong>Parkersburg</strong> area.<br />
<strong>The</strong>se winds fluxed the observed moisture in<br />
the region, <strong>and</strong> will be further discussed in the<br />
mesoscale analysis of the low level jet.<br />
This moisture flux is of importance in<br />
the context of lifted air parcels. As an air<br />
parcel is lifted, it cools at the dry adiabatic<br />
lapse rate until saturation is achieved. <strong>The</strong>n the<br />
parcel cools at the moist adiabatic lapse rate,<br />
which is less steep (6.5 °C/km) than the dry<br />
adiabatic lapse rate (9.8 °C/km). <strong>The</strong> air parcel<br />
accelerate upward if the environmental lapse<br />
rate is steeper than 6.5 °C/km. However, an air<br />
parcel needs the dynamical forcing to induce<br />
rising motion. In addition to the forcings for<br />
upward motion at 300 mb <strong>and</strong> 500 mb, Figure<br />
2d indicates the presence of a surface warm<br />
front. Approaching warm air, depicted by the<br />
warm front, would be forced to rise over the<br />
colder <strong>and</strong> more dense air. <strong>The</strong> coincidence of<br />
this warm from with the tornado can bee see<br />
in Figure 10c. <strong>The</strong>refore, the synoptic<br />
environment, with is dynamical forcings for<br />
ascent throughout the atmosphere, would<br />
enable parcels to reach saturation closer to the<br />
surface due to the moisture, <strong>and</strong> then rise at a<br />
less steep moist adiabatic lapse rate, also seen<br />
in the Figure 4 sounding. This ascending<br />
vertical motion, with enough energy, could<br />
produce a cloud, <strong>and</strong> the supercell which<br />
produced <strong>Parkersburg</strong>, <strong>IA</strong>, tornado is labeled<br />
with “P” in the surface analysis of Figure 2d.<br />
Figure 2: 22Z 25 May 2008 analysis of a) 300 mb isotachs (blue) <strong>and</strong> divergence (purple), b) 500 mb heights<br />
(black), temperatures (red) <strong>and</strong> isotachs (blue), c) 850 mb height (black), temperature (red), <strong>and</strong> dew point<br />
temperature (green), <strong>and</strong> d) surface mean sea level pressure (peach), surface observations (green), visible satellite<br />
imagery, <strong>and</strong> surface analysis. <strong>The</strong> supercell that produced the tornado which struck <strong>Parkersburg</strong> is indicated by the<br />
cyan arrow. Image courtesy of Service Assessment: <strong>EF</strong>5 <strong>Tornado</strong> in <strong>Parkersburg</strong> <strong>and</strong> New Hartford, Iowa, 2009<br />
4
IV. Mesoscale Analysis<br />
1) Low Level Jet<br />
Evident in Figure 3, which was<br />
generated utilizing zero hour forecast from the<br />
initialized 12Z ETA model analysis, is a local<br />
maximum in the magnitude of the winds at 925<br />
mb. This local maximum, which is also known<br />
as the low level jet (LLJ), extends from<br />
northward across the Central United States.<br />
Unlike the above synoptic overview, the LLJ is<br />
analyzed at 12Z. This is because the LLJ is<br />
more prominent at night than during the day,<br />
due to the height of the nocturnal boundary<br />
layer being closer to the surface than during the<br />
day. This therefore decouples the ageostropic<br />
inertial oscillation from surface friction <strong>and</strong><br />
allows it to enhance low level winds. (<strong>The</strong>rmal<br />
Upslope, 2009)<br />
Figure 3: 12Z May 25 2008 ETA analysis of the<br />
magnitude of the winds at 925 mb. Note the region of<br />
wind speeds greater than 30 knots extending from Texas<br />
to Iowa, responsible for moisture flux <strong>and</strong> directional<br />
wind shear.<br />
On this day, the low level jet features a<br />
region of observed winds greater in magnitude<br />
than 30 knots extending from the Texas-<br />
Mexico to western Iowa, with a maximum<br />
wind speed of 50 knots over the Oklahoma-<br />
Texas panh<strong>and</strong>le. It is this southerly flow<br />
which is responsible for fluxing moist Gulf air<br />
into the Iowa region <strong>and</strong> producing the dew<br />
point temperatures of approximately 15 °C<br />
when the actual temperature was only 16 °C,<br />
observed at the time of the tornado in the<br />
synoptic environment at 850 mb. As<br />
previously discussed, this moisture enhances<br />
vertical accelerations in the atmosphere. In<br />
addition to enhancing upward motion, the<br />
presence of the LLJ <strong>and</strong> its southwesterly<br />
winds into Iowa help produce directionally<br />
vertical wind shear, an ingredient for<br />
producing tornadoes.<br />
2) Severe Index Parameters<br />
Lapse Rate<br />
Courtesy of Service Assessment: <strong>EF</strong>5<br />
<strong>Tornado</strong> in <strong>Parkersburg</strong> <strong>and</strong> New Hartford,<br />
Iowa (2009), Figure 4 is a sounding valid for<br />
<strong>Parkersburg</strong>, <strong>IA</strong> at 22Z on 25 May 2008, the<br />
time the tornado was on the ground in<br />
<strong>Parkersburg</strong>. It was generated by the Local<br />
Analysis <strong>and</strong> Prediction System, which<br />
integrates real time meteorological<br />
observations A number of features are<br />
prominent on this sounding, which act to<br />
create a favorable environment for supercell<br />
<strong>and</strong> tornado development. As observed, the<br />
surface dew point temperature in <strong>Parkersburg</strong><br />
is approximately 21°C, or 70 °F. Dew point<br />
temperatures of 70 °F or greater in the rear<br />
flank of the storm lead to relatively buoyant<br />
rear flanking downdrafts, which the Service<br />
Assessment: <strong>EF</strong>5 <strong>Tornado</strong> in <strong>Parkersburg</strong> <strong>and</strong><br />
New Hartford, Iowa (2009) indicates has been<br />
shown to enhance the stretching of low-level<br />
vorticity <strong>and</strong> contribute to tornadogenesis<br />
Another features characteristic of<br />
tornado development is the lapse rate. <strong>The</strong><br />
environmental lapse rate over <strong>Parkersburg</strong> is<br />
approximately 7.5 °C/km. However, a<br />
saturated air parcel cools 6.5 °C/km during<br />
ascent. Given the synoptic environment<br />
previously described, at the time of this<br />
sounding, an air parcel in the <strong>Parkersburg</strong><br />
area, which would reach saturation close to<br />
the surface due to the high dew point<br />
5
temperatures, would cool less quickly than its<br />
surroundings. <strong>The</strong>refore, the warmer parcel<br />
would continue to to rise, since warm air rises.<br />
A moderate to steep lapse, like the one<br />
observed in Figure 4, one of the environmental<br />
factors Miller (2006) cites as favorable<br />
significant tornado development. Other<br />
environmental factors Miller (2006) suggests<br />
are favorable for significant tornado<br />
development, such as decreasing mixing<br />
rations in the lowest 1 km above ground level<br />
<strong>and</strong> a surface mixing ration of at least 15 g/kg,<br />
are also met by the <strong>Parkersburg</strong> sounding.<br />
Figure 4: 22Z sounding for 25 May 2008 at <strong>Parkersburg</strong>, <strong>IA</strong> generated by the Local Analysis <strong>and</strong> Prediction System.<br />
Image courtesy of Service Assessment: <strong>EF</strong>5 <strong>Tornado</strong> in <strong>Parkersburg</strong> <strong>and</strong> New Hartford, Iowa, 2009<br />
Instability<br />
As evident by the dashed line in the<br />
above sounding, representing an adiabatically<br />
lifted air parcel from the surface, there is a<br />
substantial amount of instability in the<br />
<strong>Parkersburg</strong> region at the time of this sounding.<br />
Severe indices are helpful in quantifying the<br />
tornado threat resulting from this instability.<br />
<strong>The</strong> lifted index, which calculates a parcel<br />
rising adiabatically from the surface to 500<br />
mb, is -7. This value indicates that severe<br />
thunderstorms are probable <strong>and</strong> tornadoes are<br />
possible. Additionally, the Severe Weather<br />
Index, which accounts for both directional <strong>and</strong><br />
speed wind shear between 850 mb <strong>and</strong> 500<br />
mb as well as temperature <strong>and</strong> moisture, also<br />
6
indicates the possibility of severe thunderstorms<br />
<strong>and</strong> potential tornadoes. In fact, of all the severe<br />
weather calculated for this sounding, including<br />
Total's Total <strong>and</strong> the K Index, only the Cross's<br />
Total, which measures the buoyancy of an air<br />
parcel but accounts for a moisture at 850 mb<br />
because moist air is less dense than dry air, was<br />
not above the highest threshold value for the<br />
<strong>Parkersburg</strong> sounding. This therefore indicates<br />
the strong potential for severe storms. Different<br />
indices account for difference factors in severe<br />
weather production: wind shear , moisture, <strong>and</strong><br />
temperature. Since every index calculated,<br />
except one, was maxed out, most of the<br />
necessary factors for tornado production are<br />
present in <strong>Parkersburg</strong>.<br />
Instability can also be measured through<br />
the convective available potential energy<br />
(CAPE) <strong>and</strong> convective inhibition (CIN). <strong>The</strong><br />
presence of CAPE acts to accelerate air parcels<br />
upward, <strong>and</strong> the updraft speed can be calculated<br />
by taking the derivative of the CAPE, the square<br />
root of 2*CAPE. CIN acts to inhibit ascending<br />
motion. <strong>The</strong>refore, by increasing the amount of<br />
CAPE, while decreasing the amount of CIN,<br />
convection would be intensified. <strong>The</strong> sounding<br />
in Figure 4 features a large amount of CAPE<br />
with little CIN.<br />
Figure 5: Mid-level CAPE (contoured in red) <strong>and</strong> Midlevel<br />
CIN (shaded) for 22Z 25 May 2008. Note the large<br />
value of CAPE with little value of CIN. Image courtesy of<br />
Service Assessment: <strong>EF</strong>5 <strong>Tornado</strong> in <strong>Parkersburg</strong> <strong>and</strong> New<br />
Hartford, Iowa, 2009.<br />
As indicated in Figure 5, the mid-level<br />
CAPE values in the <strong>Parkersburg</strong> region at the<br />
time of the tornado increased to<br />
approximately 3000 J/kg. (Service<br />
Assessment: <strong>EF</strong>5 <strong>Tornado</strong> in <strong>Parkersburg</strong> <strong>and</strong><br />
New Hartford, Iowa, 2009) In addition, at<br />
20Z, 100 mb mixed level CAPE was<br />
approximately 2300 J/kg (Marshall et al,<br />
2008). Combined with less than 25 J/kg of<br />
CIN, the height of the Level of Free<br />
Convection (LFC) was less than 1500 meters.<br />
In combination, these value are “well within<br />
the range of concern for strong <strong>and</strong> violent<br />
tornadoes, according to the research of<br />
Rasmussen (2003), Edwards et al. (2003),<br />
Davies (2002) <strong>and</strong> others,” (Marshall et al.,<br />
2008). In addition to the observed CAPE <strong>and</strong><br />
CIN, the Bulk Shear associated with this<br />
sounding in the 0-6 km layer was 55 knots,<br />
<strong>and</strong> the 0-1 km shear was 27 knots. <strong>The</strong>se<br />
factors would all act to enhance the potential<br />
for a significant tornado like the one<br />
experienced in <strong>Parkersburg</strong> at this time.<br />
(Marshall et al., 2008).<br />
Veering Winds with Height<br />
In addition to the instability seen on<br />
the sounding in Figure 4, wind shear values<br />
were also “ well within the range of concern<br />
for strong <strong>and</strong> violent tornadoes.” This shear<br />
in the wind, either with height or with time, is<br />
known as helicity. Winds at the surface of<br />
<strong>Parkersburg</strong> were reportedly from the south at<br />
approximately 5 knots at the time of the<br />
tornado. However, as height increases, the<br />
winds then proceed to veer, becoming southsouthwesterly<br />
around 850 mb, as previously<br />
observed in the synoptic scale at 22Z, <strong>and</strong><br />
then were westerly by the middle atmosphere,<br />
as seen at 500 mb synoptic set-up at 22Z.<br />
This veering of wind with height is captured<br />
in Figure 6, a forecast hodograph created by<br />
the RUC model, valid at the time of the<br />
tornado for Waterloo, <strong>IA</strong>, 23 miles east of<br />
<strong>Parkersburg</strong>. This hodograph, obtained from<br />
Service Assessment: <strong>EF</strong>5 <strong>Tornado</strong> in<br />
<strong>Parkersburg</strong> <strong>and</strong> New Hartford, Iowa (2009),<br />
is characterized by a distinct 90° angle,<br />
described as a “sickle” shape. According to<br />
7
Miller (2006), this sickle shape in the lowest<br />
500 meters above ground level (AGL), usually<br />
around 400 m AGL, is useful in diagnosing<br />
production of significant tornadoes. In the<br />
Waterloo hodograph, the kink is approximately<br />
400 m AGL. <strong>The</strong> nature of this hodograph<br />
provides “purely streamwise vorticity into the<br />
storm” (Service Assessment: <strong>EF</strong>5 <strong>Tornado</strong> in<br />
<strong>Parkersburg</strong> <strong>and</strong> New Hartford, Iowa, 2009),<br />
helping to enhance the right-moving supercell.<br />
Figure 6: 21Z RUC forecast hodograph valid at 22Z for<br />
Waterloo, <strong>IA</strong>, 23 miles east of <strong>Parkersburg</strong>. <strong>The</strong> “sickle”<br />
shape kink at 400 m AGL is utilized to diagnose<br />
significant tornadoes while the nature of this kink allows<br />
for streamwise vorticity into the storm <strong>and</strong> strengthen the<br />
right moving supercell. Image courtesy of Service<br />
Assessment: <strong>EF</strong>5 <strong>Tornado</strong> in <strong>Parkersburg</strong> <strong>and</strong> New<br />
Hartford, Iowa, 2009.<br />
<strong>The</strong> right-moving supercell is<br />
strengthened due to three dimensional wind<br />
shear in a supercell. For example, assume<br />
easterly winds at the surface <strong>and</strong> westerly winds<br />
aloft. <strong>The</strong> easterly winds are forced to rise into<br />
the updraft, <strong>and</strong> are now located in a region of<br />
westerly winds. <strong>The</strong>se juxtaposition of easterly<br />
winds amidst the westerly wind acts to generate<br />
two regions of vorticity, since easterly winds<br />
would be located in the center of the storm with<br />
westerly winds on the flanks. On the right of a<br />
retreating storm, positive vorticity would be<br />
observed due to cyclonic rotation, with<br />
anticyclonic rotation <strong>and</strong> negative vorticity on<br />
the left. Due to the rotation of these vorticity<br />
regions, dynamic low pressures would be<br />
created, as mass from the center of the rotation<br />
would be evacuated by the centrifugal force.<br />
<strong>The</strong>se rotating dynamic low pressures form<br />
the mesocyclones, which were previously<br />
described in the introduction as the feature<br />
which allows a supercell to remain long-lived.<br />
<strong>The</strong> presence of these dynamic low pressures<br />
forces the updraft to split, due to the pressure<br />
gradient force, which is also known as the<br />
Magnus effect, into the two distinct<br />
mesocyclones. In a veering wind profile,<br />
which is also defined as positively helical, the<br />
produced cyclonic updraft is able to be<br />
utilized by the cyclonic right cell for further<br />
development. <strong>The</strong> anti-cyclonic left cell is<br />
unable to intensity because the cyclonic<br />
updraft <strong>and</strong> anti-cyclonic mesocyclone oppose<br />
each other. <strong>The</strong>refore, the right moving<br />
supercell is enhanced while the left moving<br />
cell decreases in intensity. This enhancement<br />
of the right moving supercell in the<br />
<strong>Parkersburg</strong> tornado can be seen in the radar<br />
image of Figure 11. <strong>The</strong> right-moving<br />
supercell, with its tornado, is indicated by the<br />
box with the left-moving supercell indicated<br />
by the arrow.<br />
Helicity<br />
This second type of helicity is known<br />
as surface relative helicity (SRH). However,<br />
whereas a veering wind profile with height is<br />
beneficial for a right-moving supercell, it is a<br />
backing SRH profile with time that benefits<br />
the right-moving supercell. As the supercell<br />
moves to the right, it generates its own<br />
helicity, which must be positive to enhance<br />
the right moving supercell. For example, if a<br />
supercell is propagating with the mean wind,<br />
eastward in the United States, the helicity<br />
value for that supercell is zero. However,<br />
once that supercell turns to the right, it now<br />
feels a southerly wind. SRH can be calculated<br />
by taking the dot product of the vorticity with<br />
the velocity. Since the supercell now<br />
experiences southerly wind, the velocity<br />
values is positive. <strong>The</strong>refore, for SRH to be<br />
positive, the value of the vorticity must also<br />
be positive. Positive vorticity is associated<br />
8
cyclonic motion, or backing winds. At the time<br />
of the tornado in <strong>Parkersburg</strong>, the value of the 0-<br />
1 km SRH was 210 m 2 /s 2 , as seen in Figure 7,<br />
indicating the backing winds ahead of the<br />
approaching tornado, again within the range of<br />
significant tornado development.<br />
Figure 7: 0-1 km surface relative helicity valid at 22Z on<br />
25 May 2008. <strong>Parkersburg</strong> is labeled with a “P.” Note the<br />
values above 200 m 2 /s 2 in the <strong>Parkersburg</strong> area. Image<br />
courtesy of Marshall et al., 2008.<br />
3) Gravity Waves<br />
<strong>The</strong> first observation of a gravity wave<br />
intersecting a mesocyclone was on 14 November<br />
1949, resulting in the occurrence of a tornado in<br />
Florida. Twenty-five years later, analysis of the<br />
Super Outbreak from 3-4 April 1974 indicated<br />
that observed tornado production increased<br />
within some convective regions after being<br />
overtaken by gravity wave packets. This<br />
research posed the question of whether or not<br />
these gravity waves contained vorticity, which<br />
aided the development of the tornado. In more<br />
recent research, conducted by Coleman <strong>and</strong><br />
Krupp (2008), two violent tornadoes were<br />
examined to underst<strong>and</strong> the role of gravity<br />
waves interaction with a mesocyclone. On 16<br />
December 2000, after interaction with a gravity<br />
wave, a mesocyclone located in Tuscaloosa,<br />
Alabama, intensified, <strong>and</strong> the tornado which<br />
touched down two minutes later reached F4<br />
intensity. Two years earlier, on 8 April 1998 in<br />
Birmingham, Alabama, a supercell mesocyclone<br />
interacted with two parallel gravity waves to<br />
produce an F5 tornado, as well as strengthen a<br />
F0 tornado already on the ground to an F3.<br />
<strong>The</strong>se cases provides a basis for the hypothesis<br />
that gravity waves interacted with the<br />
<strong>Parkersburg</strong> tornado's mesocyclone, aiding in<br />
it's intensification.<br />
According to Coleman <strong>and</strong> Krupp<br />
(2008), gravity wave interaction with a<br />
mesocyclone can increase the vorticity in a<br />
mesocyclone. A numerical model indicated<br />
that at the end of full wavelength, the vorticity<br />
associated with the mesocyclone was higher<br />
than it was initially, by a factor of 2. Vertical<br />
vorticity can be enhanced through three<br />
different processes. However, for<br />
mesocyclone systems only two can be<br />
considered: stretching preexisting vorticity by<br />
horizontal convergence <strong>and</strong> tilting horizontal<br />
vorticity into the vertical.<br />
<strong>The</strong> first dynamical effect to be<br />
considered which acts to increase vorticity is<br />
convergence. For a plane gravity wave, the<br />
region of maximum convergence is 90° ahead<br />
of the wave ridge. This convergence cannot<br />
create vorticity where there is none, therefore<br />
relying on the stretching preexisting vorticity<br />
to enhance the mesocyclone. Yet,<br />
convergence can act to increase <strong>and</strong> easily<br />
double, at least temporarily, the vorticity<br />
associated with a mesocyclone.<br />
Wind shear may also act to increase<br />
the vorticity associated with a mesocyclone.<br />
While convergence relied on stretching<br />
already present vertical vorticity, the effects of<br />
wind shear on vorticity enhancement is to tilt<br />
horizontal vorticity vertically. Examination<br />
of gravity waves have revealed significant<br />
perturbation wind shear accompanying<br />
gravity waves. <strong>The</strong>se perturbations can<br />
significantly alter the environmental wind<br />
profile <strong>and</strong> storm relative helicity. For a wave<br />
intersecting a rotating storm from its right<br />
flank, which Coleman <strong>and</strong> Krupp (2008)<br />
indicates is the the typical examined situation,<br />
the wave trough region exhibits the<br />
perturbations which would typically enhance<br />
the vertical shear <strong>and</strong> the storm-relative<br />
helicity. Enhancement of SRH was<br />
experienced in <strong>Parkersburg</strong>, as Marshall et al.<br />
(2008) indicates SRH values in the<br />
9
<strong>Parkersburg</strong> region increased from 140 m 2 /s 2 two<br />
hour before the tornado to 210 m 2 /s 2 , potentially<br />
due to a gravity wave interaction.<br />
Characteristic synoptic scale patterns<br />
exist when gravity waves occur. According to<br />
Koch <strong>and</strong> O’H<strong>and</strong>ley (1997), in a climatological<br />
study of 13 published cases of gravity waves,<br />
gravity waves were found to occur in a region of<br />
diffluence, with a 300 mb ridge axis to the<br />
northeast, the 300 mb inflection axis to the<br />
southwest, <strong>and</strong> a surface frontal boundary to the<br />
southeast. Synoptic analysis at 12Z <strong>and</strong> 00Z (not<br />
shown) indicate that Iowa the region of the 300<br />
mb ridge-trough pattern associated with gravity<br />
wave initiation. In addition, Koch <strong>and</strong><br />
O’H<strong>and</strong>ley (1997) state that the jet streak is seen<br />
to propagate away from the 300 mb trough axis<br />
towards the inflection point in gravity wave<br />
initiation. While this definition seems unclear,<br />
according to Service Assessment: <strong>EF</strong>5 <strong>Tornado</strong><br />
in <strong>Parkersburg</strong> <strong>and</strong> New Hartford, Iowa (2009),<br />
a visible satellite image (not shown) indicates a<br />
gravity wave initiated in the right-rear quadrant<br />
of the 300 mb jet, a region favorable to gravity<br />
wave initiation.<br />
In addition to the favorable upper level<br />
pattern for the development of gravity waves, the<br />
environment at the surface in northeast Iowa also<br />
favors gravity wave production. As seen in<br />
Figure 8a, a stable layer between 850 mb <strong>and</strong><br />
800 mb was observed above Fort Dodge, <strong>IA</strong>,<br />
approximately 80 miles west of <strong>Parkersburg</strong>, at<br />
17Z. This stable layer is conducive to gravity<br />
waves, as the waves would be unable to<br />
propagate through the stable inversion <strong>and</strong><br />
therefore become trapped, or ducted. Three<br />
hours later, when a gravity wave was<br />
experienced, storms fired just east of Fort Dodge<br />
as the gravity waves propagated through. <strong>The</strong><br />
ability for a gravity wave to become ducted can<br />
also be assessed by the duct factor. As explained<br />
by Koch <strong>and</strong> O’H<strong>and</strong>ley (1997), the duct factor<br />
is an equation which accounts for the difference<br />
in potential temperature from 800 mb to 950 mb<br />
as well as the difference in equivalent potential<br />
temperature from 800 mb to 400 mb. It can be<br />
seen in the below equation.<br />
DF = Θ(800) − Θ(950) + Θ e<br />
(800) − Θ e<br />
(400)<br />
<strong>The</strong> reasoning for this equations, as Koch <strong>and</strong><br />
O’H<strong>and</strong>ley (1997) explains, is the fact that an<br />
efficient duct is one where there exists a<br />
conditionally unstable layer above a very<br />
stable surface based layer. As seen in Figure<br />
10b, the value of the duct factor for<br />
<strong>Parkersburg</strong> at 22Z is approaching 20 °C,<br />
which is considered more than favorable for<br />
gravity wave development <strong>and</strong> propagation,<br />
according to <strong>EF</strong>5 <strong>Tornado</strong> in <strong>Parkersburg</strong> <strong>and</strong><br />
New Hartford, Iowa (2009).<br />
As hypothesized, gravity waves were<br />
indeed experienced in the <strong>Parkersburg</strong> region<br />
during tornado development. By 21:40Z, 8<br />
minuted before the initial tornado developed,<br />
the leading gravity wave, indicated by the<br />
yellow dashed line, had propagated eastward<br />
of the tornado development area, as seen in<br />
Figure 8c. As the lead gravity wave<br />
propagated northeast through <strong>Parkersburg</strong>, a<br />
second gravity wave becomes evident on the<br />
visible image. Figure 8d, a composition of<br />
visible satellite, as well as radar data, from the<br />
National Weather Service WSR-88D captures<br />
this second gravity wave. <strong>The</strong> tornado<br />
developed just after the second gravity wave,<br />
indicated by the yellow dashed line in Figure<br />
8d, passed. <strong>The</strong> location of the tornado is<br />
expressed by the yellow “T.”<br />
Gravity waves can be<br />
indistinguishable from outflow boundaries on<br />
visible <strong>and</strong> radar images. However,<br />
surrounding surface analysis indicate the<br />
observed features are not outflow boundaries,<br />
Neither temperature, dew point temperature,<br />
nor wind speed <strong>and</strong> direction record any<br />
significant changes. Since the stable layer<br />
necessary for continued ducting of the gravity<br />
waves, as seen in Figure 8a, was elevated, the<br />
gravity waves were likely elevated as well.<br />
So, this could explain why there were no<br />
substantial changes in surface observations as<br />
both waves moved through the <strong>Parkersburg</strong><br />
region. However, for further verification of<br />
the present gravity waves, observations at the<br />
10
Waterloo airport indicates the familiar pressure<br />
signature associated with passing gravity waves,<br />
pressure falling near the wave trough <strong>and</strong> rising<br />
in the wave ridge. At the Waterloo Airport,<br />
rising pressure observed at 21:42Z gave way to<br />
falling pressure at 21:54Z. In addition, the<br />
propagation speed of the features, 50 knots, is<br />
also consistent with a gravity wave. <strong>The</strong>refore,<br />
it can be assumed the features on the visible, as<br />
well as WSR-88D radar, is indeed gravity<br />
waves. According to the Service Assessment:<br />
<strong>EF</strong>5 <strong>Tornado</strong> in <strong>Parkersburg</strong> <strong>and</strong> New<br />
Hartford, Iowa (2009), “given the rapid<br />
mesocyclone intensification <strong>and</strong> tornado<br />
development shortly after the passage of both<br />
gravity waves, these processes may very well<br />
have acted to enhance the intensity of the<br />
<strong>Parkersburg</strong> supercell.”<br />
Figure 8: Gravity wave analysis for 25 May 2008. a) RUC sounding at Fort Dodge, Iowa valid at 17Z. Note the<br />
stable layer between 950 mb <strong>and</strong> 800 mb. b) RUC layer duct function in degrees C valid at 22Z (red P indicates<br />
location of <strong>Parkersburg</strong>). c) Visible satellite imagery, 21:40Z (yellow line indicates position of lead gravity wave,<br />
red T indicates location of initial tornado formation at 2148 UTC). d) National Weather Service WSR-88D 0.5<br />
degree spectrum width 21:41Z (dashed yellow line indicates location of second gravity wave, solid red line indicates<br />
possible mesoscale boundary, yellow T indicates location of initial tornado development at 2148 UTC). Image<br />
courtesy of Service Assessment: <strong>EF</strong>5 <strong>Tornado</strong> in <strong>Parkersburg</strong> <strong>and</strong> New Hartford, Iowa, 2009.<br />
4) Heavy Precipitating Supercell<br />
According to Doswell et al. (1993),<br />
heavy precipitating (HP) supercells are probably<br />
the most common form of supercells. <strong>The</strong>se<br />
storms not only occur in the humid sector of the<br />
United States east of the Mississippi River<br />
but also westward into the high plains.<br />
However, in the Great Plains, the classic<br />
supercell is most often observed, as well as in<br />
tornado outbreaks east of the Mississippi<br />
11
River. <strong>The</strong>refore, the classic supercell also<br />
“probably accounts for the majority of violent<br />
(F4-5) tornadoes” (Doswell et al. 1993).<br />
<strong>The</strong> difference between a heavy<br />
precipitating supercell <strong>and</strong> classic supercell can<br />
be seen conceptual models, Figures 9 <strong>and</strong> 10.<br />
For the HP supercell, heavy precipitation is<br />
experienced, with the mesocyclone embedded<br />
within the precipitation region of the storm, as<br />
seen in the precipitation surrounding the wall<br />
cloud in Figure 9. However, while classic<br />
supercell features moderate precipitation, seen<br />
in Figure 10, light to no precipitation is<br />
experienced in the mesocyclone. During the<br />
collapse of a classic supercell, the mesocyclone<br />
may fill with precipitation. However, is not<br />
considered a transition to a HP supercell unless<br />
the mesocyclone persists amidst the<br />
precipitation. (Doswell et al., 1993)<br />
Due to the precipitation surrounding the<br />
mesocyclone, the tornadoes produced by HP<br />
supercells are not usually long-lived. According<br />
to Kulie et al. (1997), if middle tropospheric<br />
storm-relative winds are weak, precipitation<br />
does not fall downwind of the updraft.<br />
<strong>The</strong>refore, the mesocyclone is allowed to be<br />
located within the heavy precipitation. When<br />
this happens, the baroclinic generation of<br />
vorticity at low levels is enhanced, therefore<br />
creating a low level mesocyclone. However,<br />
due to the strength of the outflow, the storm's<br />
main updraft is cut off <strong>and</strong> this mesocyclone<br />
is short lived, <strong>and</strong> long-lived tornadoes are<br />
not typically produced.<br />
Figure 9: Conceptual model of a heavy precipitating<br />
supercell courtesy of Doswell et al. (1993). Note the<br />
precipitation surrounding the mesocyclone, inhibiting<br />
the formation of long-lived <strong>and</strong> violent tornadoes.<br />
Figure 10: Conceptual model of a classic supercell based on adapted from Lecture 3 (2009). Flow patterns include<br />
the Rear Flanking Downdraft (RFD), Forward Flanking Downdraft (FFD), <strong>and</strong> updraft. Note the lack of<br />
precipitation with respect to the mesocyclone <strong>and</strong> updraft when compared with the precipitation wrapped wall cloud<br />
in the heavy precipitating supercell.<br />
12
However, in spite of a heavy<br />
precipitating supercell's apparent inability to<br />
produce violent <strong>and</strong> long-lived tornadoes, the<br />
<strong>Parkersburg</strong> tornado was indeed produced from<br />
a HP supercell. Storm chasers, including<br />
University of Wisconsin-Madison storm chaser<br />
Jake Beitlich, have indicated the lack of a<br />
visible funnel, with issued warnings<br />
emphasizing a “rain wrapped” tornado.<br />
(Beitlich, 2009) As seen in Figure 11, a radar<br />
image valid at 22:02Z, the tornado is indeed<br />
wrapped in precipitation, surrounding the<br />
tornado <strong>and</strong>, assumingly, the mesocyclone.<br />
Kulie et al. (1997) explains the characteristics of<br />
HP supercells which allows them to produce<br />
violent tornadoes. HP supercells need<br />
“external” influences, especially those that<br />
produce long tornado tracks. One of these<br />
external characteristics is a preexisting<br />
baroclinic zones, which the supercell<br />
propagates along. As seen in Figure 8c, the<br />
<strong>Parkersburg</strong> tornado originated along a warm<br />
front, which featured an enhanced baroclinic<br />
zone due to lingering cloud cover over the<br />
northeast region of Iowa with clearing to the<br />
west. (Service Assessment: <strong>EF</strong>5 <strong>Tornado</strong> in<br />
<strong>Parkersburg</strong> <strong>and</strong> New Hartford, Iowa, 2009)<br />
This baroclinic zone enhances low level<br />
vorticity, as explained in the previous paragraph.<br />
In addition, a three-dimensional,<br />
nonhydrostatic, cloud-scale numerical model<br />
(TASS) was employed by Kulie et al. (1997) to<br />
study HP supercell vorticity. Vorticity<br />
development by TASS indicates that the<br />
significant vertical vorticity associated with the<br />
main updraft of the supercell originates in the<br />
lowest portions of the storm, potentially due to<br />
baroclinic vorticity generation, <strong>and</strong> then builds<br />
upward over time. In addition, significant tilting<br />
<strong>and</strong> stretching of baroclinically generated<br />
environmental horizontal vorticity, is<br />
experienced as the storm matures. <strong>The</strong>refore,<br />
the influence of gravity wave interaction on the<br />
supercell, another external influence, would<br />
enhance this tilting <strong>and</strong> stretching of horizontal<br />
vorticity <strong>and</strong> allow a violent tornado from a HP<br />
supercell. In addition, pulsating rear flank<br />
downdrafts, which would remain buoyant due<br />
to surface dew point temperatures above 70<br />
°F, as well as updraft mergers, are<br />
hypothesized by Kulie et al. (1997) to play a<br />
vital role in maintaining storm-scale rotation<br />
<strong>and</strong> updraft intensity despite the precipitation.<br />
Also, the rear gust front never occludes in the<br />
mature supercell, possibly due to the<br />
dominance of the low-level shear. <strong>The</strong>se<br />
factors combine to produce a violent tornado<br />
from a heavy precipitating supercell.<br />
Figure 11: Radar Image courtesy of NEXRCOMP valid<br />
at 22:02Z over northeast Iowa. Note the region of<br />
high reflectivity wrapping almost completely around<br />
the tornado, indicating the presence of a heavy<br />
precipitating supercell. <strong>The</strong> tornado signature is seen<br />
in the white box, with the left-moving supercell<br />
indicated by the arrow.<br />
5) Miller Diagram<br />
By utilizing a Miller diagram, the<br />
synoptic environment which spawned a heavy<br />
precipitating <strong>EF</strong>-5 tornado, can be depicted.<br />
As seen in Figure 12, a h<strong>and</strong>-drawn Miller<br />
diagram valid at 22Z on 25 May 2008, the<br />
synoptic environment displays a slightly<br />
altered Type B tornado-producing synoptic<br />
pattern. Consistent with the Type B pattern,<br />
this synoptic pattern contains the<br />
characteristic southwesterly jet at 300 mb,<br />
with a southernly current of warm moist air<br />
from the surface to 850 mb, as well as an<br />
13
upper level trough (not depicted in Figure 12).<br />
However, unlike the Miller diagram Type B<br />
synoptic pattern, the synoptic environment at<br />
22Z on 25 May 2008 does not feature low-level<br />
intrusion of dry air. Instead, the dry air is<br />
confined to the region west of the surface cold<br />
front. This confinement allows moisture to<br />
extend to 700 mb. In addition, the synoptic<br />
pattern depicted in Figure 12 features<br />
convection along the warm front, instead of the<br />
cold front described by the Type B synoptic<br />
pattern in Miller (1972).<br />
<strong>The</strong> hybrid Type B synoptic<br />
environment, depicted by the Miller diagram in<br />
Figure 12, is consistent with the synoptic<br />
environment characteristic for the development<br />
of heavy precipitating supercells. According to<br />
Structure <strong>and</strong> Dynamics of Supercell<br />
Thunderstorms (2005), HP supercells occur in<br />
environments with rich low-level moisture <strong>and</strong><br />
moderate-to-strong wind shear. As seen in<br />
Figure 12, a moisture tongue is present at 850<br />
mb, due to a southerly low level jet bring<br />
moist air from the Gulf of Mexico into the<br />
region. This moisture at 850 mb also extends<br />
to 700 mb to produce an environment rich in<br />
low-level moisture. In addition, both<br />
directional <strong>and</strong> speed shear is observed at 22Z<br />
on 25 May 2008 in Figure 12. Wind speeds<br />
associated with the low level jet at 850 mb<br />
reach a maximum of 30 knots from the southsouthwest.<br />
At 500 mb, wind speeds increase<br />
to 50 knots from the west, providing the<br />
necessary speed <strong>and</strong> directional wind shear to<br />
produce a heavy precipitating supercell. A 90<br />
knot southwesterly jet is also observed at 300<br />
mb. While this shear due to the 300 mb is not<br />
entirely necessary for tornado formation,<br />
since bulk shear is only considered from 0-6<br />
km AGL, this jet at 300 mb provides a<br />
Figure 12: Miller diagram valid at 22Z on 25 May 2008. Analyzed features include surface fronts (penciled), 850<br />
mb moisture tongue (green) <strong>and</strong> low level jet maximum <strong>and</strong> direction (red arrow), 700 mb moisture (solid brown<br />
line) <strong>and</strong> dryline (dashed brown line), 500 mb wind maximum <strong>and</strong> direction (blue striped), <strong>and</strong> 300 mb jet<br />
maximum <strong>and</strong> direction (purple checked). Region of severe weather threat is indicated in black. Note the lowlevel<br />
moisture extending to 700 mb, as well as wind shear, creating a characteristic of environment production of<br />
heavy precipitating supercells.<br />
14
favorable region for gravity wave initiation,<br />
which intensifies a mesocyclone upon<br />
interaction. <strong>The</strong>refore, these synoptic features<br />
combined to produce a threat area associated<br />
with the surface warm front, a region<br />
characteristic of transitory mesocyclones<br />
associated with warm front in a Type B synoptic<br />
pattern depicted by Miller (1972) <strong>and</strong> consistent<br />
with the environment in which HP supercells<br />
occur.<br />
V. Conclusion<br />
As hypothesized, the tornado, which<br />
devastated the town of <strong>Parkersburg</strong> on 25 May<br />
2008 <strong>and</strong> originated from a heavy precipitating<br />
supercell, formed in the perfect environment for<br />
significant tornado development <strong>and</strong> was further<br />
enhanced by interactions with gravity waves. At<br />
the upper levels, divergence combined with a<br />
surface warm front to provide dynamical lifting<br />
for air parcels. <strong>The</strong>se air parcels quickly<br />
reached saturation, due to moisture fluxed into<br />
the region from the low level jet. Due to a<br />
moderate lapse rate seen in the LAPS sounding<br />
from <strong>Parkersburg</strong>, the saturated parcels cooled<br />
less than the surrounding environment, <strong>and</strong> were<br />
able to rise in the conditionally unstable<br />
enviroment. In addition to the lapse rate,<br />
instability, observed in the ratio of convective<br />
available potential energy to convective<br />
inhibition <strong>and</strong> depicted in severe index<br />
parameters, was “well within the range of<br />
concern for strong <strong>and</strong> violent tornadoes,”<br />
(Marshall et al., 2008). This instability<br />
combined with positive helicity, in the form of<br />
veering wind direction with height <strong>and</strong> backing<br />
wind direction with time, to further strengthen<br />
the right moving supercell.<br />
In addition to the favorable synoptic <strong>and</strong><br />
mesoscale environment, gravity wave<br />
interaction with the mesocyclone also<br />
heightened the possibility of a violent tornado.<br />
Gravity waves act to enhance the vorticity<br />
associated with a mesocyclone, through either<br />
stretching preexisting vorticity by horizontal<br />
convergence or tilting horizontal vorticity into<br />
the vertical direction. Prior to tornado<br />
development, the <strong>Parkersburg</strong> mesocyclone<br />
interacted with two gravity waves. According<br />
to the Service Assessment: <strong>EF</strong>5 <strong>Tornado</strong> in<br />
<strong>Parkersburg</strong> <strong>and</strong> New Hartford, Iowa (2009),<br />
“given the rapid mesocyclone intensification<br />
<strong>and</strong> tornado development shortly after the<br />
passage of both gravity waves, these<br />
processes may very well have acted to<br />
enhance the intensity of the <strong>Parkersburg</strong><br />
supercell.” <strong>The</strong> increase in vorticity<br />
generated by the two gravity waves acted as<br />
external forces, along with a surface warm<br />
front, to allow a heavy precipitating supercell<br />
to produce a violent tornado despite the<br />
precipitation surrounding the mesocyclone.<br />
This violent tornado, with maximum winds<br />
estimated at 205 miles per hour, would claim<br />
8 lives in its 43 mile path in Iowa's first <strong>EF</strong>-5<br />
tornado since 1976.<br />
V1. Acknowledgments<br />
<strong>The</strong> author of this paper would like to<br />
thank Michael Phillips for his insight on<br />
gravity wave interactions with mesocyclones<br />
<strong>and</strong> Bryan Heth for his help in the synoptic<br />
analysis <strong>and</strong> Miller diagram for this storm, as<br />
well as other classmates for their assistance<br />
with this paper. In addition, special thanks to<br />
Dan Henz <strong>and</strong> Professor Greg Tripoli from<br />
UW-Madison for their insight into tornado<br />
development, Jeff Duda from Iowa State for<br />
his assistance in obtaining initial information<br />
about the <strong>Parkersburg</strong> tornado, as well as Pete<br />
Pokr<strong>and</strong>t for obtaining data for synoptic <strong>and</strong><br />
mesoscale analysis.<br />
VII. References<br />
Beitlich, J. Personal Interview, 27 April 2009<br />
Cogil, C. <strong>and</strong> J. Johnson, 2008: Iowa <strong>Tornado</strong><br />
Climatology [internet] National<br />
<strong>Oceanic</strong> <strong>and</strong> <strong>Atmospheric</strong><br />
Administration; [cited 26 April 2009].<br />
Available from http://www.images/<br />
15
dmx/IowaTorClimatologyFinal-<br />
2008.pdf<br />
Coleman T.A., <strong>and</strong> K.R. Knupp: 2008: <strong>The</strong><br />
Interaction of Gravity Waves with<br />
<strong>Tornado</strong>es <strong>and</strong> Mesocyclones:<br />
<strong>The</strong>ories <strong>and</strong> Observations. [internet]<br />
American Meteorological Society<br />
Conference; [cited 2 May 2009]<br />
Available from http://ams.confex.com/<br />
ams/pdfpapers/115242.pdf<br />
Doswell, C.A. III, <strong>and</strong> D.W. Burgess, 1993:<br />
<strong>Tornado</strong>es <strong>and</strong> Tornadic Storms: A<br />
Review of Conceptual Models. <strong>The</strong><br />
<strong>Tornado</strong>: Its Structure, Dynamics,<br />
Prediction, <strong>and</strong> Hazards, Geophysical<br />
Monograph 79, Amer. Geophys.<br />
Union, 161-172.<br />
Koch, S. E., <strong>and</strong> C. O’H<strong>and</strong>ley, 1997:<br />
Operational Forecasting <strong>and</strong> Detection<br />
of Mesoscale Gravity Waves. Wea.<br />
Forecasting, 12, 253-281.<br />
Kulie, M.S., <strong>and</strong> Y-L Lin, 1997: <strong>The</strong> Structure<br />
<strong>and</strong> Evolution of a Numerically<br />
Simulated High-Precipitation<br />
Supercell Thunderstorm. Monthly<br />
Weather Review, 126, 2090-2116.<br />
Marshall, T. P., K. A., Jungbluth, <strong>and</strong> A. Baca,<br />
2008: <strong>The</strong> <strong>Parkersburg</strong>, <strong>IA</strong> <strong>Tornado</strong>: 25<br />
May 2008 [internet] American<br />
Meteorological Society Conference;<br />
[cited 28 April 2009]. Available from<br />
http://ams.confex.com/ams/pdfpapers/<br />
141533.pdf<br />
Miller, D. J., 2006: Observations of low level<br />
thermodynamic <strong>and</strong> wind shear<br />
profiles on significant tornado days.<br />
Preprints, 23rd Conf. on Severe Local<br />
Storms, St. Louis, MO, Amer. Meteor.<br />
Soc., 1206-1223.<br />
Miller, R.C., 1972: Notes on Analysis <strong>and</strong><br />
Severe-Storm Forecasting Procedures<br />
of the Air Force Global Weather<br />
Central. Air Weather Service, 1-23.<br />
<strong>Parkersburg</strong> - New Hartford - Dunkerton <strong>EF</strong>5<br />
<strong>Tornado</strong> of May 25, 2008 [internet]<br />
[24 June 2008] National <strong>Oceanic</strong> <strong>and</strong><br />
<strong>Atmospheric</strong> Administration;<br />
[cited 26 April 2009]. Available from<br />
http://www.crh.noaa.gov/dmx/?<br />
n=parkersburg<br />
Service Assessment: <strong>EF</strong>5 <strong>Tornado</strong> in<br />
<strong>Parkersburg</strong> <strong>and</strong> New Hartford, Iowa<br />
[internet] [January 2009] National<br />
<strong>Oceanic</strong> <strong>and</strong> <strong>Atmospheric</strong><br />
Administration; [cited 26 April 2009].<br />
Available from http://www.crh.noaa.<br />
gov/images/dmx/<strong>Parkersburg</strong>Svc<br />
Assmntfinal.pdf<br />
Structure <strong>and</strong> Dynamics of Supercell<br />
Thunderstorms. [internet] [updated 3<br />
Nov 2005] National Weather Service:<br />
Louisville. [cited 3 May 2009]<br />
Available from http://www.crh.noaa.<br />
gov/lmk/soo/docu/supercell.php<br />
Tripoli, G, 2009: <strong>The</strong>rmal Upslope/Dryline<br />
[internet] AOS 453 Lectures; [cited<br />
30 March 2009] Available from http://<br />
www.aos.wisc.edu/~aos452/<br />
lectures09.html<br />
---: 2009: Lecture 3 [internet] AOS 453<br />
Lectures; [cited 30 March 2009]<br />
Available fromhttp://www.aos.wisc.<br />
edu/~aos452/lectures09.html<br />
16