Scandi Covered - Danske Analyse - Danske Bank
Scandi Covered - Danske Analyse - Danske Bank
Scandi Covered - Danske Analyse - Danske Bank

Create successful ePaper yourself
Turn your PDF publications into a flip-book with our unique Google optimized e-Paper software.
Investment Research<br />
<strong>Scandi</strong> Handbook<br />
- the credit handbook of large and medium-sized<br />
corporates and financials in the <strong>Scandi</strong>navian region<br />
April 2011<br />
www.danskeresearch.com
Fixed Income Credit Research<br />
Head of Credit Research<br />
Thomas Hovard<br />
+45 45 12 85 05<br />
thomas.hovard<br />
Utilities & Energy TMT<br />
Financials & Strategy Pulp & Paper Industrials<br />
Jakob Magnussen<br />
+45 45 12 85 03<br />
jakob.magnussen<br />
Louis Landeman<br />
+46 8 568 80524<br />
louis.landeman<br />
Thomas Hovard<br />
+45 45 12 85 05<br />
thomas.hovard<br />
Henrik Arnt<br />
+45 45 12 85 04<br />
henrik.arnt<br />
Kristian Myrup<br />
Pedersen<br />
+45 45 12 85 19<br />
kripe<br />
Asbjørn P. Andersen<br />
+45 45 14 88 86<br />
asbjorn.andersen<br />
Kristian Myrup<br />
Pedersen<br />
+45 45 12 85 19<br />
kripe<br />
email addresses end @danskebank.com
Investment Research<br />
13 April 2011<br />
<strong>Scandi</strong> Handbook<br />
Issue 16<br />
Welcome to the sixteenth issue of the <strong>Scandi</strong> Handbook from the Fixed Income Credit<br />
Research team at <strong>Danske</strong> Markets.<br />
This publication is intended to act as a quick reference guide to the <strong>Scandi</strong>navian corporate<br />
credit market, providing an overview of each credit issuer, along with an indication<br />
of relative value within the peer groups. The publication covers a wide range of the region’s<br />
corporates and financials that have a credit rating from at least one of the major<br />
rating agencies (Moody’s, Standard & Poor’s and Fitch), and / or are established issuers<br />
in the EUR market. In addition to this, we have included a number of issuers that are<br />
either active in the domestic credit markets and / or corporates that we see as potential<br />
future issuers in the EUR markets.<br />
The table below lists the issuers included in this edition of the <strong>Scandi</strong> Handbook.<br />
Issuers included in this edition of the <strong>Scandi</strong> Handbook<br />
Financials General Industrials Pulp & Paper TMT Utilities & Energy<br />
DnB NOR ABB M-real Elisa DONG Energy<br />
FIH A.P.Moller-Maersk Norske Skog Ericsson Fortum<br />
Handelsbanken Assa Abloy Stora Enso Nokia Neste Oil<br />
Jyske <strong>Bank</strong> Atlas Copco Svenska Cellulosa (SCA) TDC Statkraft<br />
Nordea Carlsberg UPM-Kymmene Telenor Statnett<br />
Nykredit <strong>Bank</strong> Electrolux TeliaSonera Statoil<br />
Pohjola <strong>Bank</strong> ISS TVO<br />
Sampo Investor Vattenfall<br />
SBAB Metso Vestas<br />
SEB<br />
Sandvik<br />
Sydbank<br />
Scania<br />
Swedbank<br />
Securitas<br />
Volvofinans<br />
SKF<br />
Stena AB<br />
Swedish Match<br />
Vasakronan<br />
Volvo<br />
Source: <strong>Danske</strong> Markets<br />
The majority of the companies in the handbook are part of the core coverage universe of the<br />
Credit Research team of <strong>Danske</strong> <strong>Bank</strong> (highlighted in bold in the table above) – i.e., detailed<br />
Credit Comments are published after events that are of significance to the credit quality of<br />
the issuers.<br />
In relation to the previous <strong>Scandi</strong> Handbook, we have included coverage on Swedish Match,<br />
Stena AB, Neste Oil and Statnett in this sixteenth edition. We have withdrawn Hafslund<br />
from our coverage list.<br />
The prices outlined in this book are only indicative.<br />
All instrument specific prices as pr. 11 April 2010 can be found at the back of this book.<br />
All relevant fixed income research from <strong>Danske</strong> Markets can be found on Bloomberg hitting<br />
DRCR.<br />
Important disclosures and certifications are contained from page 224 of this report.<br />
www.danskeresearch.com
<strong>Scandi</strong> Handbook<br />
2 | 13 April 2011<br />
www.danskeresearch.com
<strong>Scandi</strong> Handbook<br />
Contents<br />
Financials ............................................................................................................................................................... 5<br />
DnB NOR............................................................................................................................................................. 6<br />
FIH ........................................................................................................................................................................ 10<br />
Handelsbanken ............................................................................................................................................ 14<br />
Jyske <strong>Bank</strong> ...................................................................................................................................................... 18<br />
Nordea .............................................................................................................................................................. 22<br />
Nykredit <strong>Bank</strong> ............................................................................................................................................... 26<br />
Pohjola <strong>Bank</strong>.................................................................................................................................................. 30<br />
Sampo Group ................................................................................................................................................ 34<br />
SBAB .................................................................................................................................................................. 38<br />
SEB ...................................................................................................................................................................... 42<br />
Swedbank ........................................................................................................................................................ 46<br />
Sydbank ............................................................................................................................................................ 50<br />
Volvofinans <strong>Bank</strong> ........................................................................................................................................ 54<br />
General Industrials ..................................................................................................................................... 59<br />
ABB ..................................................................................................................................................................... 60<br />
A.P. Moller-Maersk Group ................................................................................................................... 64<br />
Assa Abloy ...................................................................................................................................................... 68<br />
Atlas Copco .................................................................................................................................................... 72<br />
Carlsberg ......................................................................................................................................................... 76<br />
Electrolux ......................................................................................................................................................... 80<br />
Investor AB .................................................................................................................................................... 84<br />
ISS ........................................................................................................................................................................ 88<br />
Metso ................................................................................................................................................................. 92<br />
Sandvik .............................................................................................................................................................. 96<br />
Scania ............................................................................................................................................................ 100<br />
Securitas ..................................................................................................................................................... 104<br />
SKF .................................................................................................................................................................. 108<br />
Stena .............................................................................................................................................................. 112<br />
Swedish Match ........................................................................................................................................ 116<br />
Vasakronan ................................................................................................................................................ 120<br />
Volvo AB ...................................................................................................................................................... 124<br />
Pulp & Paper ................................................................................................................................................ 129<br />
M-real ............................................................................................................................................................ 130<br />
Norske Skog .............................................................................................................................................. 134<br />
SCA ................................................................................................................................................................. 138<br />
Stora Enso .................................................................................................................................................. 142<br />
UPM-Kymmene ....................................................................................................................................... 146<br />
Telecoms, Media & Technology ................................................................................................... 151<br />
Elisa ................................................................................................................................................................. 152<br />
Ericsson ....................................................................................................................................................... 156<br />
Nokia .............................................................................................................................................................. 160<br />
TDC .................................................................................................................................................................. 164<br />
Telenor .......................................................................................................................................................... 168<br />
TeliaSonera ................................................................................................................................................ 172<br />
Utilities ............................................................................................................................................................. 177<br />
DONG Energy ............................................................................................................................................ 178<br />
Fortum ........................................................................................................................................................... 182<br />
Neste Oil ...................................................................................................................................................... 186<br />
Statkraft ....................................................................................................................................................... 190<br />
Statnett......................................................................................................................................................... 194<br />
Statoil ............................................................................................................................................................. 198<br />
TVO .................................................................................................................................................................. 202<br />
Vattenfall ..................................................................................................................................................... 206<br />
Vestas ........................................................................................................................................................... 210<br />
Appendix ......................................................................................................................................................... 215<br />
3 | 13 April 2011<br />
www.danskeresearch.com
<strong>Scandi</strong> Handbook<br />
4 | 13 April 2011<br />
www.danskeresearch.com
<strong>Scandi</strong> Handbook<br />
Financials<br />
5 | 13 April 2011<br />
www.danskeresearch.com
<strong>Scandi</strong> Handbook<br />
DnB NOR<br />
Company overview<br />
DnB NOR is the largest financial group in Norway and one of the largest banking<br />
groups in the Nordic region. The bank services more than 2.2 million retail customers<br />
and 200,000 corporate clients and its domestic market share for retail lending and<br />
deposits is around 30%. The Group was formed in 2004 through the joining of two<br />
leading Norwegian financial institutions, Den norske <strong>Bank</strong> (DnB) and Gjensidige<br />
NOR, in response to demand from various parties to create a strong, domestically<br />
based financial services group, which would benefit from the complementary business<br />
profiles. The bank is a major partner for Norwegian companies abroad as well as<br />
for large international companies operating in Norway. It is also the largest asset<br />
manager in Norway. DnB NOR operates through strong additional brands including<br />
Norway’s largest pension and life insurance company Vital (life insurance), with<br />
about one million customers, Nordlandsbanken, Gjensidige NOR and Postbanken. In<br />
addition, the company is one of the world leaders in shipping finance and has top<br />
expertise in other important industries in Norway, such as fisheries and oil drilling.<br />
DnB NOR is also the largest real estate broker in Norway. The Norwegian government<br />
is the biggest shareholder with a 34% stake, while DnB NOR Savings <strong>Bank</strong><br />
foundation holds 10%.<br />
DnB NOR is active in the Baltic countries through the subsidiary DnB NORD. Last<br />
year, DnB NOR took full ownership of DnB NORD after the bank acquired Norddeutsche<br />
Landesbank’s 49% stake.<br />
Key credit considerations<br />
Norwegian economy among the strongest in the world<br />
More than 80% of income is generated in Norway, illustrating the heavy reliance on<br />
the performance of the Norwegian economy. The Norwegian economy is one of the<br />
strongest in the world and DnB NOR’s position as a market leader gives it a very<br />
strong base. We expect Norwegian mainland GDP to increase by a sound 3.4% this<br />
year and further increase by 3.5% in 2012. The macroeconomic backdrop is therefore<br />
strong in Norway and further underpinned by healthy public finances.<br />
The sharp decline in interest rates during the financial crisis prompted a visible rebound<br />
in the Norwegian housing market and currently house prices are at their highest<br />
level ever and household indebtedness has continued to increase. Last year the<br />
central bank increased its policy rate to 2% and going forward more hikes are expected.<br />
If rate increases accelerate it may be a cause for concern for house prices and<br />
the economy in general as financing is predominantly linked to the short-term interest<br />
rate. However, the very low level of unemployment is a mitigating aspect and<br />
<strong>Danske</strong> Research expects unemployment to come down to close to 3% in the coming<br />
years.<br />
SELL<br />
Sector: Financials<br />
Corporate ticker: DNBNOR<br />
Equity ticker: DNBNOR NO<br />
Market cap: NOK 142bn<br />
Ratings:<br />
S&P rating: A+ (stable)<br />
Moodys rating: Aa3 (stable)<br />
Fitch rating: A+ (stable)<br />
Analysts:<br />
Henrik Arnt<br />
henrik.arnt@danskebank.dk<br />
+45 4512 8504<br />
Thomas Hovard<br />
thomas.hovard@danskebank.dk<br />
+45 4512 8505<br />
Key credit issues<br />
Strengths:<br />
• Exposure to strong Norwegian<br />
economy<br />
• 34% owned by the government<br />
Challenges:<br />
• Shipping exposure<br />
• Very high reliance on Norway<br />
Source: <strong>Danske</strong> Markets<br />
A systemically important institution<br />
Due to DnB NOR’s high market share within all financial services and products in<br />
Norway, as well as its substantial size in the domestic payment systems, the Group is<br />
a systemically important institution. This is further backed by the government’s 34%<br />
ownership of DnB NOR, which constitutes a blocking minority under Norwegian<br />
law. We do not expect the government to dispose of its stake. Note that the government<br />
does not interfere with the daily business of DnB NOR and it holds no seat on<br />
the board.<br />
Capitalisation<br />
By the end of 2010, DnB NOR had a Tier 1 ratio of 10.1% up from 9.3% in 2009.<br />
The reason behind the big improvement is that risk-weighted assets have fallen as the<br />
bank has been granted the right to use advanced IRB for its large corporate portfolio.<br />
Going forward, the RWA may be further reduced during 2011 as DnB NOR migrates<br />
the rest of its corporate portfolio to advanced IRB. According to DnB, the Tier 1 ratio<br />
would be 12.3% under full IRB implementation.<br />
6 | 13 April 2011<br />
www.danskeresearch.com
<strong>Scandi</strong> Handbook<br />
Furthermore, we highlight that Norway has tough rules concerning the capital treatment<br />
of investments in insurance companies compared to the rest of Europe. If for<br />
instance, DnB NOR was subject to Swedish rules for insurance exposure, the Tier 1<br />
ratio would be some 1.5pp higher than the reported ratios. Hence, when comparing<br />
Norwegian and Swedish banks, the latter will look stronger on headline numbers.<br />
Overall, the capitalisation of DnB Nor is therefore very sound in our view and on the<br />
capital side the bank is probably the least affected by Basel III in the Nordic region.<br />
The strong capital position is also recognised by S&P’s RAC framework where DnB<br />
ranks among the best capitalised banks in the world.<br />
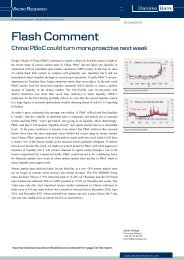
Asset quality<br />
2010 provided a turnaround for asset quality compared with a difficult 2009. The<br />
loan loss ratio for 2009 fell to 26bp down from 69bp in 2009 and during the year it<br />
was a declining trend (see graph). The level on impaired loans decreased marginally<br />
to 2.37% of total loans from 2.41% the year before. The coverage ratio by the end of<br />
2010 stood at 40%, which is a little lower than peers.<br />
Generally, credit quality is well supported through DnB’s large exposure to Norway<br />
and in particular its high relative exposure to households (48% of the loan book is to<br />
Norwegian households). The Baltics and Poland account for 5% of total lending<br />
since DnB NOR acquired full ownership of DnB NORD. In our view, exposure to<br />
shipping is the main adverse credit driver for the Group (see separate section below)<br />
whereas the rest of the loan book is well diversified.<br />
Liquidity and funding<br />
DnB NOR has access to a strong deposit base, as it benefits from its leading position<br />
in the Norwegian savings markets. At the end of 2010, deposits represented 41% of<br />
the Group’s total assets and 55% of total lending. Corporate deposits account for a<br />
significant amount hereof and this is, in our view, a reflection of DnB’s status as a<br />
strong bank as well as its being a national champion. The reliance on wholesale funding<br />
is still relatively high although a substantial part of the loan book can be financed<br />
through issuance of covered bonds in DnB Boligkredit. It is a strategic goal for DnB<br />
NOR to further increase the balance between loans and deposits in the years ahead<br />
and to some extent this has already happened. Going forward, DnB wants to be recognised<br />
as being among the top 15 banks in the world when it comes to accessing<br />
international capital markets.<br />
Current performance drivers<br />
Q4 10 earnings report<br />
In Q4 10, DnB NOR delivered a very sound report. Net interest income increased<br />
10% y/y to NOK6.2bn, on the back of expansion in margins as well as volumes.<br />
Commissions were also ahead of expectations as was trading income. Net profit<br />
ended at NOK5.3bn compared with consensus expectations of NOK3.1bn and the<br />
bank continues to benefit from the benign operating environment in Norway.<br />
Shipping exposure<br />
DnB NOR is one of the leading shipping banks in the world and the shipping exposure<br />
represents about 11% of total lending, which is a relatively high level given the<br />
highly cyclical nature of the shipping business. Recently, freight rates have come<br />
under pressure again (the Baltic dry index in particular) and this once again turns<br />
attention towards the shipping exposures of banks. Five year old crude and dry bulk<br />
carriers are now priced at around half and a third, respectively, of the peak values<br />
witnessed during H1 08.<br />
Capitalisation<br />
14%<br />
12%<br />
10%<br />
8%<br />
6%<br />
4%<br />
2%<br />
0%<br />
Source: Company data and <strong>Danske</strong> Markets<br />
Loss ratio (% ann.)<br />
0.9%<br />
0.8%<br />
0.7%<br />
0.6%<br />
0.5%<br />
0.4%<br />
0.3%<br />
0.2%<br />
0.1%<br />
0.0%<br />
2006 2007 2008 2009 2010<br />
Q2 08 Q4 08 Q2 09 Q4 09 Q2 10 Q4 10<br />
Source: Company data & <strong>Danske</strong> Markets<br />
Funding mix 2010<br />
Market<br />
funds<br />
33%<br />
Core capital ratio<br />
Equity<br />
Sub debt 7%<br />
3%<br />
Interbank<br />
17%<br />
Total capital ratio<br />
Retail<br />
deposits<br />
25%<br />
Corporate<br />
deposits<br />
16%<br />
Source: Company data & <strong>Danske</strong> Markets<br />
So far, shipping losses have remained low – in Q4 10 as low as NOK36m. This suggests<br />
that DnB has a high quality shipping loan book and generally, DnB NOR is<br />
exposed to the largest and most solid players in the shipping business, which is a<br />
result of a strategy change in the 1990s. Consequently, we believe that DnB will be<br />
7 | 13 April 2011<br />
www.danskeresearch.com
<strong>Scandi</strong> Handbook<br />
hit relatively late in the ‘shipping cycle’. However, covenant breaches have been<br />
widespread in recent years.<br />
Baltic and Polish exposure increased following purchase of DnB NORD<br />
DnB NOR announced at the end of 2009 that it had initiated an evaluation process<br />
run during 2010 by which it entered into negotiations with Nord LB concerning DnB<br />
NORD. This process was finalised in December last year resulting in DnB NOR<br />
acquiring Nord LB’s 49% stake in DnB NORD. The price was around 0.6x book<br />
value and it will result in a de-facto doubling of the Baltic and Polish exposure to<br />
some 5% of the total loan book.<br />
We were initially rather negative on the announcement as at the time we considered<br />
Baltic exposure to be risky due to the magnitude of the crisis. In the last year, however,<br />
a remarkable recovery has taken place in the Baltic countries and visibility has<br />
been much improved not least in Estonia, which adopted the euro at the beginning of<br />
this year. As things are turning out it may very well be that DnB NOR has made an<br />
astute deal. Overall we therefore do not consider Baltic risk to be a main credit driver<br />
for DnB NOR.<br />
Recommendation<br />
A strong domestic economy as well as a supportive ownership structure is positive<br />
credit factors and profitability is high once again. Shipping exposure remains our<br />
main concern, but so far it has not given rise to large losses and we therefore consider<br />
this segment to be well managed. The increasing Baltic exposure following the buyout<br />
of Nord LB’s minority stake in DnB NORD is currently not a major concern<br />
given the strong recovery in the Baltics and the still modest relative importance of<br />
the Baltic operations. On the longer horizon, risks may arise if the Norwegian housing<br />
market overheats, but we currently consider such concerns premature.<br />
Spreads in DnB have outperformed over the last year and now only trade wider than<br />
Handelsbanken (if looking at fixed bonds). Generally, we are of the view that the<br />
large banks in the Nordic region remain a relatively safe play in 2011, as we do not<br />
foresee a turn for the worse. Against this background, we believe it would be better<br />
to pursue a pick-up in some of the other names and we move our recommendation<br />
from HOLD to SELL. Please see list of instrument prices at the end of this book.<br />
Earning assets mix 2010<br />
Securities<br />
27%<br />
Due from<br />
banks<br />
3%<br />
Source: Company reports & <strong>Danske</strong> Markets<br />
Revenue split 2010<br />
Other<br />
income 5%<br />
Financial<br />
income<br />
13%<br />
Fees and<br />
commissions<br />
20%<br />
Retail<br />
34%<br />
Corporate<br />
36%<br />
Net interest<br />
income<br />
59%<br />
Source: Company data and <strong>Danske</strong> Markets<br />
Efficiency and earnings<br />
53%<br />
52%<br />
51%<br />
50%<br />
49%<br />
48%<br />
47%<br />
46%<br />
45%<br />
44%<br />
2006 2007 2008 2009 2010<br />
2.5%<br />
2.0%<br />
1.5%<br />
1.0%<br />
0.5%<br />
0.0%<br />
Recurring earnings power, RHS<br />
Cost/income<br />
Source: Company reports & <strong>Danske</strong> Markets<br />
8 | 13 April 2011<br />
www.danskeresearch.com
<strong>Scandi</strong> Handbook<br />
Financial data DnB NOR<br />
P&L (NOKm) 2006 2007 2008 2009 2010<br />
Net interest income 15,289 17,866 21,909 22,633 23,436<br />
Fees and commissions 6,710 7,084 6,894 6,655 7,041<br />
Net result from financial transactions 3,610 3,185 3,631 6,286 4,961<br />
Other income 2,713 3,454 1,573 1,960 3,974<br />
Total revenue 28,322 31,589 34,007 37,534 39,412<br />
Personnel costs 7,967 9,413 9,463 9,917 9,259<br />
Other costs 5,745 6,005 7,040 6,784 6,995<br />
Depreciation and amortization 715 1,032 1,121 1,480 2,256<br />
Total costs 14,427 16,450 17,624 18,181 18,510<br />
Preprovision income (PPI) 13,895 15,139 16,383 19,353 20,902<br />
Loan losses and provisions -258 220 3,509 7,710 2,997<br />
Operating profit (core earnings) 14,153 14,919 12,874 11,643 17,905<br />
Non-recurring items 536 2,490 -307 -531 279<br />
Pre-tax income 14,689 17,409 12,567 11,112 18,184<br />
Tax 2,881 2,387 3,334 4,086 4,121<br />
Net income 11,808 15,022 9,233 7,026 14,063<br />
Adjusted net income 11,300 12,299 10,570 9,209 14,716<br />
Balance sheet (NOKm) 2006 2007 2008 2009 2010<br />
Due from central banks and credit institutions 82,544 74,195 110,864 94,176 63,990<br />
Lending to general public 827,947 970,504 1,191,927 1,114,886 1,170,341<br />
Securities 285,877 285,925 317,566 463,474 458,844<br />
Earning assets 1,196,368 1,330,624 1,620,357 1,672,536 1,693,175<br />
Other assets 123,875 143,294 211,737 150,917 168,445<br />
Total assets 1,320,243 1,473,918 1,832,094 1,823,453 1,861,620<br />
Deposits from the general public 474,526 538,151 597,242 590,745 641,914<br />
Issued securities incl. covered bonds 326,806 371,784 606,222 493,732 501,668<br />
Subordinated debt ex hybrid 28,374 24,264 35,280 30,396 25,056<br />
Hybrid securities (Tier 1) 5,603 8,962 9,945 8,655 8,423<br />
Equity 64,211 73,314 77,337 98,648 111,196<br />
Risk weighted assets (RWA) 880,292 991,455 1,199,653 1,052,566 1,028,404<br />
Key ratios 2006 2007 2008 2009 2010<br />
Net interest margin 1.4% 1.4% 1.5% 1.4% 1.4%<br />
Recurring earnings power (1) 1.7% 1.6% 1.5% 1.7% 2.0%<br />
Return on average assets (before tax) 1.0% 1.1% 0.6% 0.4% 0.8%<br />
Return on average equity before tax 24.2% 25.3% 16.7% 12.6% 17.3%<br />
Return on average equity after tax 19.4% 21.8% 12.3% 8.0% 13.4%<br />
Cost/income 50.9% 52.1% 51.8% 48.4% 47.0%<br />
Problem loans/Total loans 0.5% 0.4% 1.0% 2.4% 2.4%<br />
Loan loss provisions / Total loans 0.0% 0.0% 0.3% 0.7% 0.3%<br />
Loan loss reserves/Problem loans 125.5% 124.7% 41.3% 39.9% 40.3%<br />
Loan loss reserves/Pre-provision income 34.3% 34.4% 30.0% 55.4% 53.3%<br />
Avg. customer deposits/avg. total funding 50.8% 49.5% 45.1% 41.6% 43.1%<br />
Market funds / total funding 47.4% 47.3% 55.2% 54.8% 51.3%<br />
Avg. gross loans/avg. customer deposits 172% 178% 190% 194% 185%<br />
Lending growth 18.7% 17.2% 22.8% -6.5% 5.0%<br />
Payout ratio 45.7% 40.6% 0.0% 33.2% 44.0%<br />
Core capital ratio incl hybrid 6.7% 7.2% 6.7% 9.3% 10.1%<br />
Core capital ratio ex hybrid 6.1% 6.3% 6.7% 8.5% 9.2%<br />
Total capital ratio 10.0% 9.6% 9.5% 12.1% 12.4%<br />
Source: Company data and <strong>Danske</strong> Fixed Income Credit Research<br />
P&L (NOK m) Q4 09 Q1 10 Q2 10 Q3 10 Q4 10<br />
Net interest income 5,606 5,561 5,744 5,978 6,153<br />
Fees and commissions 1,616 1,628 1,723 1,780 1,909<br />
Net result from financial transactions & trading 1,066 1,298 1,754 225 1,684<br />
Pre-provision income (PPI) 4,495 4,877 4,704 4,713 6,022<br />
Loan losses -1,517 -947 -878 -643 -529<br />
Net profit 2,122 3,115 3,266 3,085 5,346<br />
Lending to general public 1,114,886 1,125,946 1,154,491 1,152,001 1,170,341<br />
Net interest margin 1.4% 1.3% 1.3% 1.4% 1.5%<br />
Recurring earning power (1) 1.7% 1.9% 1.7% 1.7% 2.3%<br />
Cost/income 49.0% 45.8% 50.0% 48.7% 43.4%<br />
Problem loans/Total loans 2.4% 2.7% 2.7% 2.6% 2.4%<br />
Loss ratio (% ann.) 0.5% 0.3% 0.3% 0.2% 0.2%<br />
Leverage ratio (core capital/total assets) 5.4% 5.3% 5.0% 5.3% 5.6%<br />
Core capital ratio (Tier 1) 9.3% 9.3% 9.0% 9.2% 10.1%<br />
Total capital ratio (Tier 1 + Tier 2) 12.1% 12.1% 11.6% 11.7% 12.4%<br />
Source: Company data and <strong>Danske</strong> Fixed Income Credit Research<br />
9 | 13 April 2011<br />
www.danskeresearch.com
<strong>Scandi</strong> Handbook<br />
FIH<br />
Company overview<br />
FIH Erhvervsbank (FIH), established in 1958, is a Danish wholesale niche bank<br />
specialising in long-term financing for both small and medium-sized enterprises and<br />
large corporations. FIH has a share of around 10% of the market for lending to domestic<br />
non-financial companies. At the end of 2010, FIH was the sixth-largest bank<br />
in Denmark, measured by its total assets of DKK109bn. Following a strategic decision<br />
at the beginning of 2011 to reduce risk (a back to old virtues approach) meant<br />
that FIH has quit Private Equity and Property finance will be downscaled. FIH’s<br />
operations are organised into three main business areas: <strong>Bank</strong>ing (Corporate <strong>Bank</strong>ing,<br />
and Acquisition Finance, Capital Markets, and Corporate Finance (investment<br />
banking activities in FIH Partners A/S). FIH’s core customers (SMEs with assets of<br />
more than DKK10m) are served through the Copenhagen head office and the four<br />
regional branches located in the main industrial areas of Denmark (Frederica, Herning,<br />
Aarhus and Aalborg).<br />
FIH was acquired by Kaupthing <strong>Bank</strong> in 2004, but after the collapse of Kaupthing<br />
the shares of FIH were pledged by the Icelandic government. In September 2010,<br />
FIH announced that a consortium of ATP (49.95%), PFA (19.98%), Folksam<br />
(19.98%) and CPDyvig (9.99%) had acquired the bank. The purchase was completed<br />
in January 2011.<br />
Key credit considerations<br />
Ownership puzzle resolved<br />
After the collapse of Kaupthing <strong>Bank</strong> in 2008, FIH had been in an ownership vacuum,<br />
but this has now been resolved. The ownership consortium consists of the largest<br />
Danish pension fund ATP (government owned), the Danish pension fund PFA,<br />
the Swedish pension fund Folksam (mutual company, among the biggest market<br />
players in Sweden) and private equity investment from CPDyvig.<br />
We regard the new owners as a credit-positive due to their financial strength and<br />
ability to deliver liquidity and capital support if needed.<br />
Rating<br />
In September 2010, Moody’s upgraded the stand-alone rating of FIH one notch to D<br />
(Ba2 equivalent) due to the change of ownership. At the same time Moody’s reduced<br />
the uplift due to systemic support to 2 notches resulting in the same long-term rating<br />
of Baa3.<br />
Following the collapse of Amagerbanken and the resulting hair cuts on senior unsecured<br />
debt, Moody’s changed its stance on Denmark from being a high-support country<br />
to being a low-support country. Consequently, government support was removed<br />
from all but the four largest banks. The expected funding pressure has made Moody’s<br />
put all Danish banks’ stand-alone ratings on negative outlook (also spurred by very<br />
modest macroeconomic recovery in Denmark).<br />
HOLD<br />
Sector: Financials, <strong>Bank</strong>s<br />
Corporate ticker: FINDAN<br />
Equity ticker: Not listed<br />
Market cap: n.a.<br />
Ratings:<br />
S&P rating: NR<br />
Moodys rating: (D) Ba1/<br />
NW<br />
Fitch rating: NR<br />
Analysts:<br />
Thomas Hovard<br />
thomas.hovard@danskebank.dk<br />
+45 4512 8505<br />
Henrik Arnt<br />
henrik.arnt@danskebank.dk<br />
+45 4512 8504<br />
Key credit issues<br />
Strengths:<br />
• Financially strong new owners<br />
• Strong short-term liquidity<br />
• Leading position in SME lending<br />
• Sound capitalisation<br />
Challenges:<br />
• High wholesale funding dependency<br />
• Very high refinancing risk of govie<br />
guaranteed debt<br />
• Asset quality deterioration<br />
• Industry concentration<br />
Source: <strong>Danske</strong> Markets<br />
Currently, the long-term rating of FIH has a one notch uplift due to the new ownership,<br />
but with a negative watch as Moody’s is awaiting the outcome of a proposal<br />
allowing government-owned ATP to be majority owner of a bank. Late March the<br />
government proposal was ready for parliament (not legislation yet) with a majority<br />
backing it. In light of the proposal, we expect more upward than downward pressure<br />
going forward. The likelihood of attracting funding has increased significantly on the<br />
back of the change in the existing law.<br />
10 | 13 April 2011<br />
www.danskeresearch.com
<strong>Scandi</strong> Handbook<br />
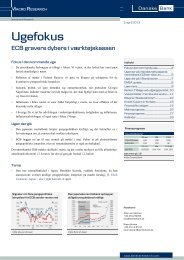
Asset quality<br />
Historically, FIH has a strong track record in managing its loan portfolio through<br />
economic cycles, and available levels of specific collateral act as a further cushion<br />
against any expected or unexpected credit losses. However, the financial crisis has<br />
also caused a significant deterioration in the asset quality of FIH.<br />
Loan losses almost doubled in 2010 to DKK1.7bn, corresponding to 285bp of the<br />
loan book, somewhat higher than its Danish peers. The bulk of the loan losses were<br />
taken in Q4 in which provisioning exploded to DKK1.2bn (mainly due to writedowns<br />
of collateral and increased collective provisioning) compared to DKK169m in Q4 09<br />
and DKK237m in Q3 10. Actually the loan loss provision in Q4 was higher than the<br />
booked provision for the entire troublesome 2009 corresponding to 8.2% of the loan<br />
book (annualised).<br />
The level of gross non-performing loans increased to DKK6.4bn from DKK4.5bn the<br />
year before and amounted to 11% of the loan book. Coverage (provisioning rate nonperforming<br />
loans) stood at 41%. No doubt that the new owners and the new co-CEO<br />
(former head of investments in ATP) are cleaning up the balance sheet and getting<br />
ready for a new start, but the increased levels of provisions and problem loans are<br />
also fuelled by lower assessed values of the collateral and do raise some concerns.<br />
Loan loss ratio (ann.)<br />
9,0%<br />
8,0%<br />
7,0%<br />
6,0%<br />
5,0%<br />
4,0%<br />
3,0%<br />
2,0%<br />
1,0%<br />
0,0%<br />
Q2 08 Q4 08 Q2 09 Q4 09 Q2 10 Q4 10<br />
Source: <strong>Danske</strong> Markets<br />
In the banking division, FIH has a target of maximum property finance exposure of<br />
30%. Currently, the largest sector exposure in the loan book is to real estate management<br />
with 32% of the corporate loans, highlighting meaningful industry concentration<br />
in the loan book. The real estate exposure is split into four sub-categories,<br />
with the largest part relating to first priority pledges on company property and operating<br />
equipment to companies outside the real estate sector. The real estate exposure is<br />
mainly split between Denmark and Germany and FIH has announced that the exposure<br />
will be reduced in 2011 and 2012.<br />
A mitigating factor is that, according to Moody’s, the real estate portfolio is fairly<br />
well diversified. Finally, it is worth noting that FIH has substantially reduced its large<br />
exposures to 66% of the capital at end-2010 (2008: 157%, 2009:71%).<br />
Liquidity and funding<br />
Only a very moderate part of FIH’s funding stems from depositors, and traditionally<br />
the bank depends on wholesale funding. We expect this to more or less continue in<br />
the (near) future, but in our view the new ownership consortium creates a strong<br />
funding backdrop (see above).<br />
Going forward, new owner ATP has initially granted FIH a committed credit facility<br />
of DKK10bn (not utilised end 2010), in addition to the DKK50bn governmentguaranteed<br />
frame.<br />
Loans and deposits Funding mix 2010<br />
80.000<br />
70.000<br />
60.000<br />
DKKm Loans Deposits Equity Deposits<br />
Sub debt 8%<br />
8%<br />
5%<br />
Revenue split 2010<br />
Financial<br />
income<br />
52%<br />
Source: <strong>Danske</strong> Markets<br />
Other<br />
income<br />
3%<br />
Net<br />
interest<br />
income<br />
39%<br />
Fees and<br />
commissi<br />
ons<br />
6%<br />
50.000<br />
40.000<br />
Interbank<br />
31%<br />
30.000<br />
20.000<br />
10.000<br />
-<br />
Q3 08 Q4 08 Q1 09 Q2 09 Q3 09 Q4 09 Q1 10 Q2 10 Q3 10 Q4 10<br />
Market<br />
funds<br />
48%<br />
Source: Company data, <strong>Danske</strong> Markets<br />
Source: Company data, <strong>Danske</strong> Markets<br />
11 | 13 April 2011<br />
www.danskeresearch.com
<strong>Scandi</strong> Handbook<br />
The short-term liquidity in FIH is sound, with an excess coverage of the requirement<br />
of 71.4% backed by a large holding of fixed income securities. The ATP facility is<br />
not included in current liquidity but provides additional liquidity back-up.<br />
Moreover, we believe that the consortium could provide funding by bilateral loans if<br />
FIH is not able to attract wholesale funding in the markets. To conclude, FIH’s funding<br />
situation remains the key risk but has improved materially with the new owners.<br />
Capitalisation<br />
In accordance with Danish <strong>Bank</strong> Package II, FIH was granted a hybrid loan of<br />
DKK1.9bn, which currently accounts for 2.5 percentage-points of RWA.<br />
The capitalization of FIH continues to improve as a combined result of positive income<br />
generation, lack of dividend payments and the reduction in risk-weighted assets<br />
(down 13% y/y). By the end of 2010, the Tier 1 ratio was 13.3%, up from 11.4% the<br />
previous year, while total capital increased to 15.4%, from 13.8%. Importantly, equity<br />
Tier-1 ratio (excluding hybrids) is high at 10.8% (up from 9.1%) and capitalization<br />
is sound at FIH, we believe (FIH’s individual solvency requirement, as set by the<br />
Danish FSA, was 9.9% and the bank is therefore well capitalized). Note that FIH did<br />
not call an outstanding Tier 2 issue in March last year, as the bank considered it did<br />
not have access to the bond markets for subordinated debt. FIH has some subordinated<br />
bonds with first call dates this year, which we don’t expect it will call.<br />
Current performance drivers<br />
Recent results Q4 10<br />
The operating result in Q4 was very weak and FIH numbers came in black only due<br />
to an extraordinary income of DKK881m (value adjustment of private equity stake in<br />
the Axcel III fund, due to the IPO of Pandora). Net interest income was down by<br />
44% q/q as the fees on government-guaranteed funding are now booked as interest<br />
expenses (furthermore volume is down 3% but margins on loans are higher). Fee<br />
income was a bit lower and trading income adjusted for the Pandora stake was close<br />
to zero (although an improvement q/q and y/y).<br />
Recommendation<br />
FIH remains reasonably well capitalised and short-term liquidity is abundant. The<br />
key risk is medium-term funding with DKK50bn of government-guaranteed funding<br />
expiring in 2012 and 2013.<br />
Going forward, a business model with a high reliance on wholesale funding will<br />
remain a challenge in the short to medium term but the new owners could act as a<br />
back-stop for funding. This could also increase the willingness from depositors to<br />
make deposits above the deposit guarantee of (equivalent to) EUR100,000 although<br />
short term this source of funding is likely to remain rather marginal for FIH.<br />
Capitalisation<br />
18%<br />
15%<br />
12%<br />
9%<br />
6%<br />
3%<br />
0%<br />
Source: <strong>Danske</strong> Markets<br />
Earnings and Efficiency<br />
60%<br />
50%<br />
40%<br />
30%<br />
20%<br />
10%<br />
0%<br />
Core capital ratio<br />
Total capital ratio<br />
Individual solvency requirement<br />
2005 2006 2007 2008 2009 2010<br />
2005 2006 2007 2008 2009 2010<br />
Recurring earnings power, RHS Cost/income<br />
Note: Adjusted for Pandora stake. Source: <strong>Danske</strong><br />
Markets<br />
Earning assets mix 2010<br />
Retail<br />
0%<br />
1,8%<br />
1,5%<br />
1,2%<br />
0,9%<br />
0,6%<br />
0,3%<br />
0,0%<br />
With the current funding gap, taking a stance on FIH bonds is taking a stance on the<br />
commitment of the new owners. We regard the new ownership consortium, primarily<br />
consisting of financially robust pension funds, as very positive for both senior and<br />
subordinated debt. We struggle to see a scenario in which the new owners would<br />
simply “throw in the towel” instead of granting further support to FIH if necessary.<br />
This is also the context the new ATP law (which allows ATP to take full ownership<br />
of FIH. Note that the law has not been passed yet) must be seen in.<br />
That said we still need to see the first signs of non-government related funding and<br />
we need to see asset quality improvements in 2011. Thus we keep our overall HOLD<br />
recommendation but highlight that for very risk tolerant investors, FIH could be an<br />
interesting opportunity. (See list of outstanding instrument prices at the end of this<br />
book).<br />
Securities<br />
36%<br />
Due from<br />
banks<br />
4%<br />
Source: <strong>Danske</strong> Markets<br />
Corporate<br />
60%<br />
12 | 13 April 2011<br />
www.danskeresearch.com
<strong>Scandi</strong> Handbook<br />
Financial data FIH<br />
P&L (DKKm) 2006 2007 2008 2009 2010<br />
Net interest income 1,002 1,119 1,286 1,300 1,203<br />
Fees and commissions 96 257 213 134 190<br />
Net result from financial transactions 508 510 -53 511 1,639<br />
Other income 95 95 107 110 84<br />
Total revenue 1,701 1,981 1,552 2,055 3,116<br />
Personnel costs 308 476 459 440 409<br />
Other costs 190 228 270 226 199<br />
Depreciation and amortization 42 38 59 30 26<br />
Total costs 540 741 787 696 633<br />
Pre-provision income (PPI) 1,161 1,239 765 1,359 2,483<br />
Loan losses and provisions -17 -19 449 969 1,741<br />
Operating profit (core earnings) 1,178 1,259 316 391 742<br />
Non-recurring items 0 17 -108 -538 -426<br />
Pre-tax income 1,178 1,276 207 -148 316<br />
Tax 243 153 24 -159 -208<br />
Net income 935 1,123 184 11 525<br />
Adjusted net income 935 1,123 310 540 950<br />
Balance sheet (DKKm) 2006 2007 2008 2009 2010<br />
Due from central banks and credit institutions 6,660 5,013 5,694 3,805 3,726<br />
Lending to general public 67,579 75,015 72,615 64,134 57,994<br />
Securities 13,117 14,582 30,546 53,128 34,699<br />
Earning assets 87,356 94,611 108,855 121,066 96,418<br />
Other assets 8,642 18,746 13,270 9,290 12,920<br />
Total assets 95,998 113,357 122,125 130,356 109,338<br />
Deposits from the general public 6,597 10,533 32,091 20,709 7,487<br />
Issued securities incl. covered bonds 55,704 53,632 32,681 49,197 46,915<br />
Subordinated debt ex hybrid 1,582 3,011 3,027 2,385 2,566<br />
Hybrid securities (Tier 1) 0 0 0 1,914 1,900<br />
Equity 6,695 7,750 7,809 7,820 8,334<br />
Risk weighted assets (RWA) 80,930 91,626 87,947 87,819 76,532<br />
Key ratios 2006 2007 2008 2009 2010<br />
Net interest margin 1.2% 1.2% 1.3% 1.1% 1.1%<br />
Recurring earnings power (1) 1.6% 1.4% 0.9% 1.5% 3.0%<br />
Return on average assets (before tax) 1.1% 1.1% 0.2% 0.0% 0.4%<br />
Return on average equity before tax 18.9% 17.7% 2.7% -1.9% 3.9%<br />
Return on average equity after tax 15.0% 15.6% 2.4% 0.1% 6.5%<br />
Cost/income 31.7% 37.4% 50.7% 33.9% 20.3%<br />
Problem loans/Total loans 0.2% 0.3% 1.7% 7.0% 11.0%<br />
Loan loss provisions / Total loans 0.0% 0.0% 0.6% 1.5% 3.0%<br />
Loan loss reserves/Problem loans 296.6% 97.8% 44.7% 26.4% 41.1%<br />
Loan loss reserves/Pre-provision income 26.2% 17.9% 70.4% 87.1% 105.2%<br />
Avg. customer deposits/avg. total funding 6.5% 9.5% 21.0% 24.7% 14.2%<br />
Market funds/total funding 84.8% 82.9% 64.3% 75.6% 83.8%<br />
Avg. gross loans/avg. customer deposits 1254.4% 832.4% 346.4% 259.0% 433.1%<br />
Lending growth 16.9% 11.0% -3.2% -11.7% -9.6%<br />
Payout ratio 0.0% 0.0% 0.0% 0.0% 0.0%<br />
Core capital ratio incl hybrid 8.2% 8.4% 8.8% 11.4% 13.3%<br />
Core capital ratio ex hybrid 8.2% 8.4% 8.8% 9.2% 11.3%<br />
Total capital ratio 9.9% 11.5% 11.9% 13.8% 15.4%<br />
Source: Company data, <strong>Danske</strong> Fixed Income Credit Research<br />
P&L (DKK m) Q4 09 Q1 10 Q2 10 Q3 10 Q4 10<br />
Net interest income 317 341 356 324 182<br />
Fees and commissions 52 23 59 60 48<br />
Net result from financial transactions & trading -127 306 122 -88 5<br />
Pre-provision income (PPI) 116 538 311 165 94<br />
Loan losses -169 -111 -189 -237 -1,205<br />
Net profit 178 201 21 199 23<br />
Lending to general public 64,134 62,840 61,115 59,801 57,994<br />
Net interest margin (ann.) 1.1% 1.1% 1.2% 1.3% 0.8%<br />
Recurring earning power (ann.) 0.5% 2.5% 1.5% 0.8% 0.5%<br />
Cost/income 57.4% 22.1% 44.8% 47.8% 62.7%<br />
Problem loans/Total loans 7.0% 7.7% 9.4% 9.7% 11.0%<br />
Loan loss ratio (% ann.) 1.0% 0.7% 1.2% 1.6% 8.2%<br />
Leverage ratio (core capital/total assets) 7.7% 7.7% 8.0% 9.2% 9.3%<br />
Core capital ratio (Tier 1) 11.4% 12.1% 12.5% 12.9% 13.3%<br />
Total capital ratio (Tier 1 + Tier 2) 13.8% 14.4% 15.0% 15.2% 15.4%<br />
Source: Company data, <strong>Danske</strong> Fixed Income Credit Research<br />
13 | 13 April 2011<br />
www.danskeresearch.com
<strong>Scandi</strong> Handbook<br />
Handelsbanken<br />
Company overview<br />
Established in 1871, Svenska Handelsbanken (Handelsbanken) provides a full range<br />
of retail, commercial and investment banking services through its extensive branch<br />
network in Sweden, other Nordic countries and the UK. Based on total assets, Handelsbanken<br />
is the third-largest Swedish after Nordea and SEB. The bank offers universal<br />
banking in all of the Nordic countries (Sweden, Norway, Denmark and<br />
Finland). The operations outside Sweden continue to grow in importance and now<br />
account for around a third of the loan book. Going forward, Handelsbanken has identified<br />
scope for growth in the UK and therefore aims to further build up its presence<br />
there by growing organically. Currently, the UK operations account for 4% of total<br />
lending. In total, Handelsbanken has 720 branches in more than 20 countries. It has a<br />
distinct culture with no centralised marketing and no budgets, for example. Instead, it<br />
uses internal and external benchmarking extensively. Handelsbanken’s goal is to<br />
have higher profitability than its competitors through having more satisfied customers<br />
and lower costs (including loan losses). This goal has been achieved for 39 consecutive<br />
years.<br />
Handelsbanken has a domestic market share above 25% in mortgage lending<br />
(through Stadshypotek AB, which was acquired in 1996) and corporate lending. In<br />
2007, the bank sold its sizeable life insurance operations (SPP) to Storebrand, which<br />
leaves Handelsbanken Liv as the only life insurance arm of the group. The bank has a<br />
market share of around 20% of total household lending and deposits in Sweden. The<br />
main aim is to grow organically in its home markets and the UK, although bolt-on<br />
acquisitions are also made. The two largest shareholders are the bank’s own profitsharing<br />
foundation, the Oktogonen Foundation, and Industrivärden (both with 10%<br />
of the shares).<br />
Key credit considerations<br />
Strong track record and high efficiency<br />
Handelsbanken is known for being one of the most efficient and conservative banks<br />
in Europe, operating its franchise on a lean cost base despite ongoing investments in<br />
an expansion strategy outside Sweden. In 2010, Handelsbanken had a cost-income<br />
ratio of 48% (2009: 47%). From a credit viewpoint, a low cost-income ratio provides<br />
Handelsbanken with greater flexibility in more difficult times and helps it to cope<br />
with competitive pressures. Of the four large Swedish banks, Handelsbanken handled<br />
the early-1990s crisis the best by not needing public support, reflecting its conservative<br />
and prudent approach. In the current crisis, Handelsbanken has once again<br />
proved its defensive qualities, proving resilient to the downturn compared with its<br />
peers.<br />
SELL<br />
Sector: Financials<br />
Corporate ticker: SHBASS<br />
Equity ticker: SHBA SS<br />
Market cap: SEK136bn<br />
Ratings:<br />
S&P rating: Aa2 (stable)<br />
Moodys rating: AA- (stable)<br />
Fitch rating: AA- (stable)<br />
Analysts:<br />
Henrik Arnt<br />
henrik.arnt@danskebank.dk<br />
+45 4512 8504<br />
Thomas Hovard<br />
thomas.hovard@danskebank.dk<br />
+45 4512 8505<br />
Key credit issues<br />
Strengths<br />
• Strong track record<br />
• High efficiency<br />
• Low cyclicality<br />
Challenges<br />
• Swedish economy sensitive to<br />
higher interest rates<br />
• High exposure to real estate market<br />
Source: <strong>Danske</strong> Markets<br />
Swedish economy is among Europes strongest<br />
The domestic economic development is central to the prospects for Handelsbanken as<br />
most of the company’s’ activities are in Sweden (68% of the loan book). The domestic<br />
Swedish economy fared relatively well throughout the financial crisis and a strong<br />
recovery has taken place recently. The most recent GDP numbers showed that in the<br />
fourth quarter of 2010 the Swedish economy grew by 7.3% y/y. The macroeconomic<br />
backdrop is therefore highly supportive for the banking system.<br />
During the recent crisis the central bank aggressively lowered its target rate. As the<br />
bulk of Swedish mortgages are tied to the short-term rate (1M or 3M STIBOR), this<br />
corresponded to an expansionary economic policy to the benefit of the domestic<br />
economy and house prices in particular. We believe that this stimulus via the steep<br />
14 | 13 April 2011<br />
www.danskeresearch.com
<strong>Scandi</strong> Handbook<br />
decline in short-term interest rates is a key explanation for the low Swedish loan<br />
losses in the past few years.<br />
Naturally, the transmission also works the other way i.e. when rates go up this is felt<br />
with immediate effect and the Riksbank started hiking its policy rate in September.<br />
So far, the level remains low and by the end of the year the repo rate is expected by<br />
our macro team to be 2.75%, by no means at an alarming level. In fact, a modest<br />
increase in the policy rate is probably net positive for the banks, as it allows them to<br />
increase deposit margins without really jeopardising asset quality. In the short to<br />
medium term, we therefore fail to see any major negative credit triggers. Our main<br />
concern would be if we see inflationary signs in Sweden, as this could result in a<br />
more aggressive hiking path from the Riksbank.<br />
Capitalisation<br />
Handelsbanken reported a full Basel II Tier 1 ratio of 16.5% at the of the year (up<br />
from 14.2% a year earlier), while under the transition rules the Tier 1 ratio was 9.2%.<br />
In our view, the big difference between transition ratios and full Basel II ratios is a<br />
reflection of the low risk of the loan book and the strict focus on, for example, collateral<br />
management. Overall, Handelsbanken is well capitalised. Handelsbanken has<br />
communicate that, according to its internal calculation, the impact of Basel III on<br />
capital ratios is expected to be minus 1.5 percentage points.<br />
Asset quality<br />
Asset quality remains strong, although problem loans increased slightly from the<br />
previous quarter to 0.62% of total loans. Loan losses in the fourth quarter remained at<br />
the same level as the previous quarter, corresponding to 8bp of total lending.<br />
The level of non-performing loans at Handelsbanken has been at a consistently low<br />
level for many years and currently stands at 0.6% of total lending. Handelsbanken<br />
maintains a high degree of collateralised loans, most of them against real estate. The<br />
largest sector exposure is to the <strong>Scandi</strong>navian real estate market (predominantly<br />
Sweden). Within corporate lending, the largest exposure is to real estate management<br />
and housing associations (58% of the corporate loan book at end-2010). This is a<br />
very high exposure but the predominant proportion of this lending is to governmentowned<br />
property companies, municipal housing companies, housing co-operatives and<br />
other housing-related operations, where borrowers have high creditworthiness. Furthermore,<br />
21% of it is based on mortgage loans through Stadshypotek.<br />
Loan losses in the Danish business were higher than total loan losses for the group –<br />
i.e. excluding Denmark there was a net reversal of provisions. In our view, the losses<br />
in Denmark are likely to be a legacy of the 2008 takeover of the Danish regional<br />
bank, Lokalbanken, and for some time we had been puzzled about the low level of<br />
losses that Handelsbanken has reported in Denmark. We would not be surprised if<br />
reported loan losses from Denmark stay elevated in the coming quarters.<br />
Liquidity and funding<br />
Deposits account for 29% of total funding, while more than half of the funding is<br />
obtained through the debt market. The reason for this relatively high wholesale funding<br />
dependence is the financing of mortgage bonds. The other major source of funding<br />
is issuance of AAA-rated covered bonds through Stadshypotek, which are issued<br />
to finance mortgage lending. Handelsbanken has available liquidity of SEK177bn<br />
and it still has plenty of room for issuing covered bonds (more than SEK320bn).<br />
Going forward, we expect Handelsbanken to continue to use this headroom mainly<br />
for covered bond issuance, rather than turning to senior unsecured market.<br />
Capitalisation (transition rules)<br />
15%<br />
12%<br />
9%<br />
6%<br />
3%<br />
0%<br />
Source: Company data, <strong>Danske</strong> Markets<br />
Loss ratio (% annualised)<br />
0.3%<br />
0.2%<br />
0.1%<br />
0.0%<br />
2006 2007 2008 2009 2010<br />
Core capital ratio<br />
Source: Company data, <strong>Danske</strong> Markets<br />
Funding mix, 2010<br />
Total capital ratio<br />
Q1 09 Q3 09 Q1 10 Q3 10<br />
Market<br />
funds<br />
50%<br />
Sub debt Equity<br />
2% 5%<br />
Retail<br />
deposits<br />
12%<br />
Source: Company data, <strong>Danske</strong> Markets<br />
Corporate<br />
deposits<br />
17%<br />
Interbank<br />
14%<br />
Throughout the crisis, Handelsbanken has been a frequent issuer and we consider the<br />
investor appetite for the name to be good. Combined with a low appetite for market<br />
risk, we view Handelsbanken’s funding as strong.<br />
15 | 13 April 2011<br />
www.danskeresearch.com
<strong>Scandi</strong> Handbook<br />
Current performance drivers<br />
Q4 10 earnings report<br />
Net income came in at SEK2.9bn, slightly above consensus expectations of<br />
SEK2.8bn. This was also the case in Sweden: in Q4 2010, net interest income was a<br />
little better than expected on the back of improving deposit margins. Furthermore,<br />
the loan volume was slightly up from the previous quarter. Net commission income<br />
increased to its highest level ever at SEK 2.1bn, due in particular to an increase in<br />
fees relating to the equity market.<br />
Bolt-on acquisitions a possibility<br />
In September 2008, Handelsbanken made an offer to acquire the small Danish local<br />
bank, Lokalbanken, located North of Copenhagen. Following the acquisition, Handelsbanken<br />
has more than 50 branches in Denmark. We would not be surprised if<br />
Handelsbanken were to decide to pursue more acquisitions in the Nordic region. We<br />
believe that these would likely be bolt-on acquisitions rather than larger-scale.<br />
Revenue split, 2010<br />
Fees and<br />
comm.<br />
26%<br />
Financial<br />
income<br />
4%<br />
Other<br />
income<br />
2%<br />
Net<br />
interest<br />
income<br />
68%<br />
Source: Company data and <strong>Danske</strong> Markets<br />
Hawkish Swedish regulators is supportive for credit quality<br />
In March, the Swedish regulators as well as the Minister of Finance, communicated a<br />
rather hawkish stance on bank regulation. Sweden should move ahead of Basel III<br />
and regulatory core capital levels should increase by 1% annually in the next few<br />
years, thereby restricting the possibility for banks to pay large dividends. A core Tier<br />
1 level of 10% and a total capital ratio of 15% will be the target levels for regulation<br />
in Sweden. This is significantly above the Basel III minimum requirements.<br />
Earning assets mix 2010<br />
Due from<br />
banks<br />
9%<br />
Securities<br />
9%<br />
Retail<br />
37%<br />
Furthermore, the central bank talked about higher risk weightings on Swedish mortgages,<br />
as this would be an effective way of curbing the high growth in mortgage<br />
lending that is currently taking place in Sweden. However, the Swedish FSA has<br />
communicated that they are not in favour of an increase in risk weights. Instead they<br />
prefer more rigorous stress testing as well as additional capital requirements through<br />
Pillar 2 (under Basel II).<br />
Overall, Swedish banks will face a need to act rather conservatively in the next few<br />
years in order to further build up or protect capital levels. This is positive from a<br />
credit perspective. We also note the regulatory focus on the housing market. Last<br />
year, the LTV requirements for Swedish mortgages were lowered and now the regulators<br />
want to increase the risk weighting. To us, this is a positive development as it<br />
reduces the risk of Sweden building up a housing bubble similar to what we saw in<br />
Denmark, for example.<br />
Recommendation<br />
Handelsbanken is a defensive play and, despite the hiccup in its Danish business,<br />
asset quality remains strong, as does the capital position. The strong fundamentals<br />
are reflected in pricing and Handelsbanken trades tighter than its peers in both cash<br />
and CDS. For pure valuation reasons, we therefore have a SELL recommendation on<br />
the name. We would hold the subordinated Tier 1 bond with call in 2015 (it does not<br />
have a regulatory par call), as it is likely to remain well bid among retail investors.<br />
See a list of instrument prices at the end of this book.<br />
Source: Company data, <strong>Danske</strong> Markets<br />
Efficiency and earnings<br />
60%<br />
40%<br />
20%<br />
0%<br />
Corporate<br />
45%<br />
2006 2007 2008 2009 2010<br />
Cost/income<br />
Recurring earnings power, RHS<br />
Source: Company reports, <strong>Danske</strong> Markets<br />
3.0%<br />
2.6%<br />
2.2%<br />
1.8%<br />
1.4%<br />
1.0%<br />
16 | 13 April 2011<br />
www.danskeresearch.com
<strong>Scandi</strong> Handbook<br />
Financial data Handelsbanken<br />
P&L (SEKm) 2006 2007 2008 2009 2010<br />
Net interest income 14,727 15,608 19,223 22,000 21,337<br />
Fees and commissions 7,316 7,745 6,795 7,393 8,022<br />
Net result from fin. transactions 3,448 3,054 3,169 2,457 1,377<br />
Other income 767 616 703 459 549<br />
Total revenue 26,258 27,023 29,890 32,309 31,285<br />
Personnel costs 7,184 7,528 8,114 10,018 9,504<br />
Other costs 3,955 4,487 5,115 4,719 5,062<br />
Depreciation and amortisation 366 353 0 483 452<br />
Total costs 11,505 12,368 13,229 15,220 15,018<br />
Pre-provision income (PPI) 14,753 14,655 16,661 17,089 16,267<br />
Loan losses and provisions -55 27 1,605 3,392 1,507<br />
Operating profit (core earnings) 14,808 14,628 15,056 13,697 14,760<br />
Non-recurring items 2,290 4,758 457 66 10<br />
Pre-tax income 17,098 19,386 15,513 13,763 14,770<br />
Tax 3,970 3,879 3,382 3,519 3,962<br />
Net income 13,128 15,507 12,131 10,244 10,808<br />
Adjusted net income 10,927 10,276 7,975 10,204 10,809<br />
Balance sheet (SEKm) 2006 2007 2008 2009 2010<br />
Due from cent banks & credit instns. 177,175 185,149 316,656 323,138 263,100<br />
Lending to general public 1,100,538 1,292,988 1,481,475 1,477,183 1,481,678<br />
Securities 266,743 175,982 97,270 95,729 157,448<br />
Earning assets 1,544,456 1,654,119 1,895,401 1,896,050 1,902,226<br />
Other assets 245,552 205,263 263,383 226,793 251,304<br />
Total assets 1,790,008 1,859,382 2,158,784 2,122,843 2,153,530<br />
Deposits from the general public 533,885 512,841 543,760 549,748 546,173<br />
Issued securities incl. cov. bonds 595,001 706,478 895,709 966,075 963,501<br />
Subordinated debt ex hybrid 46,314 46,078 49,855 44,160 29,749<br />
Hybrid securities (Tier 1) 5,358 6,831 11,579 14,845 14,199<br />
Equity 66,226 74,491 74,963 83,088 88,391<br />
Risk weighted assets (RWA) 876,178 1,069,290 1,083,629 940,385 954,304<br />
Key ratios 2006 2007 2008 2009 2010<br />
Net interest margin 1.0% 1.0% 1.1% 1.3% 1.2%<br />
Recurring earnings power (1) 1.8% 1.5% 1.5% 1.7% 1.7%<br />
Return on ave. assets (before tax) 0.8% 0.8% 0.6% 0.5% 0.5%<br />
Return on average equity before tax 25.9% 27.6% 20.8% 17.4% 17.2%<br />
Return on average equity after tax 19.9% 22.0% 16.2% 13.0% 12.6%<br />
Cost/income 43.8% 45.8% 44.3% 47.1% 48.0%<br />
Problem loans/Total loans 0.3% 0.2% 0.4% 0.6% 0.6%<br />
Loan loss provisions/Total loans 0.0% 0.0% 0.1% 0.2% 0.1%<br />
Loan loss reserves/Problem loans 69.5% 75.0% 51.1% 62.4% 60.7%<br />
Loan loss reserves/Pre-prov. income 13.5% 12.7% 16.5% 31.5% 34.4%<br />
Avg. cust. deposits/avg. tot. funding 34.5% 34.1% 31.2% 30.1% 30.1%<br />
Market funds/total funding 61.7% 64.2% 67.3% 66.7% 66.8%<br />
Avg. gross loans/avg. cust. deposits 221% 229% 263% 271% 270%<br />
Lending growth 11.9% 17.5% 14.6% -0.3% 0.3%<br />
Payout ratio 38.6% 54.3% 36.0% 48.7% 50.9%<br />
Core capital ratio incl. hybrid 6.8% 6.5% 7.0% 9.1% 9.2%<br />
Core capital ratio ex hybrid 6.2% 5.5% 5.9% 7.5% 7.7%<br />
Total capital ratio 9.5% 10.5% 10.7% 12.9% 11.6%<br />
Source: Company data, <strong>Danske</strong> Fixed Income Credit Research<br />
P&L (SEK m) Q4 09 Q1 10 Q2 10 Q3 10 Q4 10<br />
Net interest income 5,359 5,316 5,082 5,327 5,612<br />
Fees and commissions 1,995 1,983 1,988 1,924 2,127<br />
Net result from fin. trans. & trading 497 500 424 177 276<br />
Pre-provision income (PPI) 3,891 4,336 3,901 3,895 4,135<br />
Loan losses -691 -551 -369 -294 -293<br />
Net profit 2,516 2,853 2,573 2,707 2,892<br />
Lending to general public 1,477,183 1,467,686 1,484,406 1,469,109 1,481,678<br />
Net interest margin 1.2% 1.2% 1.1% 1.2% 1.2%<br />
Recurring earning power (1) 1.7% 1.8% 1.6% 1.6% 1.7%<br />
Cost/income 51.1% 45.8% 49.0% 48.1% 49.2%<br />
Problem loans/Total loans 0.6% 0.5% 0.6% 0.6% 0.6%<br />
Loan loss ratio(% ann.) 0.2% 0.1% 0.1% 0.1% 0.1%<br />
Leverage ratio (core capital/tot. assets) 4.0% 3.9% 3.7% 4.0% 4.1%<br />
Core capital ratio (Tier 1) 9.1% 9.1% 9.1% 9.2% 9.2%<br />
Total capital ratio (Tier 1 + Tier 2) 12.9% 12.2% 12.2% 12.2% 11.6%<br />
Source: Company data, <strong>Danske</strong> Fixed Income Credit Research<br />
17 | 13 April 2011<br />
www.danskeresearch.com
<strong>Scandi</strong> Handbook<br />
Jyske <strong>Bank</strong><br />
Company overview<br />
Jyske <strong>Bank</strong> is a full-service commercially oriented Danish bank with a nationwide<br />
Danish presence and a minor international presence. Measured by assets, Jyske is the<br />
third-largest bank in Denmark with a total lending market share of around 3-4% and<br />
5-6% of the domestic banking market. The bank’s historical base in Jutland was<br />
established in 1967 through the merger of four regional banks in the mid-Jutland<br />
area. Following the merger of three other smaller banks and the acquisition of Copenhagen-based<br />
Finansbanken in 1981, Jyske <strong>Bank</strong> achieved nationwide coverage.<br />
The group operates around 120 branches in Denmark and has around 500,000 Danish<br />
customers. Outside Denmark, Jyske <strong>Bank</strong> has full subsidiary banks in Switzerland<br />
and Gibraltar and branches in Hamburg and Cannes. In addition, Jyske has joint<br />
venture ownership in JN Data (IT services) with Nykredit, strategic ownership in<br />
Letpension (life & pensions) and <strong>Bank</strong>data (IT development), <strong>Bank</strong>Invest (7%) and<br />
60% ownership in the Dutch Berben (Asset Management). Mortgage lending is provided<br />
through a strategic partnership with Nykredit/Totalkredit/DLR while life insurance<br />
is offered in co-operation with PFA. These partnerships enable the bank to<br />
provide a full range of financial services.<br />
Key credit considerations<br />
Independent bank with organic growth strategy<br />
Jyske <strong>Bank</strong> is an autonomous, listed commercial bank incorporated in Denmark. The<br />
largest shareholder is Nykredit with 7% of the shares but without any control,<br />
whereas all other shareholders with the exception of Baillie Gifford & Co. Ltd<br />
(5.1%) have stakes of less than 5%. Jyske <strong>Bank</strong> is focused on remaining independent<br />
and aims to be the most customer-friendly full-service bank for households and<br />
SMEs in Denmark, emphasising organic growth. The bank has taken several steps in<br />
this direction. Very strict ownership rules, including voting restrictions, combined<br />
with a high proportion of shareholders with relatively low stakes protect the bank<br />
from hostile acquisitions and outside influence. In addition, in 2006, the bank completed<br />
a new strategic concept with which it created a new atmosphere for its banking<br />
activities. Customers are welcomed into modern, colourful branches with libraries<br />
and business magazines. The new advisory-focused concept offers customers a<br />
broader range of banking and near-banking products. The development of the concept,<br />
including the refurbishment of branches, has weighed on Jyske <strong>Bank</strong>’s costs –<br />
especially in 2006 but also since then.<br />
Asset quality<br />
The bank has a strong corporate lending profile (2010: 60% of lending), which<br />
mostly consists of SMEs operating in Denmark. Single-name exposures have been<br />
significantly reduced in recent years. By end-2010, the sum of the largest credit exposures<br />
was 32.5% of regulatory capital compared with 59% in 2008 and 27% in<br />
2009. The current level is below the Danish banking sector average – a factor we<br />
view as positive. Jyske’s lending portfolio is concentrated on Danish customers<br />
(above 90%) but is well diversified by industry, with the Finance and Insurance<br />
sector (23%) having the largest industry exposure. Lending to the real estate sector<br />
was 9% at end-2010.<br />
SELL<br />
Sector: Financials, banks<br />
Corporate ticker: JYBC<br />
Equity ticker: JYSK DC<br />
Market cap: DKK 16bn<br />
Ratings:<br />
S&P rating: A /N<br />
Moodys rating: A1 / NW<br />
Fitch rating: NR<br />
Analysts:<br />
Thomas Hovard<br />
thomas.hovard@danskebank.dk<br />
+45 4512 8505<br />
Henrik Arnt<br />
henrik.arnt@danskebank.dk<br />
+45 4512 8504<br />
Key credit issues<br />
Strengths:<br />
• Good liquidity<br />
• Strong capitalisation<br />
• Modest single-name exposure<br />
Challenges:<br />
• Asset quality deterioration in SME<br />
segment and agriculture<br />
• Efficiency<br />
Source: <strong>Danske</strong> Markets<br />
In contrast to Danish peers, loan losses decreased in Q4 with an annualised loan loss<br />
ratio of 100bp versus 115bp in Q3 and 344bp in Q4 09. Historically, Jyske <strong>Bank</strong> has<br />
reported significantly higher loan losses in Q4 and we therefore regard the decreasing<br />
Q4 provisioning as very positive. However, the share of loans in Jyske <strong>Bank</strong>’s problem<br />
loans (measured by lowest rating classes 12-14) increased markedly in Q3 and<br />
further in Q4.<br />
18 | 13 April 2011<br />
www.danskeresearch.com
<strong>Scandi</strong> Handbook<br />
Lending growth stabilising<br />
In 2006, lending growth was 17.1% and in 2007 it was nearing an unsustainable 25%<br />
(well above the sector average). However, in 2008, lending decreased by almost 4%<br />
and a further 14% in 2009 (mainly due to a drop in SME exposure but also smaller<br />
repos and private exposure). In 2010, lending stabilised (increased 3%).<br />
Market risk appetite<br />
At the end of 2010, the interest rate risk was 1.5% of core capital, down from 2% in<br />
2009, which we regard as a comfortable level. Jyske <strong>Bank</strong> has only a very limited<br />
amount of currency risk. On the other hand, the amount of listed and non-listed trading<br />
assets, including shares and sector holdings, has traditionally been higher than the<br />
sector average at Jyske.<br />
Profitability and earnings<br />
Jyske has made substantial strategic investments (IT, buildings, Jyske Differences<br />
2nd Generation and risk management systems) in recent years on the back of favourable<br />
market conditions, resulting in historically high cost/income ratios. In 2009, the<br />
cost/income ratio was in line with peers at around 48%, but in 2010, the bank passed<br />
the 50% mark again. Recently, Jyske <strong>Bank</strong> joined <strong>Bank</strong>data (IT services), which will<br />
lead to cost savings as the cost burden of <strong>Bank</strong>data is shared among more members.<br />
Previously Jyske had its own IT platform.<br />
Profitability measured as the net interest margin has been lingering around 2.5% in<br />
recent quarters. We are of the view that this is satisfactory in the current low interest<br />
rate environment.<br />
Liquidity and funding<br />
Jyske <strong>Bank</strong>’s funding base is sound and well diversified with around 51% deposits,<br />
17% from interbank markets and 23% from market funds. Jyske <strong>Bank</strong> has an EMTN<br />
programme and a French CP in place and a revolving credit facility with a group of<br />
international banks, signalling a diversity of funding sources. The next maturity of<br />
subordinated bonds is with the call in 2011 (EUR25m) and the call in 2013<br />
(EUR150m) and we expect the bank to make the call at the first-call date.<br />
Loan loss ratio (ann.)<br />
4,0%<br />
3,5%<br />
3,0%<br />
2,5%<br />
2,0%<br />
1,5%<br />
1,0%<br />
0,5%<br />
0,0%<br />
Source: <strong>Danske</strong> Markets<br />
Earnings and Efficiency<br />
70%<br />
65%<br />
60%<br />
55%<br />
50%<br />
45%<br />
40%<br />
35%<br />
30%<br />
25%<br />
20%<br />
Q1 08 Q3 08 Q1 09 Q3 09 Q1 10 Q3 10<br />
2004 2005 2006 2007 2008 2009 2010<br />
Recurring earnings power, RHS Cost/income<br />
Source: <strong>Danske</strong> Markets<br />
3,9%<br />
3,6%<br />
3,3%<br />
3,0%<br />
2,7%<br />
2,4%<br />
2,1%<br />
1,8%<br />
1,5%<br />
1,2%<br />
0,9%<br />
0,6%<br />
0,3%<br />
0,0%<br />
Excess coverage of the minimum regulatory requirement was 180% at end-2010 and<br />
Jyske stated that it has more than complied with Moody’s 12-month liquidity stress<br />
test and the liquidity reserve was stated to increase to DKK59bn. Jyske <strong>Bank</strong> had the<br />
opportunity to issue under the Danish bank package II scheme for state-guaranteed<br />
senior unsecured funding but chose not to, thereby sending a strong signal to the<br />
market (the scheme has now expired).<br />
The collapse of small Danish bank Amagerbanken and the willingness for Danish<br />
authorities through bank package 3 to impose haircuts on senior unsecured funding<br />
has put some stress on the funding situation for Danish banks. We regard Jyske <strong>Bank</strong><br />
as strong and large enough to be able to continue to attract foreign funding going<br />
forward (though probably to a higher price currently) in line with 2010, in which the<br />
bank issued several private placements under the EMTN programme.<br />
Overall, we view Jyske <strong>Bank</strong>’s funding and liquidity risk policies as satisfactory and<br />
prudent, thus benefiting the overall credit quality.<br />
Capitalisation<br />
Jyske’s individual solvency requirement was repeated at 9.4%. In Q4, the Tier 1 ratio<br />
increased to 14.1% and capitalisation is currently strong (Jyske didn’t propose dividends<br />
for 2010). Management stated that with the current level of equity Tier-1 capital<br />
(12.5% in Q4) and liquidity backdrop, it expects Jyske to comply with new capitalisation<br />
and liquidity regulation in the future (Basel III).<br />
Note that Jyske <strong>Bank</strong> has not utilised the option in Danish bank package 2 to obtain<br />
hybrid capital from the state or to issue 3Y funding with government guarantee.<br />
Funding mix end 2010<br />
Market<br />
funds<br />
23%<br />
Sub debt<br />
2%<br />
Interbank<br />
17%<br />
Equity<br />
7%<br />
Source: <strong>Danske</strong> Markets<br />
Deposits<br />
51%<br />
19 | 13 April 2011<br />
www.danskeresearch.com
<strong>Scandi</strong> Handbook<br />
Recently, the CEO of Jyske <strong>Bank</strong>, Anders Dam, stated that the bank aims at complying<br />
with the harsher Swedish rules of capitalisation in the absence of new capitalisation<br />
requirements from the Danish authorities (they seem to wait for Basel III).<br />
Current performance drivers<br />
Recent results Q4 10<br />
Net interest income was somewhat below last year (though in line with consensus)<br />
despite a bigger loan book due to low interest rates and increased competition. Jyske<br />
states that the bank benefits from a significant inflow of customers, but this is mainly<br />
in repo transactions (loan book up 4% q/q but adjusted for repos is up 1.5% q/q)<br />
Customer deposits were unchanged despite the expiration of bank package 1 but we<br />
expect Jyske and other large Danish banks to benefit from the recent failure of Amagerbanken<br />
incurring senior debt holders (including depositors) with a haircut. As we<br />
have seen in many Danish banks, trading income was a bit disappointing in Q4.<br />
Rating changes on Jyske <strong>Bank</strong> (A1/A/NR)<br />
S&P downgraded Jyske one notch to A in February 2009, referring to a heightened<br />
risk of asset quality deteriorations on the back of the gloomy Danish economy. Since<br />
then the rating has been on negative outlook.<br />
In March 2009, the subordinated debt of Danish banks was downgraded two notches<br />
by Moody’s due to lack of government support for these instruments. In September<br />
2010, subordinated debt was downgraded another notch to A3 in line with the downgrade<br />
in Jyske’s standalone rating (BFSR) to C+ from B-, again due to weakening<br />
asset quality. In February 2010, Moody’s downgraded Danish hybrid securities by<br />
one notch as the rating agency finalised its revision of guidelines for rating banksubordinated<br />
debt.<br />
Following the collapse of Amagerbanken and the resulting haircuts on senior unsecured<br />
debt, Moody’s changed its stance on Denmark from being a high-support country<br />
to being a low-support one. Consequently, government support in February 2011<br />
was removed from all but the four largest banks. The expected funding pressure has<br />
made Moody’s put all Danish banks’ stand-alone ratings on negative outlook (also<br />
spurred by the very modest macroeconomic recovery in Denmark).<br />
Capitalisation<br />
14%<br />
12%<br />
10%<br />
8%<br />
6%<br />
4%<br />
2%<br />
0%<br />
2004 2005 2006 2007 2008 2009 2010<br />
Core capital ratio Total capital ratio<br />
Source: <strong>Danske</strong> Markets<br />
Earning assets mix 2010<br />
Securities<br />
35%<br />
Due from<br />
banks<br />
9%<br />
Source: <strong>Danske</strong> Markets<br />
Retail<br />
21%<br />
Corporate<br />
35%<br />
Moody’s has put the A1 rating on Negative Watch as the agency is evaluating the<br />
likelihood of Jyske being too big to fail (currently Jyske has a one notch upgrade due<br />
to systemic support). We expect Jyske to keep the one notch uplift.<br />
Recommendation<br />
Overall, we view Jyske <strong>Bank</strong> as a sound Danish bank with a strong domestic franchise.<br />
Currently, asset quality in Jyske (as in other Danish banks) is under pressure<br />
but from a relatively strong level. While acknowledging that the capitalisation of<br />
Jyske remains strong, we believe that visibility in terms of Danish asset quality remains<br />
weak. Thus we believe Jyske will underperform foreign peers in the short- to<br />
medium-term and we find the outstanding 2012 issue very tight. We maintain our<br />
SELL recommendation. See the list of instrument prices at the end of this book.<br />
Revenue split 2010<br />
Fees and<br />
commission<br />
19%<br />
Financial<br />
income<br />
6%<br />
Other<br />
income<br />
6%<br />
Source: <strong>Danske</strong> Markets<br />
Net interest<br />
income<br />
69%<br />
20 | 13 April 2011<br />
www.danskeresearch.com
<strong>Scandi</strong> Handbook<br />
Financial date Jyske <strong>Bank</strong><br />
P&L (DKKm) 2006 2007 2008 2009 2010<br />
Net interest income 3,036 3,217 3,638 4,508 4,723<br />
Fees and commissions 1,635 1,797 1,513 1,266 1,320<br />
Net result from financial transactions 1,142 352 365 878 431<br />
Other income 419 270 328 362 403<br />
Total revenue 6,232 5,636 5,845 7,015 6,878<br />
Personnel costs 2,183 2,119 2,314 2,145 2,417<br />
Other costs 1,419 954 1,074 894 1,209<br />
Depreciation and amortization 175 217 285 317 184<br />
Total costs 3,777 3,290 3,674 3,355 3,811<br />
Pre provision income (PPI) 2,455 2,346 2,171 3,660 3,067<br />
Loan losses and provisions -348 74 973 2,418 1,580<br />
Operating profit (core earnings) 2,803 2,272 1,198 1,242 1,487<br />
Non-recurring items 8 1 94 -613 -484<br />
Pre-tax income 2,810 2,273 1,291 629 1,003<br />
Tax 677 538 303 158 246<br />
Net income 2,134 1,735 988 471 757<br />
Adjusted net income 2,107 1,715 884 1,075 1,263<br />
Balance sheet (DKKm) 2006 2007 2008 2009 2010<br />
Due from central banks and credit institutions 16,695 31,775 31,397 19,675 17,783<br />
Lending to general public 107,185 133,965 129,117 110,592 114,023<br />
Securities 14,785 20,338 36,170 58,865 68,326<br />
Earning assets 138,666 186,078 196,684 189,132 200,132<br />
Other assets 21,991 28,200 40,163 35,461 43,982<br />
Total assets 160,656 214,279 236,848 224,593 244,114<br />
Deposits from the general public 76,277 97,559 105,610 95,324 98,020<br />
Issued securities incl. covered bonds 25,393 34,874 36,925 50,301 45,383<br />
Subordinated debt ex hybrid 1,965 1,640 1,639 1,667 1,613<br />
Hybrid securities (Tier 1) 1,353 1,678 1,643 1,585 1,644<br />
Equity 9,582 9,654 10,677 12,523 13,320<br />
Risk weighted assets (RWA) 111,720 132,539 105,553 100,420 101,572<br />
Key ratios 2006 2007 2008 2009 2010<br />
Net interest margin 2.3% 2.0% 1.9% 2.3% 2.4%<br />
Recurring earnings power 2.3% 1.9% 1.8% 3.6% 3.0%<br />
Return on average assets (before tax) 1.4% 0.9% 0.4% 0.2% 0.3%<br />
Return on average equity before tax 29.6% 23.6% 12.7% 5.4% 7.8%<br />
Return on average equity after tax 22.5% 18.0% 9.7% 4.1% 5.9%<br />
Cost/income 60.6% 58.4% 62.9% 47.8% 55.4%<br />
Problem loans/Total loans 0.2% 1.1% 2.8% 3.4% 7.6%<br />
Loan loss provisions / Total loans -0.3% 0.1% 0.8% 2.2% 1.4%<br />
Loan loss reserves/Problem loans 392.8% 59.6% 42.5% 90.7% 50.9%<br />
Loan loss reserves/Pre-provision income 31.2% 37.4% 70.8% 93.2% 143.7%<br />
Avg. customer deposits/avg. total funding 64.1% 60.0% 58.8% 57.8% 55.5%<br />
Market funds / total funding 35.0% 39.4% 38.5% 40.7% 42.1%<br />
Avg. gross loans/avg. customer deposits 135.7% 138.7% 129.5% 119.3% 116.2%<br />
Lending growth 17.9% 25.0% -3.6% -14.3% 3.1%<br />
Payout ratio 0% 0% 0% 0% 0%<br />
Core capital ratio incl hybrid 9.7% 8.1% 11.0% 13.5% 14.1%<br />
Core capital ratio ex hybrid 8.5% 6.9% 9.5% 11.9% 12.5%<br />
Total capital ratio 11.3% 9.5% 12.7% 15.3% 15.8%<br />
Source: Company data and <strong>Danske</strong> Fixed Income Credit Research<br />
P&L (DKK m) Q4 09 Q1 10 Q2 10 Q3 10 Q4 10<br />
Net interest income 1,219 1,156 1,154 1,237 1,177<br />
Fees and commissions 385 320 292 291 417<br />
Net result from financial transactions & trading 191 275 77 71 7<br />
Pre-provision income (PPI) 1,117 898 703 811 672<br />
Loan losses -947 -598 -386 -318 -279<br />
Net profit -4 128 165 152 307<br />
Lending to general public 110,592 111,082 112,201 109,746 114,023<br />
Net interest margin 2.8% 2.5% 2.4% 2.6% 2.4%<br />
Recurring earning power (1) 4.5% 3.5% 2.6% 3.1% 2.7%<br />
Cost/income 40.6% 51.2% 57.1% 52.1% 60.5%<br />
Problem loans/Total loans 3.4% 5.0% 5.3% 7.5% 7.6%<br />
Loan loss ratio (ann.) 3.4% 2.2% 1.4% 1.1% 1.0%<br />
Leverage ratio (core capital/total assets) 6.0% 6.1% 5.7% 5.6% 5.9%<br />
Core capital ratio (Tier 1) 13.5% 12.9% 13.0% 13.9% 14.1%<br />
Total capital ratio (Tier 1 + Tier 2) 15.3% 14.7% 14.8% 15.6% 15.8%<br />
Source: Company data and <strong>Danske</strong> Fixed Income Credit Research<br />
21 | 13 April 2011<br />
www.danskeresearch.com
<strong>Scandi</strong> Handbook<br />
Nordea<br />
Company overview<br />
Nordea AB is the leading bank in the Nordic region measured by market value and<br />
total assets. It has operated under the Nordea brand since 2001 and targets a European<br />
cross-border operating model. The group has its origins in the creation of MeritaNordbanken<br />
in 1997, which combined Merita <strong>Bank</strong> of Finland and Nordbanken of<br />
Sweden. The plan was realised in 2000, following the merger with Unidanmark of<br />
Denmark and the acquisition of Christiana <strong>Bank</strong> of Norway. Nordea has a distinctive<br />
footprint in the Nordic area, underpinned by around 10 million customers, 1,400<br />
branches and leading positions in retail banking, corporate finance and savings management.<br />
Furthermore, the bank has built up a presence in Estonia, Latvia, Lithuania,<br />
Poland and Russia.<br />
The bulk of earnings come from the core markets in the Nordic region (about 90% of<br />
the total loan portfolio). Nordea’s market position differs in each geographical market.<br />
In-market consolidation is more or less complete in the Finnish market, where<br />
Nordea is the market leader with more than 30% of both household and corporate<br />
lending. Although Nordea does not have quite as high a market share in Denmark,<br />
Norway and Sweden, it still accounts for 10-25% of both household and corporate<br />
lending. The Finnish insurance group, Sampo Oyj, is the largest shareholder with<br />
21% of the shares. The Swedish State owns 13.5%, down from almost 20% last year.<br />
It remains a long-term goal of the current government to dispose of its shares in<br />
Nordea, but currently it does not have the parliamentary backing to do so.<br />
Key credit considerations<br />
Robust profitability<br />
Previously, Nordea’s operating efficiency lagged behind that of its peers due to challenges<br />
relating to the integration of four different banks in four Nordic countries,<br />
which is why reducing costs has been a key management priority for a long time.<br />
Following these cost-reduction efforts, Nordea’s efficiency has improved markedly<br />
and the cost-income ratio was 52% in 2010 (2009: 50%). The recent strong results<br />
reflect the shift toward improving revenue generation from its existing customer<br />
base, which is a key strategic objective for Nordea – as is the establishment of more<br />
branches.<br />
Highly diversified bank<br />
In terms of geographic exposure, Nordea is the most diverse among the <strong>Scandi</strong>navian<br />
banks, with large franchises in all of the Nordic countries. Denmark and Sweden are<br />
Nordea’s two largest markets with 27% and 25% of the loan book, respectively. As<br />
business cycles among the Nordic countries are not completely aligned, we believe<br />
that Nordea will offer a more stable performance in the future.<br />
BUY<br />
Sector: Financials<br />
Corporate ticker: NBHSS<br />
Equity ticker: NDA SS<br />
Market cap: SEK292bn<br />
Ratings:<br />
S&P rating: AA- (stable)<br />
Moodys rating Aa2 (stable)<br />
Fitch rating: AA- (stable)<br />
Analysts:<br />
Henrik Arnt<br />
henrik.arnt@danskebank.dk<br />
+45 4512 8504<br />
Thomas Hovard<br />
thomas.hovard@danskebank.dk<br />
+45 4512 8505<br />
Key credit issues<br />
Strengths:<br />
• Diversified franchise<br />
• Resilient during downturn<br />
• High profitability<br />
Challenges:<br />
• Growing exposure to Eastern<br />
Europe<br />
• Shipping exposure<br />
Source: <strong>Danske</strong> Markets<br />
In recent years, Nordea’s exposure to Eastern Europe (“New European Markets”) has<br />
grown considerably. By end-Q4 10, New European Markets accounted for EUR18bn<br />
of lending, of which the three Baltic countries accounted for a little less than half,<br />
while the remainder was divided between Poland and Russia. In a group context, the<br />
exposure to New European Markets is still relatively modest at 6% of total lending.<br />
22 | 13 April 2011<br />
www.danskeresearch.com
<strong>Scandi</strong> Handbook<br />
Capitalisation<br />
At year-end Nordea reported a full Basel II Tier-1 ratio of 11.4% and a total capital<br />
ratio of 13.4%. Nordea has an internal Tier 1 target of 9.0% over the business cycle<br />
and aims to pay dividends of at least 40% of net profit (for 2010 the payout ratio is<br />
44%). Once Basel III is fully implemented, it is likely that Nordea will have to revisit<br />
this target and increase it. From an absolute perspective, the capitalisation is sound<br />
but relative to its Nordic peers it is actually in the lower end.<br />
Asset quality<br />
Over the past five years, Nordea has shown a strong track record in terms of loan<br />
losses. Until Q4 07, Nordea had 15 consecutive quarters of loan loss reversals. Naturally,<br />
since then the situation has changed and by the end of 2010 the level of nonperforming<br />
loans stood at 1.54% of total loans, marginally up from 1.50% at end-<br />
2009. The Nordic countries have fared rather differently since the outbreak of the<br />
financial crisis. The recovery has been strong in Sweden and Norway, whereas Denmark<br />
has lagged behind. Going forward, we consider the outlook for asset quality in<br />
the Nordic region benign. The main risk would be a sharp increase in short-term<br />
rates, as this could lead to lower house prices. In the short to medium term, this<br />
should not be a major issue, however.<br />
The corporate loan book is reasonably well-diversified, but we note that Nordea has<br />
some exposure to the shipping industry. Recently, freight rates have come under<br />
pressure again (the Baltic Dry Index in particular), and this once again turns attention<br />
towards the banks’ shipping exposure. Five-year old crude and dry bulk carriers are<br />
now priced at about half and a third, respectively, of the peak values seen during<br />
H1 08. Nordea is one of the largest shipping banks globally but shipping (and oil)<br />
still accounts for a modest 4% of the total loan book, and so far loan losses remain<br />
modest and actually down from the previous quarter. Overall, the shipping exposure<br />
of Nordea is therefore unlikely to be a credit driver in the coming quarters.<br />
Liquidity and funding<br />
Nordea has a stable funding base in its retail and commercial deposits. At the end of<br />
Q4 10, deposits represented about 56% of total group lending, which is sound and a<br />
relatively high level, considering that mortgage lending in Denmark is funded directly<br />
in the market without any meaningful risk for Nordea (Nordea Kredit). Nordea<br />
has taken advantage of the well-developed mortgage securities markets in Denmark<br />
and Sweden throughout the crisis. Moreover, Nordea has set as a target that the net<br />
balance of stable funding should be positive, which means that stable assets must be<br />
funded by stable liabilities (deposits and long-term bonds). Furthermore, Nordea<br />
holds a liquidity buffer consisting of high-grade liquid securities that can be sold or<br />
used as collateral in funding operations. Overall, we view Nordea’s asset and liability<br />
management as prudent and a credit strength.<br />
Capitalisation<br />
14%<br />
12%<br />
10%<br />
8%<br />
6%<br />
4%<br />
2%<br />
0%<br />
Source: Company data, <strong>Danske</strong> Markets<br />
Loss ratio (% annualised)<br />
0.7%<br />
0.6%<br />
0.5%<br />
0.4%<br />
0.3%<br />
0.2%<br />
0.1%<br />
0.0%<br />
Core capital ratio<br />
2006 2007 2008 2009 2010<br />
Source: Company data, <strong>Danske</strong> Markets<br />
Funding mix, 2010<br />
Total capital ratio<br />
Q1 08 Q3 08 Q1 09 Q3 09 Q1 10 Q3 10<br />
Market<br />
funds<br />
38%<br />
Equity<br />
Sub debt 6%<br />
2%<br />
Interbank<br />
10%<br />
Retail<br />
deposits<br />
19%<br />
Corporate<br />
deposits<br />
25%<br />
Source: Company data, <strong>Danske</strong> Markets<br />
Current performance drivers<br />
Q4 10 report<br />
As in Q3 10, Nordea beat expectations on all income lines and total income increased<br />
to EUR2.5bn. Overall, net profit came in at EUR770m, which is the highest since<br />
Q4 07 and represented an increase of 9% q/q and 72% y/y. The more than decent<br />
trading income that Nordea reported was a surprise in view of a difficult and volatile<br />
Q4, in which the sovereign debt crisis was at full steam.<br />
Net interest income increased 4% from the previous quarter despite the lending book<br />
not growing. This positive development can mainly be attributed to an increase in<br />
deposit margins and volumes, which more than offset higher funding costs. Lending<br />
margins were largely stable.<br />
23 | 13 April 2011<br />
www.danskeresearch.com
<strong>Scandi</strong> Handbook<br />
In Q4 10, Nordea reported loan losses of EUR166m, which was slightly higher than<br />
the previous quarter (adjusted for the contribution to the Danish bank package rescue).<br />
This corresponds to a loan loss ratio of 21bp, so asset quality remains well<br />
guarded.<br />
M&A activity may materialise<br />
Nordea has emerged as one of the winners from the financial crisis. We believe one<br />
of the consequences of this will be that Nordea will participate actively in consolidation<br />
in the future. Management has stated on several occasions that the bank stands<br />
ready to take part in M&A activity, both inside and outside the Nordic region. We<br />
believe that acquisitions in the Nordic region are likely, whereas a pan-European<br />
merger does not seem so probable for now. The most obvious place for acquisitions<br />
is Denmark, where a number of banks are still struggling and face funding challenges<br />
in the next few years as the government-guaranteed funding expires. So far, Nordea<br />
has taken over the rest of distressed Fionia <strong>Bank</strong> in Denmark.<br />
Hawkish Swedish regulators supportive for credit quality<br />
In March, the Swedish regulators as well as the Minister of Finance, communicated a<br />
rather hawkish stance on bank regulation. Sweden should move ahead of Basel III<br />
and regulatory core capital levels should increase by 1% annually in the next few<br />
years, thereby restricting the possibility for banks to pay large dividends. A core Tier<br />
1 level of 10% and a total capital ratio of 15% will be the target levels for regulation<br />
in Sweden. This is significantly above the Basel III minimum requirements.<br />
Furthermore, the central bank talked about higher risk weightings on Swedish mortgages,<br />
as this would be an effective way of curbing the high growth in mortgage<br />
lending that is currently taking place in Sweden. However, the Swedish FSA has<br />
communicated that they are not in favour of an increase in risk weights. Instead they<br />
prefer more rigorous stress testing as well as additional capital requirements through<br />
Pillar 2 (under Basel II).<br />
Overall, Swedish banks will face a need to act rather conservatively in the next few<br />
years, in order to further build up or protect capital levels. This is positive from a<br />
credit perspective. We also note the regulatory focus on the housing market. Last<br />
year, the LTV requirements for Swedish mortgages were lowered and now the regulators<br />
want to increase the risk weighting. To us, this is a positive development as it<br />
reduces the risk of Sweden building up a housing bubble.<br />
Recommendation<br />
Nordea remains well on track and we do not see major negative triggers short-term.<br />
Capitalisation is slightly behind Nordic peers but still at a sound level. The more<br />
diversified nature of Nordea’s business compared with its Nordic peers makes it<br />
more likely to deliver a stable performance going forward.<br />
Earning assets mix, 2010<br />
Source: Company data, <strong>Danske</strong> Markets<br />
Revenue split, 2010<br />
Source: Company data, <strong>Danske</strong> Markets<br />
Efficiency and earnings<br />
60%<br />
50%<br />
40%<br />
Due from<br />
banks<br />
4%<br />
Securities<br />
23%<br />
Financial<br />
income<br />
20%<br />
Fees and<br />
commissio<br />
ns<br />
23%<br />
Other<br />
income<br />
1%<br />
Corporate<br />
40%<br />
Retail<br />
33%<br />
Source: Company data, <strong>Danske</strong> Markets<br />
Net<br />
interest<br />
income<br />
56%<br />
2006 2007 2008 2009 2010<br />
Cost/income<br />
Recurring earnings power, RHS<br />
2.2%<br />
1.8%<br />
1.4%<br />
1.0%<br />
Nordea continues to trade wider than Handelsbanken and lately also wider than DnB.<br />
We believe that this can be partly explained by the fact that Nordea has been a more<br />
frequent issuer in recent times than the others. We believe this pick-up is worth chasing<br />
and we reiterate our BUY recommendation on Nordea senior unsecured cash<br />
bonds. From a fundamental perspective, we are not concerned about subordinated<br />
debt issued by Nordea, but note that the outstanding 8.375% USD Tier 1 bond has a<br />
regulatory par call that Nordea may utilise by 2013. When taking this risk into account,<br />
current valuation is not that attractive (cash price of 110 translating into an<br />
ASW-spread of around 165bp if called at the beginning of 2013). See list of instrument<br />
prices at the end of this book.<br />
24 | 13 April 2011<br />
www.danskeresearch.com
<strong>Scandi</strong> Handbook<br />
Financial data Nordea<br />
P&L (EURm) 2006 2007 2008 2009 2010<br />
Net interest income 3,869 4,282 5,093 5,281 5,159<br />
Fees and commissions 2,074 2,140 1,883 1,693 2,156<br />
Net result from financial transactions 1,036 1,187 1,028 1,946 1,837<br />
Other income 119 116 172 105 116<br />
Total revenue 7,098 7,725 8,176 9,025 9,268<br />
Personnel costs 2,251 2,388 2,568 2,724 2,784<br />
Other costs 1,571 1,575 1,646 1,639 1,862<br />
Depreciation and amortisation 86 103 124 149 170<br />
Total costs 3,908 4,066 4,338 4,512 4,816<br />
Pre-provision income (PPI) 3,190 3,659 3,838 4,513 4,452<br />
Loan losses and provisions -257 -60 466 1,486 879<br />
Operating profit (core earnings) 3,447 3,719 3,372 3,027 3,573<br />
Non-recurring items 275 164 24 48 66<br />
Pre-tax income 3,722 3,883 3,396 3,075 3,639<br />
Tax 655 753 724 757 976<br />
Net income 3,067 3,130 2,672 2,318 2,663<br />
Adjusted net income 2,938 2,998 2,671 2,314 2,663<br />
Balance sheet (EURm) 2006 2007 2008 2009 2010<br />
Due from central banks and credit institutions 35,574 37,785 33,605 30,055 25,811<br />
Lending to general public 213,985 244,682 265,100 282,411 314,211<br />
Securities 54,147 57,906 63,436 82,802 99,542<br />
Earning assets 303,706 340,373 362,141 395,268 439,564<br />
Other assets 43,184 48,681 111,933 112,276 141,275<br />
Total assets 346,890 389,054 474,074 507,544 580,839<br />
Deposits from the general public 126,452 142,329 148,591 153,577 176,390<br />
Issued securities incl. covered bonds 83,417 99,792 108,989 130,519 151,578<br />
Subordinated debt ex hybrid 6,719 6,147 6,762 5,364 5,815<br />
Hybrid securities (Tier 1) 1,458 1,409 1,447 1,821 1,946<br />
Equity 15,276 17,082 17,725 22,420 24,538<br />
Risk-weighted assets (RWA) 185,400 204,585 213,281 191,900 214,760<br />
Key ratios 2006 2007 2008 2009 2010<br />
Net interest margin 1.4% 1.4% 1.5% 1.4% 1.3%<br />
Recurring earnings power (1) 1.8% 1.9% 1.8% 2.2% 2.2%<br />
Return on average assets (before tax) 0.9% 0.9% 0.6% 0.5% 0.5%<br />
Return on average equity before tax 26.4% 24.0% 19.5% 15.3% 15.5%<br />
Return on average equity after tax 21.8% 19.3% 15.4% 11.5% 11.3%<br />
Cost/income 55.1% 52.6% 53.1% 50.0% 52.0%<br />
Problem loans/Total loans 0.9% 0.5% 0.8% 1.5% 1.5%<br />
Loan loss provisions/Total loans -0.1% 0.0% 0.2% 0.5% 0.3%<br />
Loan loss reserves/Problem loans 59.9% 72.4% 52.6% 58.3% 59.1%<br />
Loan loss reserves/Pre-provision income 35.0% 26.2% 30.5% 53.0% 64.4%<br />
Avg. customer deposits/avg. total funding 49.8% 50.7% 48.7% 45.7% 45.8%<br />
Market funds/total funding 46.6% 46.3% 50.4% 51.9% 49.9%<br />
Avg. gross loans/avg. customer deposits 166% 171% 175% 181% 181%<br />
Lending growth 13.5% 14.3% 8.3% 6.5% 11.3%<br />
Payout ratio 0.0% 0.0% 0.0% 43.0% 44.0%<br />
Core capital ratio incl. hybrid 7.1% 7.0% 7.4% 10.2% 9.8%<br />
Core capital ratio ex hybrid 6.3% 6.3% 6.7% 9.3% 8.9%<br />
Total capital ratio 9.8% 9.1% 9.5% 11.9% 11.5%<br />
Source: Company data, <strong>Danske</strong> Fixed Income Credit Research<br />
P&L (EUR m) Q4 09 Q1 10 Q2 10 Q3 10 Q4 10<br />
Net interest income 1,299 1,235 1,249 1,310 1,365<br />
Fees and commissions 463 475 538 525 618<br />
Net result from financial transactions & trading 351 548 339 446 504<br />
Pre-provision income (PPI) 924 1,114 968 1,138 1,232<br />
Loan losses -318 -261 -187 -157 -166<br />
Net profit 447 642 537 709 770<br />
Lending to general public 282,411 292,460 302,550 313,980 314,211<br />
Net interest margin 1.4% 1.3% 1.3% 1.3% 1.3%<br />
Recurring earning power (1) 1.9% 2.3% 1.9% 2.2% 2.3%<br />
Cost/income 56.9% 51.1% 55.1% 51.2% 50.8%<br />
Problem loans/Total loans 1.5% 1.5% 1.5% 1.5% 1.5%<br />
Loss ratio (% ann.) 0.5% 0.4% 0.3% 0.2% 0.2%<br />
Leverage ratio (core capital/total assets) 3.9% 3.8% 3.6% 3.5% 3.6%<br />
Core capital ratio (Tier 1) 10.2% 10.1% 10.0% 10.1% 9.8%<br />
Total capital ratio (Tier 1 + Tier 2) 11.9% 12.3% 11.8% 11.9% 11.5%<br />
Source: Company data, <strong>Danske</strong> Fixed Income Credit Research<br />
25 | 13 April 2011<br />
www.danskeresearch.com
<strong>Scandi</strong> Handbook<br />
Nykredit <strong>Bank</strong><br />
Company overview<br />
Nykredit <strong>Bank</strong> A/S is the fourth-largest Danish <strong>Bank</strong> measured by assets (fifth by<br />
loan book) and a 100% subsidiary of the mutually owned Nykredit Realkredit Group<br />
(A1/A+), which is Denmark’s second-largest financial group (and the largest Danish<br />
mortgage provider). Nykredit <strong>Bank</strong> controls approximately 5% of Danish banking<br />
assets and has a major investment banking orientation. Nykredit <strong>Bank</strong> plays different<br />
roles within each of the three inter-company business areas: Retail <strong>Bank</strong>ing (including<br />
agricultural customers), Commercial <strong>Bank</strong>ing and Markets & Asset Management<br />
(securities trading, asset management and pension advice services). In 2010, Markets<br />
& Asset Management was once again the largest income contributor to the bank. The<br />
bank’s products are distributed through the group’s retail, agricultural and commercial<br />
centres, the internet bank and a call centre.<br />
The Nykredit Group acquired the troubled Forstædernes <strong>Bank</strong> in September 2008,<br />
securing increased exposure to the Copenhagen area. The strategic objective is to<br />
utilise the cross-selling potential of the group’s large mortgage customer base in<br />
order to increase its loyal full-service bank customers.<br />
Key credit considerations<br />
Nykredit <strong>Bank</strong> strongly supported by ownership structure<br />
Nykredit <strong>Bank</strong> is a subsidiary of Nykredit Realkredit, the leading Danish mortgage<br />
provider, which is also one of the major private bond issuers in Europe. Nykredit<br />
Realkredit has a c.40% market share of mortgage lending in Denmark and operates<br />
through two different brands: Nykredit and Totalkredit. We believe the current ownership<br />
structure is a stabilising factor for Nykredit <strong>Bank</strong>, as it ensures that the parent<br />
would, if needed, support the bank with whatever liquidity and capital it has available<br />
at any given time, due to its importance and core status within the group. Nykredit<br />
Realkredit has emphasised the importance of the bank, as the bank announced a<br />
DKK1bn equity injection from Nykredit Realkredit in Q3 10 in order to underpin the<br />
future growth strategy.<br />
Relatively high exposure to financial markets<br />
Due to its relatively large investment bank activities, Nykredit <strong>Bank</strong> is exposed to<br />
fluctuations in financial markets. Still, its interest rate risk is below 1% (percentage<br />
of core capital that would be lost if rates increase by 1pp) and its FX exposure is<br />
virtually non-existent. On the other hand, equity risks (equity plus non-trading assets<br />
as a percentage of total adjusted equity) are higher than most Danish peers. As primary<br />
investments are Danish and European covered bonds, the main market risk for<br />
the group is its exposure to widening yield spreads between covered bonds and government<br />
bonds/interest rate swaps. This exposure is not hedged. Consequently, during<br />
the financial crisis, increasing yield spreads caused significant P&L volatility.<br />
Asset quality<br />
The bank has a strong corporate lending profile. At the end of 2010, the corporate sector<br />
accounted for 73% of gross loans, public sector for 1% and retail customers the remaining<br />
26%. Compared with other more retail-focused banks, this may result in a higher credit<br />
risk for the loan book. The largest exposure is to financial institutions (21%); real estate<br />
management has been reduced in recent years and accounted for 18% of the total loan<br />
book at year-end 2010. The group’s nationwide representation limits geographical concentration<br />
risk, although the purchase of Forstædernes <strong>Bank</strong> has increased exposure to the<br />
Copenhagen area. The handling of Nykredit <strong>Bank</strong>’s credit risk is fully integrated in the<br />
Nykredit group. The ultimate parent, Nykredit Holding, has issued guarantees covering<br />
pre-fixed loss amounts (undisclosed) concerning some of these exposures.<br />
HOLD<br />
Sector: Financials, <strong>Bank</strong>s<br />
Corporate ticker: NYKRE<br />
Equity ticker: Not listed<br />
Market cap: N/A<br />
Ratings:<br />
S&P rating: A+ / N<br />
Moodys rating: A1 / S<br />
Fitch rating: NR<br />
Analysts:<br />
Thomas Hovard<br />
thomas.hovard@danskebank.dk<br />
+45 4512 8505<br />
Henrik Arnt<br />
henrik.arnt@danskebank.dk<br />
+45 4512 8504<br />
Key credit issues<br />
Strengths:<br />
• Ownership structure and inherent<br />
likelihood of support.<br />
• Strong capitalisation.<br />
• Liquidity.<br />
Challenges:<br />
• Fragile stand-alone franchise.<br />
• Pressure on asset quality<br />
• Some lending concentration.<br />
• High market funding reliance.<br />
Source: <strong>Danske</strong> Markets<br />
26 | 13 April 2011<br />
www.danskeresearch.com
<strong>Scandi</strong> Handbook<br />
Since the emergence of the financial crisis, Nykredit <strong>Bank</strong> has incurred large loan<br />
losses, mainly attributable to its corporate loan book. Furthermore, the taken-over,<br />
troubled Forstædernes <strong>Bank</strong> (effectively merged with Nykredit <strong>Bank</strong> from Q2 10)<br />
reported an extreme loan loss ratio in 2009 of 25%. For 2010, the loan loss ratio for<br />
the merged entity was 1.68%, which is higher than its Danish peers. Consequently,<br />
we conclude that asset quality is below average.<br />
Liquidity and funding<br />
Nykredit <strong>Bank</strong>’s funding base is largely dependent on market-based funding (capital<br />
markets and interbank funding), which represents 54% of total funding, with customer<br />
deposits accounting for 37%. Reassuringly, the bank only funds the trading<br />
portfolio through the repo and money markets, while the loan book is financed by<br />
deposits and longer-term bilateral loans as well as bond issues. The trading book<br />
includes a portfolio of corporate bonds and the bank’s repo/reverse transactions.<br />
Securities not serving as collateral in the trading book constitute a short-term liquidity<br />
buffer for unforeseen drains on the bank’s liquidity.<br />
According to Moody’s 12-month liquidity score, Nykredit <strong>Bank</strong> has positive liquidity<br />
for more than 12 months without access to new funding.<br />
The collapse of small Danish bank Amagerbanken and the Danish authorities’ willingness<br />
through bank package 3 to impose haircuts on senior unsecured funding has<br />
put some stress on the funding situation for Danish banks. We regard Nykredit <strong>Bank</strong><br />
as strong and large enough to be able to continue to attract foreign funding going<br />
forward. At year-end 2010, Nykredit <strong>Bank</strong> had issued DKK15.4bn under its EMTN<br />
programme and DKK16.8bn under its ECP programme, totalling DKK32.2bn compared<br />
to DKK41.2bn the year before. According to management, long-term activities<br />
developed according to plan and the lower issuance of market funds in 2010 versus<br />
2009 was due to improved liquidity (ie, the need for net issuance decreased).<br />
Capitalisation<br />
As far as possible, Nykredit’s capital resources are concentrated in the parent company,<br />
Nykredit Realkredit A/S, to ensure strategic flexibility and headroom. Nykredit<br />
seeks to keep its lending activities unchanged despite economic developments, while<br />
retaining its high rating. As a result, Nykredit’s equity must be large enough to cover<br />
any increase in the statutory adequacy capital requirement and the required capital<br />
base during periods of severe recession. At end-2010, the core capital ratio and solvency<br />
ratio of Nykredit <strong>Bank</strong> were 15.0% and 15.7%, respectively. At the same time,<br />
the Nykredit Group had a Tier 1 ratio of 18.5% and a Tier 2 ratio of 18.5%, making it<br />
one of the best capitalised groups in the Nordic region.<br />
In support, Nykredit Realkredit injected DKK3.2bn in equity capital into Nykredit<br />
<strong>Bank</strong> in August 2009 (at the same time, Nykredit <strong>Bank</strong> redeemed supplementary<br />
capital of DKK2,400m). As mentioned above, Nykredit Realkredit injected equity of<br />
DKK1bn into Nykredit <strong>Bank</strong> in Q3 10. Nykredit <strong>Bank</strong> reports an individual solvency<br />
requirement of 8.9%, up from 8.8% at year-end 2009. Overall, we are very comfortable<br />
with Nykredit <strong>Bank</strong>’s capital position.<br />
Current performance drivers<br />
New strategy<br />
In September 2008 (the day before the Lehman collapse), Nykredit Group announced<br />
the acquisition of troubled Forstædernes <strong>Bank</strong> (total assets: DKK32bn). The purchase<br />
has proved very expensive due to its poor asset quality, as Forstædernes <strong>Bank</strong> was<br />
fairly heavily exposed to the property sector in the Copenhagen area. Nykredit <strong>Bank</strong><br />
and Forstædernes <strong>Bank</strong> merged on 1 April 2010, with accounting effective from<br />
1 January 2010. Strategically, the purchase of Forstædernes <strong>Bank</strong> was sensible, but<br />
the price was very high.<br />
Loan loss ratio (annualised)<br />
18%<br />
16%<br />
14%<br />
12%<br />
10%<br />
8%<br />
6%<br />
4%<br />
2%<br />
0%<br />
Source: Company data and <strong>Danske</strong> Markets<br />
Funding mix<br />
Source :Company data and <strong>Danske</strong> Markets<br />
Capitalisation<br />
18%<br />
16%<br />
14%<br />
12%<br />
10%<br />
8%<br />
6%<br />
4%<br />
2%<br />
0%<br />
Q1 09 Q2 09 Q3 09 Q4 09 Q1 10 Q2 10 Q3 10 Q4 10<br />
Market funds<br />
22%<br />
Sub debt<br />
0%<br />
Equity<br />
9%<br />
Core capital ratio<br />
Interbank<br />
32%<br />
Deposits<br />
37%<br />
Total capital ratio<br />
2004 2005 2006 2007 2008 2009 2010<br />
Source: Company data and <strong>Danske</strong> Markets<br />
27 | 13 April 2011<br />
www.danskeresearch.com
<strong>Scandi</strong> Handbook<br />
Nykredit Group has announced a new strategy plan, Strategy 2013, in which it describes<br />
its dual ambition to have both strong banking and mortgage arms. The acquisition<br />
of Forstædernes <strong>Bank</strong> was the first step by the group to become a significant<br />
player in the banking market; and with the current funding gap in the Danish banking<br />
sector, which we think should accelerate consolidation, Nykredit should have further<br />
opportunities to grow the banking arm in the coming years.<br />
In addition, in March Nykredit announced the divestment of its non-life insurance<br />
company, Nykredit Forsikring, to Norwegian Gjensidige for a consideration of<br />
DKK2.5bn (goodwill of DKK1.5bn). The two parties have agreed a long-term strategic<br />
alliance in which Gjensidige will service Nykredit’s retail customers under the<br />
Nykredit brand and Nykredit’s corporate customers under the Gjensidige brand. We<br />
always find it positive when banks and non-life insurance are separated as we do not<br />
see any significant synergies. <strong>Bank</strong>s can potentially be strong allies, but they are not<br />
strong sellers of non-life products.<br />
Q4 10: loan losses ticking up again<br />
Nykredit <strong>Bank</strong> recorded a pre-tax profit of DKK199m in Q4 10, compared with a<br />
pre-tax loss of DKK780m in Q4 09 due to significantly lower loan loss provisions.<br />
Net interest and commission income came in at DKK733m and DKK78m, respectively,<br />
largely unchanged vs Q4 09 and Q3 10.<br />
Loan losses (adjusted for compulsory payments to bank package I), which have been<br />
the problematic issue for the now-merged Forstædernes <strong>Bank</strong> in particular, showed<br />
improvement for the full year vs 2009. However, in Q4 loan losses have been ticking<br />
up again compared with Q3 10 (DKK441m versus DKK139m) highlighting that the<br />
Danish economy is only improving slowly (elevated credit risks in both retail and<br />
SME segments). The annualised loan loss level increased to 2.45% from 0.75%,<br />
which we find very high vs peers, yet well below the 7.3% at year-end 2009.<br />
Recent rating changes on senior debt<br />
The expected funding pressure following the collapse of Amagerbanken led Moody’s<br />
in February 2011 to put all Danish banks’ stand-alone ratings on negative outlook<br />
(also spurred by the very modest macroeconomic recovery in Denmark). Moody’s<br />
also removed systemic support from the smaller Danish banks, but this didn’t affect<br />
Nykredit <strong>Bank</strong> as the three-notch support included in the rating stem from a high<br />
likelihood of parental support.<br />
Recommendation<br />
On a stand-alone basis, we believe that Nykredit <strong>Bank</strong> has a higher risk profile than<br />
the large Nordic banks and its Danish peers. However, we believe that its credit<br />
quality cannot be viewed independently, as it forms such an integral part of Nykredit<br />
Realkredit Group, as shown by the recent significant capital injections. Surprisingly,<br />
Nykredit Realkredit is apparently not regarded as systemically important by the rating<br />
agencies, as no external support is factored in – a view we strongly disagree with,<br />
as we consider the Nykredit Group to be among the most systemic institutions in<br />
Denmark. Therefore, overall we are comfortable with the name.<br />
Earnings asset mix<br />
Securities<br />
43%<br />
Source: Company data and <strong>Danske</strong> Markets<br />
Revenue split<br />
Fees and<br />
commissions<br />
18%<br />
Financial<br />
income<br />
11%<br />
Due from<br />
banks<br />
17%<br />
Retail<br />
9%<br />
Other income<br />
1%<br />
Source: Company data and <strong>Danske</strong> Markets<br />
Profitability and efficiency<br />
80%<br />
60%<br />
40%<br />
20%<br />
0%<br />
Corporate<br />
31%<br />
Net interest<br />
income<br />
70%<br />
2004 2005 2006 2007 2008 2009 2010<br />
Cost/income<br />
Recurring earnings power, RHS<br />
Source: Company data and <strong>Danske</strong> Markets<br />
3,2%<br />
2,8%<br />
2,4%<br />
2,0%<br />
1,6%<br />
1,2%<br />
0,8%<br />
0,4%<br />
0,0%<br />
We have a HOLD recommendation on the outstanding senior bonds as they trade at<br />
tight levels. We are positive on subordinated exposure from parent Nykredit<br />
Realkredit and we recommend buying the two outstanding T1 issues. We prefer the<br />
4.901% as we think it offers stronger investor protection from a regulatory call due to<br />
it trading significantly below par (both issues may be redeemed at a make-whole<br />
price if that is greater than par). See list of instrument prices at the end of this book.<br />
28 | 13 April 2011<br />
www.danskeresearch.com
<strong>Scandi</strong> Handbook<br />
Financial date Nykredit <strong>Bank</strong><br />
P&L (DKKm) 2006 2007 2008 2009 2010<br />
Net interest income 776 1,018 1,458 2,934 2,898<br />
Fees and commissions 250 299 284 723 723<br />
Net result from financial transactions 522 542 -91 313 473<br />
Other income 27 23 34 51 38<br />
Total revenue 1,575 1,882 1,685 4,021 4,132<br />
Personnel costs 444 514 627 1,911 1,759<br />
Other costs 296 359 504 51 9<br />
Depreciation and amortization 2 10 5 54 13<br />
Total costs 742 883 1,136 2,016 1,781<br />
Pre provision income (PPI) 833 999 549 2,005 2,351<br />
Loan losses and provisions -44 -14 707 6,253 1,215<br />
Operating profit (core earnings) 877 1,013 -158 -4,248 1,136<br />
Non-recurring items 0 0 -137 -954 -619<br />
Pre-tax income 877 1,013 -295 -5,202 517<br />
Tax 250 255 -54 -1,264 122<br />
Net income 627 758 -241 -3,938 395<br />
Adjusted net income 627 758 -104 -3,120 1,044<br />
Balance sheet (DKKm) 2006 2007 2008 2009 2010<br />
Due from central banks and credit institutions 18,438 21,123 32,395 46,361 29,480<br />
Lending to general public 32,415 45,209 75,387 72,884 71,992<br />
Securities 47,955 55,483 53,561 65,670 75,266<br />
Earning assets 98,808 121,815 161,343 184,915 176,738<br />
Other assets 8,237 13,584 32,457 30,294 33,684<br />
Total assets 107,045 135,399 193,800 215,209 210,422<br />
Deposits from the general public 22,667 31,717 46,536 65,117 55,699<br />
Issued securities incl. covered bonds 4,899 1,562 17,330 44,059 32,848<br />
Subordinated debt ex hybrid 1,300 2,400 2,400 911 574<br />
Hybrid securities (Tier 1) 0 0 0 258 239<br />
Equity 4,241 6,099 7,104 12,374 13,769<br />
Risk weighted assets (RWA) 51,133 69,626 90,547 77,452 92,054<br />
Key ratios 2006 2007 2008 2009 2010<br />
Net interest margin 0.9% 0.9% 1.0% 1.7% 1.6%<br />
Recurring earnings power 1.8% 1.7% 0.7% 2.4% 2.8%<br />
Return on average assets (before tax) 0.7% 0.6% -0.1% -1.9% 0.2%<br />
Return on average equity before tax 22.3% 19.6% -4.5% -53.4% 4.0%<br />
Return on average equity after tax 16.0% 14.7% -3.7% -40.4% 3.0%<br />
Cost/income 47.1% 46.9% 67.4% 50.1% 43.1%<br />
Problem loans/Total loans 0.1% 0.1% 1.5% 11.7% 11.3%<br />
Loan loss provisions / Total loans -0.1% 0.0% 0.9% 8.6% 1.7%<br />
Loan loss reserves/Problem loans 516.7% 248.7% 66.6% 91.4% 75.3%<br />
Loan loss reserves/Pre-provision income 11.2% 9.7% 140.3% 389.6% 261.3%<br />
Avg. customer deposits/avg. total funding 27.5% 26.6% 29.6% 35.0% 39.6%<br />
Market funds / total funding 72.0% 68.1% 66.3% 56.8% 54.1%<br />
Avg. gross loans/avg. customer deposits 131.4% 142.7% 154.1% 132.8% 119.9%<br />
Lending growth 22.7% 39.5% 66.8% -3.3% -1.2%<br />
Payout ratio 0.0% 0.0% 0.0% 0.0% 0.0%<br />
Core capital ratio incl. hybrid 8.3% 8.8% 7.7% 12.3% 15.0%<br />
Core capital ratio ex hybrid 8.3% 8.8% 8.1% 12.0% 14.8%<br />
Total capital ratio 10.8% 12.0% 10.2% 12.3% 15.7%<br />
Source: Company data, <strong>Danske</strong> Fixed Income Credit Research<br />
P&L (DKK m) Q4 09 Q1 10 Q2 10 Q3 10 Q4 10<br />
Net interest income 690 671 747 747 733<br />
Fees and commissions 192 220 189 139 178<br />
Net result from financial transactions & trading 291 193 107 103 70<br />
Pre-provision income (PPI) 542 455 451 465 610<br />
Loan losses -1,322 -324 -311 -139 -441<br />
Net profit -566 21 69 120 185<br />
Lending to general public 72,884 73,185 75,244 73,900 71,992<br />
Net interest margin 1.5% 1.4% 1.6% 1.7% 1.7%<br />
Recurring earning power (1) 2.9% 2.3% 2.0% 1.9% 2.6%<br />
Cost/income 54.2% 58.5% 57.0% 53.4% 38.3%<br />
Problem loans/Total loans 11.7% 0.0% 16.4% 12.1% 11.3%<br />
Loan loss ratio (% ann.) 7.3% 1.8% 1.7% 0.7% 2.5%<br />
Leverage ratio (core capital/total assets) 4.4% 4.3% 5.4% 6.1% 6.6%<br />
Core capital ratio (Tier 1) 12.3% 12.4% 12.0% 14.0% 15.0%<br />
Total capital ratio (Tier 1 + Tier 2) 12.3% 12.4% 12.7% 15.0% 15.7%<br />
Source: Company data, <strong>Danske</strong> Fixed Income Credit Research<br />
29 | 13 April 2011<br />
www.danskeresearch.com
<strong>Scandi</strong> Handbook<br />
Pohjola <strong>Bank</strong><br />
Company overview<br />
Pohjola <strong>Bank</strong> plc (listed in Helsinki and formerly known as OKO <strong>Bank</strong>) is part of the<br />
Finnish OP-Pohjola Group, a co-operative banking organisation with a very strong<br />
position in the Finnish market. OP-Pohjola Group is the second-largest financial<br />
group in Finland with a market share of around 30% in lending and deposits. Within<br />
corporate lending the market share is approximately 20%.<br />
The Group is rather complex and consists of OP-Pohjola Group Central Cooperative,<br />
the Group’s central institution owned by over 200 member co-operative<br />
banks and Pohjola <strong>Bank</strong> Group, including the non-life insurance company Pohjola.<br />
OP-Pohjola Group Central Co-operative is mainly in charge of controlling and supervising<br />
the risk management, capital adequacy and liquidity of all member banks<br />
as well as providing centralised services including product development and strategic<br />
guidelines for efficiency and competitiveness. However, all member banks remain<br />
independent and responsible for the implementation of their own strategies within the<br />
Group’s defined risk and financial limits. The Group maintains the largest branch<br />
network in Finland with almost 600 outlets.<br />
OP-Pohjola Group’s key competitive advantages remain its close customer relationships,<br />
wide product range and sophisticated internet offering. These factors provide<br />
the bank with a strong distribution capacity. Pohjola <strong>Bank</strong> acts as the central bank for<br />
OP-Pohjola Group member banks for which it provides services including international<br />
activities, liquidity, money market products, derivatives and asset management.<br />
In addition, it offers commercial and investment banking services, non-life<br />
insurance (Pohjola Insurance Ltd) and asset management services to external clients.<br />
Pohjola <strong>Bank</strong> focuses solely on corporate clients following the sale of its retail banking<br />
activities to OP-Pohjola Group in 2005 and in addition the bank has a 28% market<br />
share in non-life insurance. The largest shareholders in Pohjola <strong>Bank</strong> are the<br />
parent, OP-Pohjola Group Central Co-operative with 30% of shares (57% of votes)<br />
and member co-operative banks with 14% (13% of the votes).<br />
Key credit considerations<br />
Very high degree of external support through joint liability framework<br />
The Central Co-operative with its subsidiaries and member banks comprises an<br />
amalgamation of co-operative banks. Under this model, Group resources serve as a<br />
safeguard for all member banks, i.e. the Central Co-operative and its credit institutions<br />
are jointly liable for each other's debts and commitments. In this respect the<br />
Central Cooperative is responsible for the payments of any debts of a member that<br />
cannot be paid using such member’s own funds. On the other hand, a member must<br />
pay to the Central Cooperative a proportionate share of the amount which the Central<br />
Cooperative has paid either to another member as part of the support action described<br />
above, or to a creditor of such member as payment of a due debt for which the creditor<br />
has not received payment from his debtor. Each member’s liability is divided<br />
between the members in proportion to their last confirmed balance sheet totals. Note<br />
that the insurance companies are exempted for the joint liability scheme.<br />
BUY<br />
Sector: Financials, banks<br />
Corporate ticker: POHBK<br />
Equity ticker: POH1S FH<br />
Market cap: EUR 3.3bn<br />
Ratings:<br />
S&P rating: AA- / S<br />
Moodys rating: Aa2 / N<br />
Fitch rating: AA- / N<br />
Analysts:<br />
Henrik Arnt<br />
henrik.arnt@danskebank.dk<br />
+45 4512 8504<br />
Thomas Hovard<br />
thomas.hovard@danskebank.dk<br />
+45 4512 8505<br />
Key credit issues<br />
Strengths:<br />
• Very high likelihood of support as<br />
group members are jointly liable<br />
for each other (only banking)<br />
• Unique loyalty bonus payout to<br />
customers<br />
• Stable non-life business<br />
Challenges:<br />
• Modest efficiency<br />
• Concentrations in loan book (geography)<br />
• The bank has high wholesale funding<br />
reliance<br />
Source: <strong>Danske</strong> Markets<br />
If member banks fail to act prudently, the Central Co-operative can take action with<br />
the authority to exclude a member bank in order to safeguard the risk profile of the<br />
Group as a whole. Overall, we regard this arrangement as very positive from a credit<br />
perspective since it provides extra insurance at the expense of possibly lower profits<br />
if Pohjola <strong>Bank</strong> is obliged to provide support for other group institutions.<br />
30 | 13 April 2011<br />
www.danskeresearch.com
<strong>Scandi</strong> Handbook<br />
As a result of the joint liability scheme, we use OP-Pohjola Group consolidated earnings<br />
in our assessment of the group even though issuance takes place in Pohjola<br />
<strong>Bank</strong>. This is in line with the approach taken by S&P’s.<br />
OP-Pohjola Group structure<br />
Earning assets mix 2010<br />
Due from<br />
banks<br />
2%<br />
Securities<br />
12%<br />
Corporate<br />
26%<br />
Retail<br />
60%<br />
Source: Company data & <strong>Danske</strong> Markets<br />
Source: Company data<br />
A leading financial group in Finland<br />
In 2005, Pohjola <strong>Bank</strong> acquired the second-largest Finnish insurance company, Pohjola.<br />
The acquisition was largely financed by a share issue and the sale of Pohjola<br />
<strong>Bank</strong>'s retail banking operations in the capital region to the OP-Pohjola Group (Central<br />
Co-operative). Pohjola <strong>Bank</strong> moved into the non-life insurance business in order<br />
to reinforce its position as a leading financial services group in Finland and to become<br />
a market leader nationwide.<br />
Revenue split 2010<br />
Other<br />
income<br />
30%<br />
Net interest<br />
income<br />
42%<br />
We believe that integrating non-life insurance and banking activities is difficult and<br />
that cross-selling opportunities are hard to realise. However, Pohjola <strong>Bank</strong> operates<br />
with a unique loyal customer benefit system, paying out bonuses in relation to its<br />
clients’ bancassurance business activities (transactions) with Pohjola. Customers can<br />
spend the bonus on banking services and insurance premiums or cash them (which is<br />
taxable). Only limited amounts (less than 10%) of the bonuses are withdrawn as cash<br />
whereas the bulk is spent on banking fees and insurance premiums. This makes for<br />
strong customer loyalty.<br />
Stable non-life insurance operations<br />
Non-life insurance is characterised by relatively low cyclicality, even if a deteriorating<br />
economic climate has a tendency to increase claims frequency. However, the<br />
investment return of the insurance company may have a tendency to correlate with<br />
the results of the banking activities.<br />
Historically, Pohjola has been a corporate-oriented insurer but it is gradually becoming<br />
more retail-oriented – the reason being the strong local distribution abilities<br />
through more than 200 OP member banks. In 2010, the non-life insurance operations<br />
recorded a pre-tax profit of EUR83m, down from EUR102m the previous year. This<br />
corresponds to some 14%% of group PTP.<br />
The main risks resulting from the insurance operations relate to tail events such as<br />
natural disasters, but reinsurance limits the downside risk significantly.<br />
Source: Company data & <strong>Danske</strong> Markets<br />
Efficiency and earnings<br />
90%<br />
80%<br />
70%<br />
60%<br />
50%<br />
40%<br />
30%<br />
20%<br />
10%<br />
0%<br />
Financial<br />
income<br />
2%<br />
Fees and<br />
commission<br />
26%<br />
Source: Company data & <strong>Danske</strong> Markets<br />
3.0%<br />
2.7%<br />
2.4%<br />
2.1%<br />
1.8%<br />
1.5%<br />
1.2%<br />
0.9%<br />
0.6%<br />
0.3%<br />
0.0%<br />
2006 2007 2008 2009 2010<br />
Recurring earnings power, RHS<br />
Cost/income<br />
31 | 13 April 2011<br />
www.danskeresearch.com
<strong>Scandi</strong> Handbook<br />
Capitalisation<br />
OP-Pohjola Group’s capitalisation has consistently been above 12%. While this is<br />
not necessarily a high relative level today it was so before the onset of the crisis. It<br />
therefore suggests that the Group acted conservatively up until the crisis and avoided<br />
the temptation to leverage the balance sheet excessively.<br />
By the end of 2010 the Tier-1 ratio was 12.8% and thus adequate. The Group currently<br />
targets a Tier 1 ratio of 9.5% and thereby the bank is well in line with its internal<br />
capital targets.<br />
Asset quality<br />
Pohjola <strong>Bank</strong> is first and foremost a corporate bank while the retail-oriented business<br />
predominantly takes place in the individual member banks. The loan losses have<br />
been highest in the corporate loan book whereas the household segment has held up<br />
well.<br />
Overall, the loan loss level has been relatively stable throughout the crisis illustrating<br />
the high exposure to retail through the local banks. More than two thirds of the loan<br />
book is towards households. During 2010 the annualised loan loss ratio fluctuated<br />
between 20 and 30bp. The gross level of impaired loans was a very modest 0.6%,<br />
which is a strong level compared with Nordic peers.<br />
The largest sector concentration in the corporate loan book is in real estate management<br />
(residential and other) at 35%. The OP-Pohjola group has virtually all its exposure<br />
towards Finland and is therefore less diversified than its Nordic peers.<br />
Liquidity and funding<br />
Due to the bank’s limited retail customer base, Pohjola <strong>Bank</strong> has limited access to<br />
traditionally stable retail funds. When looking at the OP-Pohjola as a group this<br />
changes fundamentally and a high 57% of group assets are financed by deposits. The<br />
deposit-to-loan ratio is 69%, which is relatively high. However, Pohjola <strong>Bank</strong> has a<br />
high reliance on confidence-sensitive wholesale funding. In 2010, Pohjola <strong>Bank</strong> OP<br />
Mortgage <strong>Bank</strong> issued four bonds worth a total of EUR3.25bn and the Group enjoys<br />
good access to the capital markets on the back of its strong ratings and the Group as a<br />
whole has a liquidity portfolio of EUR11.3bn (in central bank collateral value terms)<br />
of which the majority is held by the bank. According to the company, these liquidity<br />
reserves can be used to cover the Group’s funding maturities for some 24 months.<br />
Overall, we regard the bank’s liquidity and funding as prudently managed.<br />
Current performance drivers<br />
Q4 10: Decent results<br />
The OP-Pohjola Group reported Q4 10 pre-tax profit of EUR 106 when taking into<br />
account changes in the fair value reserve. Earnings in Q4 almost doubled year on<br />
year. Income increased by 15% mainly on life insurance. Net interest income increased<br />
5% sequentially. In Pohjola <strong>Bank</strong>, the result from banking and asset management<br />
was largely in line with expectations and clearly better than expected on<br />
loan losses. Overall, Q4 10 can be described as rather uneventful from a credit perspective.<br />
Recommendation<br />
We regard the bank’s credit quality as being strong, due to its sound capitalisation as<br />
well as the joint liability scheme within the Pohjola Group (see Appendix on next<br />
page). Its substantial reliance on wholesale funding is negative due to the bank’s<br />
limited retail customer base. However, it still benefits from corporate deposits (including<br />
membership banks that place their excess liquidity with Pohjola <strong>Bank</strong>). Pohjola<br />
<strong>Bank</strong> remains one of the few banks around that has a double A rating by all<br />
agencies (albeit with a negative outlook). The bank generally trades at a premium to<br />
peers and we believe this is worth exploiting. We therefore maintain our BUY recommendation.<br />
See a list of instrument prices at the end of this book.<br />
32 | 13 April 2011<br />
Capitalisation<br />
15%<br />
12%<br />
9%<br />
6%<br />
3%<br />
0%<br />
Source: Company data & <strong>Danske</strong> Markets<br />
Loan loss ratio (ann.)<br />
0.5%<br />
0.4%<br />
0.3%<br />
0.2%<br />
0.1%<br />
0.0%<br />
2006 2007 2008 2009 2010<br />
Core capital ratio Total capital ratio<br />
Q1 09 Q3 09 Q1 10 Q3 10<br />
Source: Company data & <strong>Danske</strong> Markets<br />
Funding mix 2010<br />
Equity<br />
Sub debt10%<br />
2%<br />
Market<br />
funds<br />
29%<br />
Interbank<br />
2%<br />
Source: Company data & <strong>Danske</strong> Markets<br />
www.danskeresearch.com<br />
Deposits<br />
57%
<strong>Scandi</strong> Handbook<br />
Financial data OP-Pohjola Group<br />
P&L (EURm) 2006 2007 2008 2009 2010<br />
Net interest income 883 1,048 1,189 1,070 917<br />
Fees and commissions 401 430 433 496 563<br />
Net result from financial transactions 0 0 0 112 46<br />
Other income 676 776 201 372 645<br />
Total revenue 1,960 2,254 1,823 2,050 2,171<br />
Personnel costs 527 553 598 622 643<br />
Other costs 625 683 794 785 806<br />
Depreciation and amortization 0 0 0 0 0<br />
Total costs 1,152 1,236 1,392 1,407 1,449<br />
Pre provision income (PPI) 808 1,018 431 643 722<br />
Loan losses and provisions 9 13 58 179 149<br />
Operating profit (core earnings) 799 1,005 373 464 573<br />
Non-recurring items 0 0 0 0 0<br />
Pre-tax income 799 1,005 373 464 573<br />
Tax 0 0 0 126 135<br />
Net income 799 1,005 373 338 438<br />
Adjusted net income 799 1,005 373 840 605<br />
Balance sheet (EURm) 2006 2007 2008 2009 2010<br />
Due from central banks and credit institutions 344 285 2,450 5,217 2,749<br />
Lending to general public 39,595 44,776 51,708 52,992 56,834<br />
Securities 6,229 6,761 5,754 7,731 7,957<br />
Earning assets 46,168 51,822 59,912 65,940 67,540<br />
Other assets 13,367 13,894 15,833 14,492 16,428<br />
Total assets 59,535 65,716 75,745 80,432 83,968<br />
Deposits from the general public 27,715 31,224 37,082 37,606 39,205<br />
Issued securities incl. covered bonds 13,500 14,074 18,164 19,945 19,577<br />
Subordinated debt ex hybrid 1,436 1,389 1,650 1,028 956<br />
Hybrid securities (Tier 1) 224 224 224 222 222<br />
Equity 5,124 5,638 5,215 6,187 6,726<br />
Risk weighted assets (RWA) 33,718 38,245 38,746 41,480 42,728<br />
Key ratios 2006 2007 2008 2009 2010<br />
Net interest margin 2.0% 2.1% 2.1% 1.7% 1.4%<br />
Recurring earnings power 2.5% 2.8% 1.1% 1.6% 1.7%<br />
Return on average assets (before tax) 1.4% 1.6% 0.5% 0.4% 0.5%<br />
Return on average equity before tax 16.2% 18.7% 6.9% 8.1% 8.9%<br />
Return on average equity after tax 16.2% 18.7% 6.9% 5.9% 6.8%<br />
Cost/income 58.8% 54.8% 76.4% 68.6% 66.7%<br />
Problem loans/Total loans 0.3% 0.3% 0.4% 0.7% 0.8%<br />
Loan loss provisions / Total loans 0.0% 0.0% 0.1% 0.3% 0.3%<br />
Loan loss reserves/Problem loans 96.9% 80.3% 67.5% 76.6% 71.6%<br />
Loan loss reserves/Pre-provision income 15.3% 11.6% 31.8% 42.1% 47.5%<br />
Avg. customer deposits/avg. total funding 65.9% 64.2% 64.6% 62.9% 62.6%<br />
Market funds / total funding 33.1% 31.1% 32.9% 34.8% 32.8%<br />
Avg. gross loans/avg. customer deposits 137.3% 143.1% 141.3% 140.2% 143.0%<br />
Lending growth 13.7% 13.1% 15.5% 2.5% 7.3%<br />
Payout ratio n.m n.m n.m n.m n.m<br />
Core capital ratio incl hybrid 12.7% 12.6% 12.6% 12.6% 12.8%<br />
Core capital ratio ex hybrid 12.0% 11.6% 12.0% 12.1% 12.2%<br />
Total capital ratio 14.3% 13.8% 12.7% 12.6% 12.8%<br />
Source: Company data and <strong>Danske</strong> Fixed Income Credit Research<br />
P&L (EUR m) Q4 09 Q1 10 Q2 10 Q3 10 Q4 10<br />
Net interest income 245 224 228 226 238<br />
Fees and commissions 125 143 139 135 146<br />
Net result from financial transactions & trading 27 37 10 26 37<br />
Pre-provision income (PPI) 122 166 177 202 178<br />
Loan losses -52 -38 -40 -31 -41<br />
Net profit 52 95 101 125 117<br />
Lending to general public 52,992 53,679 54,882 55,705 56,834<br />
Net interest margin 1.6% 1.4% 1.4% 1.4% 1.4%<br />
Recurring earning power (1) 1.2% 1.6% 1.7% 1.9% 1.7%<br />
Cost/income 75.1% 68.2% 67.5% 62.7% 68.5%<br />
Problem loans/Total loans 0.7% 0.8% 0.7% 0.7% 0.6%<br />
Loan loss ratio (ann.) 0.4% 0.3% 0.3% 0.2% 0.3%<br />
Leverage ratio (core capital/total assets) 6.5% 6.4% 6.2% 6.5% 6.5%<br />
Core capital ratio (Tier 1) 12.6% 12.6% 12.4% 12.7% 12.8%<br />
Total capital ratio (Tier 1 + Tier 2) 12.6% 12.6% 12.4% 12.7% 12.8%<br />
Source: Company data and <strong>Danske</strong> Fixed Income Credit Research<br />
33 | 13 April 2011<br />
www.danskeresearch.com
<strong>Scandi</strong> Handbook<br />
Sampo Group<br />
Company overview<br />
Sampo plc is the holding company of Sampo Group. Sampo Group consists of three<br />
business areas: Property & Casualty Insurance (If P&C); Life & Pension (Mandatum<br />
Life); and banking through the Nordea stake (rated AA-/Aa2/AA-, included in holding<br />
company and since 31, December 2009 and treated as an associated company).<br />
If P&C (25% of net asset value) is the largest Nordic P&C insurance company (second-largest<br />
Baltic P&C company). Mandatum Life (11% of group net asset value) is<br />
a leading life and pension insurer in Finland, with a rapidly growing Baltic presence.<br />
Moreover, for some years Sampo has been increasing its share in Nordea (part of<br />
holding company – 64% of group net asset value) to currently around 21.3%.<br />
Sampo Group was formed at the end of 2000 by the merger of the insurance group,<br />
Sampo, with the Finnish banking group, Leonia. The current company structure was<br />
obtained in 2007 with the divestment of Sampo <strong>Bank</strong> (to <strong>Danske</strong> <strong>Bank</strong>). The primary<br />
shareholders of Sampo plc are Solidium (owned by the Finnish government, 14%<br />
stake) and Varma Mutual (8.5% stake). Sampo’s Chairman of the Board, Björn<br />
Wahlroos, owns a 2.1% stake.<br />
Sampo Group: financial and insurance conglomerate<br />
With the associate status of Nordea, Sampo Group’s profitability is now directly<br />
linked to non-life insurance, life insurance and banking performance.<br />
If P&C is the major earnings generator in Sampo Group. During 2010, the non-life<br />
division accounted for 54% of pre-tax profit, while the life insurance division (Mandatum<br />
Life) accounted for 11% and Sampo plc (holding company including Nordea<br />
investment) for 36% (up from around 7% in 2009, due to the Nordea stake now being<br />
treated as an associate). In fact, the pre-tax profit from the holding company plc<br />
adjusted for the Nordea stake was a negative EUR48m, due to a net debt position in<br />
Sampo.<br />
Sampo Group has a return on equity (RoE) target in operating subsidiaries of above<br />
17.5%, which it achieved. In 2010, RoE in If P&C was 40% and 36% in Mandatum<br />
Life.<br />
At end-December 2010, the group had total investment assets of EUR18.3bn. 69%<br />
was allocated to bonds, 18% to equities, 9% in money markets, 1% in real estate and<br />
3% in other investments including cash.<br />
The group’s fixed income investments of EUR14.2bn (69% of total investment assets)<br />
were mainly invested in <strong>Scandi</strong>navian bonds (61%), European bonds (20%), US<br />
bonds (6%), European money markets (6%) and <strong>Scandi</strong> money markets (5%). More<br />
than half of the fixed income portfolio is invested in corporate bonds (corporates<br />
account for 29% and banks 23%), which inherently carries market and credit risks.<br />
<strong>Covered</strong> bonds accounted for 26% and government bonds for 9%. If P&C has a<br />
higher-than-average exposure to high-yield and non-rated credits.<br />
Key credit considerations<br />
IF P&C is the leading Nordic insurance company<br />
If P&C was created in 1999 through the merger of the non-life activities of Storebrand<br />
and Skandia. In 2002, Sampo’s P&C insurance operations were merged with If<br />
and, in 2004, If became fully-owned by Sampo. If P&C (incorporated in Sweden)<br />
consists of If P&C Insurance Ltd (Sweden) and If P&C Insurance Company Ltd<br />
(Finland).<br />
HOLD<br />
Sector: Financials, Insurance<br />
Corporate ticker: SHAMPO<br />
Equity ticker: SAMAS FH<br />
Market cap: EUR13.2bn<br />
Ratings: (Sampo plc/IF P&C)<br />
S&P rating: NR/A S<br />
Moodys rating: Baa2 S/ A2 S<br />
Fitch rating: BBB+ N/A- N<br />
Analysts:<br />
Thomas Hovard<br />
thomas.hovard@danskebank.dk<br />
+45 4512 8505<br />
Henrik Arnt<br />
henrik.arnt@danskebank.dk<br />
+45 4512 8504<br />
Key credit issues<br />
Strengths:<br />
• Leading P&C market positions in<br />
<strong>Scandi</strong> area.<br />
• Strong defensive characteristics<br />
of P&C markets.<br />
• Strong life position in Finland.<br />
• Financial industry diversification<br />
(non-life, life, banking).<br />
Challenges:<br />
• Reduced level of liquidity.<br />
• Solvency reduced as Nordea became<br />
associate, but still sound<br />
solvency levels.<br />
• Sampo is increasingly becoming<br />
an asset play.<br />
Source: <strong>Danske</strong> Markets<br />
34 | 13 April 2011<br />
www.danskeresearch.com
<strong>Scandi</strong> Handbook<br />
If has consistently reported combined ratios below the long-term target of 95%<br />
(2009: 92.1%, 2010: 92.8%), which to us signals that the company will be able to<br />
present stable and robust results going forward. This is supported by the fact that If<br />
has broad access to loss-experience data and risk sensitivities given its market position,<br />
which should enhance its pricing capabilities relative to those of its peers and<br />
protect profitability. Product and geographical diversification is good, but If P&C is<br />
not as geographically diversified as its larger European peers.<br />
Around 53% of gross written premiums in the P&C business stem from the Personal<br />
division, 30% from Commercial, 14% from Industrial and 3% from the Baltics. Geographically,<br />
36% of gross written premiums stem from Norway, 31% from Sweden,<br />
21% from Finland, and 9% from Denmark.<br />
If P&C market shares<br />
35<br />
30<br />
25<br />
20<br />
15<br />
10<br />
5<br />
0<br />
Norway Sweden Finland Denmark Baltics<br />
Source: <strong>Danske</strong> Markets<br />
To defend If’s market position against increasing competitor pressure, priorities for<br />
management are likely to include enhancing its regional presence by focusing on<br />
Denmark and Baltic markets through acquisitions (if judged attractive), although<br />
there are few candidates in the former. If is unlikely to expand on its own into other<br />
mature western European markets, given that management believes that If’s competitive<br />
strengths and brand would not necessarily be successfully replicated.<br />
If has a strong competitive position as the clear market leader in the Nordic region,<br />
with an overall estimated 22% market share. With the exception of Denmark, If is<br />
ranked at least second in each of the Nordic markets and has a similarly strong market<br />
position in the Baltic markets. The operating subsidiaries in the Baltics were<br />
merged into one legal entity in 2009. In addition to strong geographical diversity,<br />
premium income is widely spread by line of business and by sector, which suggests<br />
that If is well positioned to withstand market softening or large insurance events<br />
unless they are widespread.<br />
If’s primary competitive advantage is its pan-Nordic market leadership, which creates<br />
revenue and risk diversity, economies of scale and the credentials to be a price<br />
leader. Going forward, If may be challenged by several other Nordic players, as well<br />
as by growing business within relatively mature markets, but it should remain strong<br />
in its key markets where barriers to entry remain high.<br />
Life insurance division<br />
Mandatum Life has a market share in Finland of about 22% (28% in focus area unitlinked<br />
products) and a growing presence in the Baltics (19% market share). Around<br />
59% of the technical reserve is placed in traditional products (guaranteed) and about<br />
41% in unit-linked. The latter is taking up an increasing part of the technical reserves,<br />
which is a clear credit positive. Geographically, Mandatum Life is focused on<br />
Finland, accounting for about 90% of premium income.<br />
Insurance ratios<br />
100%<br />
98%<br />
96%<br />
94%<br />
92%<br />
90%<br />
88%<br />
86%<br />
84%<br />
Q1<br />
06<br />
Q3<br />
06<br />
Combined ratio, LHS<br />
Q1<br />
07<br />
Q3<br />
07<br />
Q1<br />
08<br />
Q3<br />
08<br />
Q1<br />
09<br />
Solvency ratio, RHS<br />
Q3<br />
09<br />
Q1<br />
10<br />
Q3<br />
10<br />
Source: Company data and <strong>Danske</strong> Markets<br />
100%<br />
90%<br />
80%<br />
70%<br />
60%<br />
50%<br />
40%<br />
At end-December 2010, 61% of the investment portfolio was placed in fixed income<br />
including money market products, 28% in equities, 4% in private equity, 3% in real<br />
estate and 3% in hedge funds. In July 2009, Mandatum Life sold all its shares in<br />
Danish insurance company Topdanmark to If P&C, which now holds all group shares<br />
invested in Topdanmark (about an 11% ownership stake).<br />
Current performance drivers<br />
Ratings<br />
The ratings of If P&C were reiterated in February 2009 by Moody’s, but the rating of<br />
the parent, Sampo plc, was downgraded by one notch (to Baa2 S) due to reduced<br />
levels of liquidity in the holding company. Historically, Sampo has been rated two<br />
notches below the operating insurance company, but now the three-notch differential<br />
is consistent with standard notching practices for European insurers. S&P has made<br />
no recent rating changes to If P&C. Management has stated that an A-rating is<br />
needed to run the non-life Industrial insurance business.<br />
Net asset value (EURm)<br />
EURm<br />
12000<br />
10000<br />
8000<br />
6000<br />
4000<br />
2000<br />
0<br />
P&C Life Holding Nordea Group<br />
Source: Company data, <strong>Danske</strong> Markets<br />
35 | 13 April 2011<br />
www.danskeresearch.com
<strong>Scandi</strong> Handbook<br />
Recent results Q4 10<br />
In 2010, Sampo surpassed EUR1bn, in pre-tax profit, for the first time. The Q4 report<br />
from Sampo Group was robust with pre-tax profit of EUR361m compared with<br />
EUR199m in the corresponding quarter the year before. In the P&C business, the<br />
combined ratio was 92.3% (from 92.7%) and pre-tax profit rose to EUR188m (from<br />
EUR168m). Premiums written for Life insurance business were almost flat at<br />
EUR284m with pre-tax profit rising to EUR42m (from EUR36m). The holding company<br />
reported a pre-tax profit of EUR132m, driven by pro-rata share of Nordea’s Q4<br />
profit, which amounted to EUR152m. Sampo is dependent on the securities market<br />
performance with large insurance investment portfolios and a meaningful share in the<br />
largest Nordic bank, Nordea, which accounts for more than 60% of group value.<br />
Recommendation<br />
We expect the underlying insurance business to continue to perform strongly. If P&C<br />
has some quite attractive defensive qualities, which are positive from a credit perspective.<br />
The leading market position of If P&C provides the base for strong underwriting<br />
profitability and the combined ratio has improved in recent years. On the<br />
other hand, Sampo is becoming increasingly dependent on volatile securities markets.<br />
Furthermore, reserving risk (longer tail-lines in especially motor and workers<br />
compensation), M&A risk and some speculative grade credit exposure partially offset<br />
this. That said, with a relatively conservative investment portfolio and a focus on a<br />
lower risk book of business supporting earnings performance and capitalisation, we<br />
expect credit metrics for the operating subsidiaries and the holding company to remain<br />
healthy.<br />
Pre-tax profit 2010<br />
Holding<br />
36%<br />
Life<br />
11%<br />
Source: Company data, <strong>Danske</strong> Markets<br />
P&C<br />
53%<br />
Sampo Group consolidated balance sheet (EURm)<br />
2006 2007 2008 2009 2010<br />
Fixed assets 221 198 176 158 151<br />
Intangibles 782 718 663 688 742<br />
Investments in associates 5 5,172 5,699<br />
Financial assets 15,926 19,584 16,139 15,479 17,508<br />
Unit linked 1,753 2,072 1,637 2,366 3,127<br />
Tax 149 89 156 81 68<br />
Cash 41 958 465 771 527<br />
Other assets 28,748 1,805 1,908 1,920 2,029<br />
Total assets 47,620 25,424 21,149 26,635 29,851<br />
Unit link provisions 1,752 2,071 1,637 2,359 3,124<br />
Insurance provisions 12,942 13,148 12,375 13,014 13,749<br />
Financial liabilities 1,395 1,102 1,269 2,098 2,187<br />
Other liabilities 26,343 1,370 1,293 1,551 1,905<br />
Total liabilities 42,432 17,691 16,574 19,022 20,965<br />
Equity 5,189 7,733 4,631 7,613 8,886<br />
Total equity and liabilities 47,621 25,424 21,205 26,635 29,851<br />
Source: Company data, <strong>Danske</strong> Fixed Income Credit Research<br />
36 | 13 April 2011<br />
www.danskeresearch.com
<strong>Scandi</strong> Handbook<br />
Sampo Group (EURm)<br />
P&L 2006 2007 2008 2009 2010<br />
Non-life insurance, PTP 730 534 549 644 707<br />
Life assurance, PTP 295 342 140 121 142<br />
<strong>Bank</strong>ing, PTP - - - - 523<br />
Holding company, PTP -27 95 180 36 -49<br />
Group eliminations -14 3 1 24 -3<br />
Extraordinary items - - - -<br />
Pre-tax profits 984 974 870 825 1,320<br />
Tax -281 -254 -195 -184 -216<br />
Discontinued operations 288 2,853 - - -<br />
Group profit 991 3,573 675 641 1,104<br />
Minorities -14 -1 - - -<br />
Net profits 977 3,572 675 641 1,104<br />
Adj. profits 1,078 3,393 -2,013 3,869 1,548<br />
AFS reserve 486 316 -2,364 296 736<br />
Change in fair value reserve 90 -169 -2,680 3,247 449<br />
Goodwill 739 704 645 665 717<br />
Equity 5,168 7,733 4,631 7,613 8,886<br />
NAV 4,429 7,029 3,986 7,539 9,257<br />
IF P&C 2006 2007 2008 2009 2010<br />
Premiums earned 3,765 3,797 3,807 3,643 3,894<br />
Claims -2,729 -2,788 -2,834 -2,717 -2,943<br />
Expenses -655 -653 -662 -640 -671<br />
Other technical items - 5 4 - -<br />
Technical interest 173 205 233 201 168<br />
Technical results 554 565 548 488 449<br />
Investment result 412 238 299 423 516<br />
Transferred to technical account<br />
-173 -205 -233 -201 -168<br />
Discounting -54 -56 -60 -60 -58<br />
Other income -9 -8 -5 -6 -32<br />
PTP 730 534 549 644 707<br />
Change AFS reserve - - -575 710 285<br />
PTP at market value 730 534 -26 1,354 992<br />
Gross invest. inc., market value 444 267 -241 1,156 831<br />
AFS reserve - - -414 105 315<br />
Claims ratio, net 72.5% 73.4% 74.4% 74.6% 75.6%<br />
Costs ratio, net 17.4% 17.2% 17.4% 17.6% 17.2%<br />
Combined ratio, net 89.9% 90.6% 91.8% 92.1% 92.8%<br />
Life insurance (Mandatum) 2006 2007 2008 2009 2010<br />
Net investment income 593 589 -222 629 n/a<br />
Transfer to expense result -16 -17 -16 -13 n/a<br />
Return on unit-linked polices -138 -57 485 -359 n/a<br />
Return on with-profit policies -190 -206 -140 -154 n/a<br />
Investment result 249 309 107 103 101<br />
Expense result 14 17 7 5 8<br />
Risk result 31 16 16 14 23<br />
Others 0 0 10 0 10<br />
Profit before tax 295 342 140 121 142<br />
Change in market values 91 -234 -667 536 302<br />
Profit at market values 386 108 -526 658 444<br />
Holding 2006 2007 2008 2009 2010<br />
PTP -27 95 180 36 -49<br />
Change AFS reserve, pre-tax - 9 -2,413 2,340 3<br />
Holding PTP, market value - 104 -2,233 2,376 -46<br />
Source: <strong>Danske</strong> Markets<br />
Quarterly review (EURm)<br />
Q4 09 Q1 10 Q2 10 Q3 10 Q4 10<br />
Sampo Group operating profit 199 287 334 338 361<br />
Non-Life (P&C) 168 125 208 186 188<br />
Life 36 36 33 31 42<br />
Associates (Nordea) 124 107 140 152<br />
Other (primarily holding) -5 2 -11 -19 -21<br />
Source: Company data, <strong>Danske</strong> Markets<br />
37 | 13 April 2011<br />
www.danskeresearch.com
<strong>Scandi</strong> Handbook<br />
SBAB<br />
Company overview<br />
SBAB is the fifth-largest mortgage institution in Sweden and was established by the<br />
Government in 1985 in order to finance mortgages (market share in retail lending of<br />
8% and 18.4% in tenant-owner associations). In 2007, SBAB expanded its product<br />
range to include savings products for individuals and in 2009, deposit facilities were<br />
launched for companies and tenant-owner associations. SBAB’s business model is<br />
based on the distribution of residential mortgages and savings products via the internet<br />
and by telephone to individuals. SBAB has several business partners, including<br />
banks and property brokers, who supply residential mortgages to SBAB. On 30 November<br />
2010, SBAB was granted permission by the Swedish Financial Supervisory<br />
Authority to conduct banking operations under the name SBAB <strong>Bank</strong>.<br />
SBAB conducts its operations in three business areas. Corporate and Retail focus on<br />
loans, while Finance focuses on funding and financial risk management. The group<br />
consists of SBAB, the subsidiary Swedish <strong>Covered</strong> Bond Corporation (SCBC) and<br />
the partly-owned company FriSpar Bolån (FriSpar). SCBC’s primary operations<br />
comprise the issuance of covered bonds and SCBC does not pursue lending activities,<br />
but instead acquires loans primarily from SBAB. FriSpar is a jointly-owned company<br />
with operations in southern Sweden that engage in both lending to the retail and the<br />
corporate market. SBAB has a 51% stake in Frispar, while the balance is owned by<br />
Sparbanken Öresund (a merger between Sparbanken Finn and Sparbanken Gripen).<br />
Key credit considerations<br />
Ownership<br />
SBAB is fully owned by the Swedish Government. This may change in the future as<br />
the Swedish Government has expressed its desire to privatise SBAB (the opposition<br />
does not agree). The senior unsecured bonds issued under the EMTN programme<br />
benefit from an change of control ownership clause, which grants investors the right<br />
to demand premature repayment in the event that the Swedish Government<br />
(Aaa/AAA) no longer holds at least 51% of the voting rights in SBAB. This right<br />
applies on the condition that the Swedish Government has not previously guaranteed<br />
SBAB’s obligations under the bonds, in which case the right to premature repayment<br />
expires. The ownership therefore implies that SBAB benefits from a high level of<br />
implicit government support.<br />
The Swedish economy is among Europes strongest<br />
The domestic economic development – house prices and unemployment in particular<br />
– is central to the prospects for SBAB as virtually all company activities are in Sweden.<br />
The domestic Swedish economy fared relatively well throughout the financial<br />
crisis and recently a strong recovery has taken place. The most recent GDP numbers<br />
showed that in the fourth quarter of 2010 the Swedish economy grew by 7.3% y/y.<br />
The macroeconomic backdrop is therefore highly supportive for the banking system.<br />
BUY<br />
Sector: Financials<br />
Corporate ticker: SBAB<br />
Equity ticker: Not listed<br />
Market cap: Not listed<br />
Ratings:<br />
S&P rating: A+ (S)<br />
Moodys rating A1 (NO)<br />
Fitch rating: NR<br />
Analysts:<br />
Thomas Hovard<br />
Thomas.hovard@danskebank.dk<br />
+45 4512 8505<br />
Henrik Arnt<br />
Henrik.arnt@danskebank.dk<br />
+45 4512 8504<br />
Key credit issues<br />
Strengths:<br />
• Government ownership.<br />
• Exposure to low-risk residential<br />
mortgages.<br />
• CoC clause in EMTN documentation.<br />
Challenges:<br />
• High interest rate sensitivity of<br />
Swedish house prices.<br />
• Reliance on wholesale funding.<br />
• Lack of branch networks.<br />
Source: <strong>Danske</strong> Markets<br />
During the recent crisis, the central bank aggressively lowered its target rate. As the<br />
bulk of Swedish mortgages are tied to the short-term rate (STIBOR), this corresponded<br />
to an expansionary economic policy, to the benefit of the domestic economy<br />
and house prices in particular. We believe that this stimulus via the steep decline in<br />
short-term interest rates is a key explanation for the low Swedish loan losses in the<br />
past few years.<br />
38 | 13 April 2011<br />
www.danskeresearch.com
<strong>Scandi</strong> Handbook<br />
Naturally, the transmission also works the other way – i.e. when rates go up this will<br />
be felt with immediate effect, and the Riksbank started hiking its policy rate in September.<br />
So far, the level remains low and by the end of the year the repo rate is expected<br />
by our macro team to be 2.75%, by no means an alarming level. In fact, modest<br />
increases in the policy rate are probably net positive for the banks allowing them<br />
to raise deposit margins without really jeopardising asset quality. In medium term,<br />
we therefore fail to see any major negative credit triggers. Our main concern would<br />
be inflationary signs in Sweden, as this could result in a more aggressive hiking path<br />
from the Riksbank.<br />
Hawkish Swedish regulators supportive for credit quality<br />
In March, the Swedish regulators as well as the Minister of Finance communicated a<br />
rather hawkish stance on bank regulation. Sweden should move ahead of Basel III<br />
and regulatory core capital levels should increase by 1% annually in the next few<br />
years, thereby restricting the possibility for banks to pay large dividends. A core Tier<br />
1 level of 10% and a total capital ratio of 15% will be the target levels for regulation<br />
in Sweden. This is significantly above the Basel III minimum requirements.<br />
Furthermore, the central bank talked about higher risk weightings on Swedish mortgages,<br />
as this would be an effective way of curbing the high growth in mortgage<br />
lending that is currently taking place in Sweden. However, the Swedish FSA has<br />
communicated that it is not in favour of an increase in risk weights. Instead they<br />
prefer more rigorous stress testing as well as additional capital requirements through<br />
Pillar 2 (under Basel II).<br />
Overall, Swedish banks will face a need to act rather conservatively in the next few<br />
years in order to further build up or protect capital levels (positive from a credit perspective).<br />
We also note the regulatory focus on the housing market. Last year, the<br />
LTV requirements for Swedish mortgages were lowered and now the regulators want<br />
to increase the risk weighting. This is positive as it reduces the risk of Sweden building<br />
up a housing bubble similar to what we saw in Denmark, for example.<br />
Asset quality<br />
Generally, Swedish asset quality has proven to be very resilient to the global downturn.<br />
The stabilisation in house prices on the back of lower interest rates is clearly a<br />
factor in this respect and has no doubt benefitted SBAB. Loan losses are therefore at<br />
very low levels. Lending to households including tenant-owner associations represents<br />
some 80% of SBAB’s total loan portfolio and most of the lending is concentrated<br />
to the metropolitan regions in Sweden (Stockholm, Gothenburg and Öresund).<br />
Contributing to the sound asset quality is the Swedish legal setup in which a borrower<br />
is personally liable even after a foreclosure procedure, which limits the risk of<br />
moral hazard by the borrowers. Note that the Swedish FSA has established guidelines<br />
regarding loans secured against residential mortgages, which stipulate that new loans<br />
should not have an LTV exceeding 85%. The new rules took effect on 1 October<br />
2010 and should contribute to dampen house price growth. As mentioned in the<br />
section on the Swedish economy we consider the biggest threat to house price to<br />
stem from significantly higher short-term interest rates.<br />
Liquidity and funding<br />
The long-term goal of the SBAB Group is for about 50% of funding to be issued in<br />
Sweden and about 50% outside Sweden. The funding portfolio should be split between<br />
covered and non-covered funding with evenly distributed maturity dates,<br />
meaning that there should be no periods with large concentrations of debt maturities.<br />
Furthermore, the maturities shall exceed the registered average duration of the lending.<br />
Earnings asset mix<br />
Source: Company data and <strong>Danske</strong> Markets<br />
Loan loss provisions (annualised)<br />
0,2%<br />
0,1%<br />
0,0%<br />
Due from<br />
banks; 4%<br />
Corporate;<br />
15%<br />
Securities;<br />
12%<br />
Source: Company data and <strong>Danske</strong> Markets<br />
Funding mix 2010<br />
Retail;<br />
69%<br />
Q1 09 Q2 09 Q3 09 Q4 09 Q1 10 Q2 10 Q3 10 Q4 10<br />
Equity<br />
Sub debt<br />
3%<br />
2%<br />
Market<br />
funds<br />
87%<br />
Deposits<br />
Interbank<br />
6%<br />
Source: Company data and <strong>Danske</strong> Markets<br />
SBAB has access to several funding sources including deposits, a short-term funding<br />
programme, an EMTN programme and issuance of ‘AAA’ rated covered bonds<br />
39 | 13 April 2011<br />
www.danskeresearch.com
<strong>Scandi</strong> Handbook<br />
through SCBC. It is only recently that SBAB has started taking deposits and this<br />
source of funding is therefore of low importance so far (2% of total funding). Market<br />
funds accounted for 87% of the total funding by year-end 2010 and SBAB is therefore<br />
exposed to the confident-sensitive wholesale funding markets. SBAB addresses<br />
liquidity risks through a so-called maximum cumulative outflow (MCO) measure –<br />
i.e. the number of days the company can keep operating without access to the capital<br />
markets. By the end of Q4 10, the MCO corresponded to 63 days, down from 81 days<br />
the year before. In our view, this is not adequate – but the Government ownership,<br />
the high quality of the underlying assets and the historical strong performance of the<br />
domestic Swedish covered bond market are mitigating risk factors in this respect.<br />
Also, SBAB has a committed facility of SEK2bn with the Swedish national debt<br />
office (this facility will be reduced to SEK1bn by 2011 and expire in 2012).<br />
Capitalisation<br />
Following the financial crisis, SBAB changed its target for the primary capital ratio<br />
from between 6% and 7% to between 9% and 10% under full Basel II (without transition<br />
rules). According to transitional Basel II, SBAB’s primary capital ratio will not<br />
be less than 7%. By the end of Q4 10, SBAB had a Tier 1 ratio of 8.7% and a total<br />
capital ratio of 10.2% under the transitional rules. Under full Basel II, the ratios are<br />
19% and 22.4% respectively (Pillar 1). The big difference between the transition and<br />
the full ratios is a reflection of the low risk of the loan book. SBAB’s simple leverage<br />
ratio (core capital to total assets) stood at 3.63% by the end of Q4 10 and the company<br />
should therefore not have difficulties in meeting the Basel III condition once it<br />
comes into force by 2018 as a Pillar 1 requirement.<br />
Current performance drivers<br />
Q4 10 earnings report<br />
From a credit perspective, the Q4 report brought little news. The report was a bit soft<br />
compared with Q3 but in line with the report from the same quarter last year. Importantly,<br />
loan losses stayed very low (SEK1m) and backed by benign developments in<br />
hedge-accounted items, net profits came out better than Q3 10 and Q4 09.<br />
Rating<br />
Moody’s rates SBAB with a negative outlook. The uncertainty concerning the future<br />
ownership status of SBAB is the prime reason for this. Any new owner will almost<br />
certainly not be as strong financially as the current owner – the Swedish Government.<br />
In addition, the challenges SBAB faces in terms of distribution capability – as<br />
it lacks a branch network – is a credit weakness. S&P’s factors in two notches of<br />
extraordinary support above SBAB’s standalone credit profile based on the assessment<br />
that there is a ‘moderately high’ likelihood of extraordinary government support,<br />
if needed. This assessment is based on the opinion that there is a strong link<br />
between the company and the government.<br />
Recommendation<br />
Overall, we consider exposure to SBAB to be largely a play on the domestic Swedish<br />
economy – house prices in particular and to a lesser extent unemployment. We are<br />
currently not that concerned on the medium-term outlook for Swedish house prices<br />
but recognise the high interest rate sensitivity of Swedish homeowners. However, as<br />
long as the Government is the owner of SBAB and outstanding senior debt benefits<br />
from a change of control clause we see little reason to worry about SBAB exposure.<br />
Furthermore, the strong performance of the Swedish economy has so far quelled any<br />
asset quality fears. We therefore see limited downside risks in the medium term.<br />
Efficiency and earnings<br />
60%<br />
40%<br />
20%<br />
Source: Company data and <strong>Danske</strong> Markets<br />
Capitalisation<br />
12%<br />
9%<br />
6%<br />
3%<br />
0%<br />
0%<br />
2005 2006 2007 2008 2009 2010<br />
Cost/income<br />
2005 2006 2007 2008 2009 2010<br />
Core capital ratio<br />
Source: Company data and <strong>Danske</strong> Markets<br />
Revenue split 2010<br />
Fees and<br />
comm.<br />
-2%<br />
Financial<br />
income<br />
-14%<br />
Total capital ratio<br />
Source: Company data and <strong>Danske</strong> Markets<br />
2,8%<br />
2,4%<br />
2,0%<br />
1,6%<br />
1,2%<br />
0,8%<br />
0,4%<br />
0,0%<br />
Recurring earnings power, RHS<br />
Other<br />
income<br />
0%<br />
Net<br />
interest<br />
income<br />
84%<br />
On the back of these factors we maintain our Buy recommendation for SBAB and in<br />
particular we consider the 2013 senior floater to offer value. The company has no<br />
liquid CDSs. See a list of instrument prices at the end of this book.<br />
40 | 13 April 2011<br />
www.danskeresearch.com
<strong>Scandi</strong> Handbook<br />
Financial date SBAB<br />
P&L (SEKm) 2006 2007 2008 2009 2010<br />
Net interest income 1,217 1,177 1,141 1,519 1,762<br />
Fees and commissions 0 0 12 -46 -44<br />
Net result from financial transactions 0 0 -26 495 -289<br />
Other income 218 -422 0 6 0<br />
Total revenue 1,435 755 1,127 1,974 1,429<br />
Personnel costs 0 0 268 309 316<br />
Other costs 569 486 220 241 262<br />
Depreciation and amortization 26 31 32 28 26<br />
Total costs 595 517 520 578 604<br />
Pre-provision income (PPI) 840 238 607 1,396 825<br />
Loan losses and provisions 0 -20 22 107 40<br />
Operating profit (core earnings) 840 258 585 1,289 785<br />
Non-recurring items 0 0 0 0 0<br />
Pre-tax income 840 258 585 1,289 785<br />
Tax 0 0 161 338 208<br />
Net income 840 258 424 951 577<br />
Adjusted net income 840 258 424 951 577<br />
Balance sheet (SEKm) 2006 2007 2008 2009 2010<br />
Due from central banks and credit institutions 0 0 12,580 17,152 15,257<br />
Lending to general public 170,013 167,981 183,959 225,976 249,103<br />
Securities 0 0 31,787 32,412 37,985<br />
Earning assets 170,013 167,981 228,326 275,540 302,345<br />
Other assets 33,712 55,110 24,968 18,535 14,580<br />
Total assets 203,725 223,091 253,294 294,075 316,925<br />
Deposits from the general public 0 759 3,542 4,653 6,083<br />
Issued securities incl. covered bonds 182,328 191,807 198,643 249,095 261,962<br />
Subordinated debt ex hybrid 2,808 2,725 2,672 2,557 2,514<br />
Hybrid securities (Tier 1) 0 0 994 994 2,994<br />
Equity 6,034 6,226 6,432 7,377 8,014<br />
Risk weighted assets (RWA) 101,841 99,918 101,182 119,776 132,388<br />
Key ratios 2006 2007 2008 2009 2010<br />
Net interest margin 0.7% 0.7% 0.6% 0.6% 0.6%<br />
Recurring earnings power (1) 0.9% 0.2% 0.6% 1.3% 0.7%<br />
Return on average assets (before tax) 0.5% 0.1% 0.2% 0.3% 0.2%<br />
Return on average equity before tax 14.0% 4.2% 9.2% 18.7% 10.2%<br />
Return on average equity after tax 14.0% 4.2% 6.7% 13.8% 7.5%<br />
Cost/income 41.5% 68.5% 46.1% 29.3% 42.3%<br />
Problem loans/Total loans 0.1% 0.1% 0.1% 0.2% 0.2%<br />
Loan loss provisions / Total loans 0.0% 0.0% 0.0% 0.0% 0.0%<br />
Loan loss reserves/Problem loans 176.1% 144.4% 184.8% 88.9% 91.9%<br />
Loan loss reserves/Pre-provision income 33.3% 109.2% 42.0% 24.6% 42.7%<br />
Avg. customer deposits/avg. total funding 0.0% 0.2% 1.0% 1.6% 1.9%<br />
Market funds / total funding 96.8% 96.5% 95.9% 95.7% 95.3%<br />
Avg. gross loans/avg. customer deposits na na 8183% 5002% 4425%<br />
Lending growth 9.0% -1.2% 9.5% 22.8% 10.2%<br />
Payout ratio 0.0% 0.0% 0.0% 0.0% 0.0%<br />
Core capital ratio incl hybrid 7.3% 7.6% 7.6% 7.4% 8.7%<br />
Core capital ratio ex hybrid 0.0% 0.0% 6.6% 6.6% 6.4%<br />
Total capital ratio 9.0% 9.4% 9.4% 9.2% 10.2%<br />
Source: Company data and <strong>Danske</strong> Fixed Income Credit Research<br />
P&L (SEK m) Q4 09 Q1 10 Q2 10 Q3 10 Q4 10<br />
Net interest income 457 476 473 428 385<br />
Fees and commissions -14 -14 -9 -12 -9<br />
Net result from financial transactions & trading -46 -129 -92 -213 145<br />
Pre-provision income (PPI) 240 177 217 70 361<br />
Loan losses -42 -5 -39 -14 -1<br />
Net profit 146 126 131 56 264<br />
Lending to general public 225,976 234,401 242,164 247,774 249,103<br />
Net interest margin 0.7% 0.7% 0.6% 0.6% 0.5%<br />
Recurring earning power (1) 0.8% 0.6% 0.7% 0.2% 1.1%<br />
Cost/income 39.5% 46.8% 41.7% 65.5% 30.7%<br />
Problem loans/Total loans 0.2% 0.1% 0.2% 0.2% 0.2%<br />
Loss ratio (% ann.) 0.1% 0.0% 0.1% 0.0% 0.0%<br />
Leverage ratio (core capital/total assets) 3.0% 2.8% 3.5% 3.5% 3.6%<br />
Core capital ratio (Tier 1) 7.4% 7.1% 8.5% 8.5% 8.7%<br />
Total capital ratio (Tier 1 + Tier 2) 9.2% 8.8% 10.1% 10.2% 10.2%<br />
Source: Company data and <strong>Danske</strong> Fixed Income Credit Research<br />
41 | 13 April 2011<br />
www.danskeresearch.com
<strong>Scandi</strong> Handbook<br />
SEB<br />
Company overview<br />
SEB is the second largest of the Swedish banks (after Nordea) measured by total<br />
assets. It offers a full range of retail, commercial, investment banking and insurance<br />
products. SEB operates in the Nordic and Baltic regions, Germany, Poland, Russia<br />
and the Ukraine, with around four million private customers, 400,000 SME clients<br />
and 2,500 large companies. SEB holds a 15% market share in Sweden based on total<br />
lending, but the bank has a considerably higher market share within corporate banking<br />
(21%). More than half of SEB’s operating profit is generated in Sweden, with the<br />
remainder split between Germany, Denmark, Norway, and the three Baltic countries.<br />
In addition, the group retains a strong position in offering capital market-related<br />
services to large corporate and institutional clients, and it is also a leading provider of<br />
life and unit-linked pension products in the Swedish market.<br />
Fundamentally, SEB is more a commercial bank than any of its large <strong>Scandi</strong>navian<br />
peers, with corporate lending accounting for a greater and retail lending a lesser (onethird)<br />
proportion of total lending than its competitors. SEB is also a leading Nordic<br />
asset manager. Its main shareholders include Investor AB (A1/AA-), which holds a<br />
20.8% equity stake (and is controlled by the Wallenberg family) and the Trygg<br />
Foundation with an 8.0% interest. We regard SEB’s shareholder composition as<br />
credit-positive.<br />
Key credit considerations<br />
Exposure to Baltic countries<br />
Through its ownership of a major banking subsidiary in each Baltic country, SEB has<br />
a very strong foothold in the Baltic area, where it has been commercially active during<br />
the past decade. The Baltic countries experienced a severe economic downturn in<br />
2008 and 2009. Unemployment increased dramatically and the housing bubble burst.<br />
In 2010 a remarkable turnaround took place, and any imminent risk of devaluation<br />
has been reduced. In this respect, note that Estonia adopted the euro at the beginning<br />
of 2011, thereby removing any risk of a devaluation.<br />
Each Baltic subsidiary of SEB is a leading bank in its respective market. The combined<br />
market share in the three Baltic markets is around 25%, with the highest share<br />
being in Lithuania where SEB is the largest bank. In total, the Baltics account for 9%<br />
of the group’s total loan book, down from 11% a year earlier. Lithuania accounts for<br />
45% of the total Baltic exposure, and Estonia and Latvia 30% and 25%, respectively.<br />
We recognise that SEB moved more rapidly than its competitors to adapt to the challenging<br />
operating environment in the Baltic countries by tightening lending standards<br />
and increasing provisioning. As a result, it has lost market shares in all three countries<br />
in recent years, which we regard as positive in this context. Overall, SEB’s<br />
Baltic exposure is becoming less of a credit factor than previously.<br />
BUY<br />
Sector: Financials<br />
Corporate ticker: SEB<br />
Equity ticker: SEBA SS<br />
Market cap: SEK130bn<br />
Ratings:<br />
S&P rating: A (stable)<br />
Moodys rating A1 (stable)<br />
Fitch rating: A+ (stable)<br />
Analysts:<br />
Henrik Arnt<br />
henrik.arnt@danskebank.dk<br />
+45 4512 8504<br />
Thomas Hovard<br />
thomas.hovard@danskebank.dk<br />
+45 4512 8505<br />
Key credit issues<br />
Strengths<br />
• Strong asset quality among Swedish<br />
companies<br />
• Strong capitalisation<br />
Challenges<br />
• Baltic exposure<br />
• Swedish economy vulnerable to<br />
short-term rates increasing<br />
Source: <strong>Danske</strong> Markets<br />
Swedish economy is among Europes strongest<br />
The domestic economic development is central to the prospects for SEB (Sweden<br />
accounts for almost 60% of the loan book). The domestic Swedish economy fared<br />
relatively well throughout the financial crisis and a strong recovery has taken place<br />
recently. The most recent GDP numbers showed that in the fourth quarter of 2010 the<br />
Swedish economy grew by 7.3% y/y. The macroeconomic backdrop is therefore<br />
highly supportive for the banking system.<br />
During the recent crisis, the central bank aggressively lowered its target rate. As the<br />
bulk of Swedish mortgages are tied to the short-term rate (1M or 3M STIBOR), this<br />
corresponded to an expansionary economic policy, to the benefit of the domestic<br />
economy and house prices in particular. We believe that this stimulus via the steep<br />
42 | 13 April 2011<br />
www.danskeresearch.com
<strong>Scandi</strong> Handbook<br />
decline in short-term interest rates is a key explanation for the low Swedish loan<br />
losses in the past few years.<br />
Naturally, the transmission also works the other way, i.e. when rates go up this will<br />
be felt with immediate effect, and the Riksbank started hiking its policy rate in September.<br />
So far, the level remains low and by the end of the year the repo rate is expected<br />
by our macro team to be 2.75%, by no means at an alarming level. In fact,<br />
modest increases in the policy rate are probably net positive for the banks, as they<br />
allows them to raise deposit margins without really jeopardising asset quality. In the<br />
short to medium term, we therefore fail to see any major negative credit triggers. Our<br />
main concern would be if we see inflationary signs in Sweden, as this could result in<br />
a more aggressive hiking path from the Riksbank.<br />
Capitalisation<br />
SEB’s capital position is strong. At year-end 2010 the Tier 1 ratio was 14.2% under<br />
full Basel II and 12.8% under the transition rules. As a curiosity, it can be noted that<br />
the total capital position is actually slightly lower than SEB’s Tier 1 ratio. This is due<br />
to the Swedish rules whereby life insurance investments are deducted from Tier 2<br />
capital, whereas in Denmark, for example, half of the investment is deducted from<br />
Tier 1 capital. Furthermore, the “lack” of Tier 2 capital is a reflection of SEB’s strategic<br />
decision to focus on Tier 1 capital.<br />
Asset quality<br />
During the crisis, the challenge for SEB was its Baltic exposure, whereas the Swedish<br />
operations remained surprisingly resilient. However, in the last two quarters of<br />
2010, SEB booked a loan loss reversal, driven by the recovery in the Baltic banking<br />
operations. The reversals of loan loss provisions suggest that SEB’s general approach<br />
to provisioning during the recession was conservative, and this bodes well for asset<br />
quality going forward. In addition, the improvement in Baltic asset quality has paved<br />
the way for a return to profitability of SEB’s Baltic operations. The group’s level of<br />
gross impaired loans is also starting to come down, being 2.3% of total lending the<br />
end of 2010, down from 2.4% a year earlier.<br />
Domestically, SEB is mainly exposed to the relatively largest companies, which have<br />
so far performed fairly well during the crisis, and lately a sharp growth comeback has<br />
taken place in Sweden. On a longer horizon, the main risk for Swedish asset quality<br />
is that an up-tick in inflation could lead to aggressive rate tightening by the Riksbank.<br />
Liquidity and funding<br />
At the end of 2010, deposits accounted for 45% of SEB’s gross lending. The majority<br />
are corporate deposits, which in our view are less sticky. <strong>Bank</strong>ing operations are<br />
funded by deposits, while the mortgage operations have traditionally been funded by<br />
SEB BoLån issuing senior bonds. Wholesale funding is raised in both domestic and<br />
international capital markets. Although SEB applied for (and was granted) permission<br />
to issue with a Swedish government guarantee, the bank decided not to utilise<br />
this option.<br />
Group strategy requires at least 70% of illiquid assets to be financed using long-term<br />
funds. The liquidity reserve is also required to comprise at least 5% of total assets.<br />
SEB’s liquidity reserve totalled around SEK240bn at the end of 2010. Furthermore,<br />
by the end of 2010 there were 18 months of matched inflows and outflows. Overall,<br />
we regard the bank’s liquidity position as sound and believe that SEB has a strong<br />
funding franchise with a diversified mix.<br />
Capitalisation (transition rules)<br />
Source: Company data, <strong>Danske</strong> Markets<br />
Loss ratio (% annualised)<br />
1.2%<br />
1.0%<br />
0.8%<br />
0.6%<br />
0.4%<br />
0.2%<br />
0.0%<br />
-0.2%<br />
-0.4%<br />
16%<br />
14%<br />
12%<br />
10%<br />
8%<br />
6%<br />
4%<br />
2%<br />
0%<br />
2006 2007 2008 2009 2010<br />
Core capital ratio<br />
Source: Company data, <strong>Danske</strong> Markets<br />
Funding mix 2010<br />
Total capital ratio<br />
Q3 07 Q1 08 Q3 08 Q1 09 Q3 09 Q1 10 Q3 10<br />
Market<br />
funds<br />
34%<br />
Sub debt<br />
2%<br />
Equity<br />
6%<br />
Retail<br />
deposits<br />
11%<br />
Interbank<br />
13%<br />
Source: Company data, <strong>Danske</strong> Markets<br />
Corporate<br />
deposits<br />
34%<br />
43 | 13 April 2011<br />
www.danskeresearch.com
<strong>Scandi</strong> Handbook<br />
Current performance drivers<br />
Q4 10 report<br />
SEB beat expectations on NII as well as commissions, whereas trading income and<br />
costs were a little soft. Generally, lending and deposit volumes were down, but this<br />
was mainly due to the appreciation of SEK. Adjusted for this, volumes were largely<br />
unchanged. Net profit was SEK3.5bn, compared with SEK2.8bn in the previous<br />
quarter (adjusted for discontinued operations and restructuring charges). SEB proposes<br />
a dividend of SEK1.5 per share, corresponding to a payout ratio of just under<br />
50%. Lending margins decreased, but this was more than offset by higher deposit<br />
margins on the back of the higher short-term rates in Sweden, as the Riksbank has<br />
started to hike rates. Net commission fees increased due to more assets under management<br />
and higher performance-related fees.<br />
Revenue split, 2010<br />
Financial<br />
income<br />
13%<br />
Fee and<br />
comm.<br />
24%<br />
Other<br />
income<br />
10%<br />
Net<br />
interest<br />
income<br />
43%<br />
Hawkish Swedish regulators supportive for credit quality<br />
In March, the Swedish regulators as well as the Minister of Finance communicated a<br />
rather hawkish stance on bank regulation. Sweden should move ahead of Basel III<br />
and regulatory core capital levels should increase by 1% annually in the next few<br />
years, thereby restricting the possibility for banks to pay large dividends. A core Tier<br />
1 level of 10% and a total capital ratio of 15% will be the target levels for regulation<br />
in Sweden. This is significantly above the Basel III minimum requirements.<br />
Furthermore, the central bank talked about higher risk weightings on Swedish mortgages,<br />
as this would be an effective way of curbing the high growth in mortgage<br />
lending that is currently taking place in Sweden. However, the Swedish FSA has<br />
communicated that they are not in favour of an increase in risk weights. Instead they<br />
prefer more rigorous stress testing as well as additional capital requirements through<br />
Pillar 2 (under Basel II).<br />
Overall, Swedish banks will face a need to act rather conservatively in the next few<br />
years in order to further build up or protect capital levels. This is positive from a<br />
credit perspective. We also note the regulatory focus on the housing market. Last<br />
year, the LTV requirements for Swedish mortgages were lowered and now the regulators<br />
want to increase the risk weighting. To us, this is a positive development as it<br />
reduces the risk of Sweden building up a housing bubble similar to what we saw in<br />
Denmark, for example.<br />
Recommendation<br />
Amid the financial crisis, the exposure to the Baltic countries put significant pressure<br />
on SEB, but recently these countries have been enjoying a remarkable recovery that<br />
has translated directly into asset quality. Coupled with continuing strong asset quality<br />
in Sweden, we think that the fundamentals are in place for a further reversal of loan<br />
losses in the coming quarters, which bodes well for SEB. We also note that SEB has<br />
communicated that it targets an ‘AA’ rating in the longer term, which should imply<br />
ongoing focus on its credit profile.<br />
Source: Company data, <strong>Danske</strong> Markets<br />
Efficiency and earnings<br />
70%<br />
65%<br />
60%<br />
55%<br />
50%<br />
2005 2006 2007 2008 2009 2010<br />
Source: Company data, <strong>Danske</strong> Markets<br />
Earning assets mix, 2010<br />
Financial<br />
income<br />
13%<br />
Fee and<br />
comm.<br />
24%<br />
Cost/income<br />
Other<br />
income<br />
10%<br />
Recurring earnings power, RHS<br />
Source: Company data, <strong>Danske</strong> Markets<br />
Net<br />
interest<br />
income<br />
43%<br />
2.2%<br />
1.8%<br />
1.4%<br />
1.0%<br />
We remain constructive on SEB and have a BUY recommendation on the name, as it<br />
continues to trade at a discount to Nordea, DnB and Handelsbanken. We remain<br />
cautious on the hybrid 9.25% Tier 1 as it has a regulatory par call, which we think<br />
SEB is likely to take advantage of by 2013. Taking this into consideration, we do not<br />
consider the spread generous (ASW of 175bp if called at the beginning of 2013). See<br />
list of instrument prices at the end of this book.<br />
44 | 13 April 2011<br />
www.danskeresearch.com
<strong>Scandi</strong> Handbook<br />
Financial data SEB<br />
P&L (SEKm) 2006 2007 2008 2009 2010<br />
Net interest income 14,281 15,998 18,710 18,046 16,010<br />
Fees and commissions 16,146 17,051 15,254 13,285 14,160<br />
Net result from fin. transactions 4,036 3,239 2,970 4,488 3,166<br />
Other income 4,284 4,152 4,206 5,756 3,543<br />
Total revenue 38,747 40,440 41,140 41,575 36,879<br />
Personnel costs 14,363 14,921 16,241 13,786 14,004<br />
Other costs 7,221 6,131 7,642 6,740 7,303<br />
Depreciation and amortisation 883 1,354 1,524 4,672 1,880<br />
Total costs 22,467 22,406 25,407 25,198 23,187<br />
Pre-provision income (PPI) 16,280 18,034 15,733 16,377 13,692<br />
Loan losses and provisions 718 1,016 3,268 12,030 1,837<br />
Operating profit (core earnings) 15,562 17,018 12,465 4,347 11,855<br />
Non-recurring items 0 0 6 -681 -2,536<br />
Pre-tax income 15,562 17,018 12,471 3,666 9,319<br />
Tax 2,939 3,376 2,421 2,482 2,521<br />
Net income 12,623 13,642 10,050 1,184 6,798<br />
Adjusted net income 12,605 13,618 8,074 1,805 9,295<br />
Balance sheet (SEKm) 2006 2007 2008 2009 2010<br />
Due from cent banks & credit instns. 191,792 359,883 311,215 368,049 250,676<br />
Lending to general public 950,861 1,067,341 1,296,777 1,187,837 1,074,879<br />
Securities 733,149 833,179 800,566 670,921 686,167<br />
Earning assets 1,875,802 2,260,403 2,408,558 2,226,807 2,011,722<br />
Other assets 58,639 84,059 102,144 81,420 168,099<br />
Total assets 1,934,441 2,344,462 2,510,702 2,308,227 2,179,821<br />
Deposits from the general public 641,758 750,481 841,034 801,088 711,541<br />
Issued securities incl. cov. bonds 388,822 510,564 525,219 456,043 530,483<br />
Subordinated debt ex hybrid 35,906 33,089 38,859 20,140 10,959<br />
Hybrid securities (Tier 1) 7,543 10,900 12,371 16,223 14,593<br />
Equity 67,267 76,719 83,729 99,669 99,543<br />
Risk weighted assets (RWA) 741,000 841,974 986,034 795,000 716,126<br />
Key ratios 2006 2007 2008 2009 2010<br />
Net interest margin 0.8% 0.8% 0.8% 0.8% 0.8%<br />
Recurring earnings power (1) 2.3% 2.3% 1.7% 1.8% 1.8%<br />
Return on ave. assets (before tax) 0.7% 0.6% 0.4% 0.0% 0.3%<br />
Return on average equity before tax 25.1% 23.6% 15.5% 4.0% 9.4%<br />
Return on average equity after tax 20.3% 18.9% 12.5% 1.3% 6.8%<br />
Cost/income 58.0% 55.4% 61.8% 60.6% 62.9%<br />
Problem loans/Total loans 0.9% 0.8% 1.1% 2.4% 2.3%<br />
Loan loss provisions/Total loans 0.1% 0.1% 0.3% 1.0% 0.2%<br />
Loan loss reserves/Problem loans 75.1% 76.1% 66.0% 64.9% 65.8%<br />
Loan loss reserves/Pre-prov. income 39.3% 35.4% 58.4% 113.3% 116.6%<br />
Avg. cust. deposits/avg. tot. funding 43.2% 44.0% 44.5% 46.4% 47.7%<br />
Market funds/total funding 53.0% 54.1% 52.1% 49.7% 48.7%<br />
Avg. gross loans/avg. cust. deposits 153% 145% 149% 151% 150%<br />
Lending growth 5.5% 12.2% 21.5% -8.4% -9.5%<br />
Payout ratio 32.7% 0.0% 0.0% 172.0% 48.3%<br />
Core capital ratio incl. hybrid 8.2% 8.6% 8.4% 12.8% 14.2%<br />
Core capital ratio ex hybrid 7.2% 7.3% 7.1% 10.7% 12.2%<br />
Total capital ratio 11.5% 11.0% 10.6% 13.5% 13.8%<br />
Source: Company data, <strong>Danske</strong> Fixed Income Credit Research<br />
P&L (SEK m) Q4 09 Q1 10 Q2 10 Q3 10 Q4 10<br />
Net interest income 3,332 3,542 3,762 4,180 4,526<br />
Fees and commissions 3,587 3,194 3,673 3,387 3,906<br />
Net result from fin. trans. & trading 939 950 977 727 512<br />
Pre-provision income (PPI) 3,844 3,104 3,317 3,406 3,877<br />
Loan losses -3,064 -1,813 -639 196 419<br />
Net profit 281 674 1,986 581 3,503<br />
Lending to general public 1,187,837 1,203,833 1,226,476 1,088,736 1,074,879<br />
Net interest margin 0.6% 0.6% 0.7% 0.8% 0.9%<br />
Recurring earning power (1) 1.9% 1.5% 1.6% 1.7% 2.0%<br />
Cost/income 58.3% 64.5% 64.0% 61.7% 61.4%<br />
Problem loans/Total loans 2.4% 2.3% 2.2% 2.4% 2.3%<br />
Loan loss ratio(% ann.) 1.0% 0.61% 0.21% -0.07% -0.15%<br />
Leverage ratio (core capital/tot. assets) 4.4% 4.4% 4.4% 4.5% 4.7%<br />
Core capital ratio (Tier 1) 12.8% 12.4% 12.4% 12.7% 12.8%<br />
Total capital ratio (Tier 1 + Tier 2) 13.5% 13.1% 12.6% 12.7% 12.4%<br />
Source: Company data, <strong>Danske</strong> Fixed Income Credit Research<br />
45 | 13 April 2011<br />
www.danskeresearch.com
<strong>Scandi</strong> Handbook<br />
Swedbank<br />
Company overview<br />
Swedbank is Sweden’s fourth largest banking group in terms of assets. The bank was<br />
established in 1997 as the result of a merger between Sparebanken Sverige and<br />
Föreningsbanken. Swedbank operates the widest distribution network in Sweden and<br />
enjoys a very strong domestic market share in retail banking, financial services (particularly<br />
in mortgage finance through Swedbank Mortgage, previously known as<br />
Spintab), asset management (through Robur) and retail deposits. Swedbank is relatively<br />
stronger in rural areas. The total market share in Sweden is around 18%, but<br />
within mortgage lending Swedbank’s market share is over 22%.<br />
Swedbank has a client base of 680,000 corporate customers and more than nine million<br />
private clients, over 50% of whom are resident in the Baltic countries. In addition,<br />
the bank has 1.7 million customers either through joint enterprises or alliances<br />
serviced by over 260 branches of partly-owned and independent savings banks in<br />
Sweden.<br />
In 2005, Swedbank acquired the remaining 40% of shares in Hansapank (Hansa<br />
<strong>Bank</strong>), representing a significant entry into the Baltic market. In addition, it finalised<br />
the acquisition of the 13th largest Ukrainian bank, Tas-Kommerzbank, for USD735m<br />
in July 2007. Swedbank’s largest shareholders are Folksam (a Swedish insurance<br />
company) and the Association of Savings <strong>Bank</strong>s, with 9.4% and 7.4% of voting<br />
rights respectively.<br />
Key credit considerations<br />
Large albeit decreasing exposure to Baltic countries<br />
Due to its ownership of subsidiaries in the Baltic countries (formerly operated under<br />
the Hansapank brand name), Swedbank enjoys a very strong foothold in the Baltic<br />
region. The Baltic countries experienced a severe economic downturn in 2008 and<br />
2009. Unemployment increased dramatically and the housing bubble burst. In 2010,<br />
a remarkable turnaround took place and any imminent risk of devaluation faded. In<br />
this respect, note that Estonia adopted the euro at the beginning of 2011, thereby<br />
removing any risk of a devaluation.<br />
Each Baltic subsidiary is a leading bank in its respective market. Swedbank’s combined<br />
market share in the three Baltic markets exceeds 30%, with the highest percentage<br />
being in Estonia it has close to 50% of the total market.<br />
HOLD<br />
Sector: Financials<br />
Corporate ticker: SWEDA<br />
Equity ticker: SWEDA SS<br />
Market cap: SEK110bn<br />
Ratings:<br />
S&P rating: A (stable)<br />
Moodys rating: A2 (under review for<br />
upgrade)<br />
Fitch rating: Not rated<br />
Analysts:<br />
Henrik Arnt<br />
henrik.arnt@danskebank.dk<br />
+45 4512 8504<br />
Thomas Hovard<br />
thomas.hovard@danskebank.dk<br />
+45 4512 8505<br />
Key credit issues<br />
Strengths:<br />
• Robust Swedish franchise<br />
• Strong capitalisation<br />
Challenges:<br />
• Exposure to Baltic countries<br />
• Profitability under pressure<br />
• Low geographical diversification<br />
Source: <strong>Danske</strong> Markets<br />
Overall, the Baltics accounted for 10% of group lending by the end of 2010 (down<br />
from 14% at end-2009), equivalent to SEK131bn, of which Estonia accounts for<br />
44%. The adoption by the euro in Estonia as of the beginning of this year has lowered<br />
risks in the Baltics and improved visibility. Overall, the Baltic exposure is becoming<br />
less of a credit driver for Swedbank than previously.<br />
Swedish economy is among Europes strongest<br />
The domestic economic development is central to the prospects for Swedbank (Sweden<br />
accounts for more than 80% of the loan book). The domestic Swedish economy<br />
fared relatively well throughout the financial crisis and recently a strong recovery has<br />
taken place. The most recent GDP numbers showed that in the fourth quarter of 2010<br />
the Swedish economy grew by 7.3% y/y. The macroeconomic backdrop is therefore<br />
highly supportive for the banking system.<br />
During the recent crisis, the central bank aggressively lowered its target rate. As the<br />
bulk of Swedish mortgages are tied to the short-term rate (1M or 3M STIBOR), this<br />
corresponded to a expansionary economic policy to the benefit of the domestic economy<br />
and house prices in particular. We believe that this stimulus via the steep decline<br />
46 | 13 April 2011<br />
www.danskeresearch.com
<strong>Scandi</strong> Handbook<br />
in short-term interest rates is a key explanation for the low Swedish loan losses in the<br />
past few years. Naturally, the transmission also works the other way, i.e. when rates<br />
go up it will be felt with immediate effect, and the Riksbank started hiking its policy<br />
rate in September. So far, the level remains low and by the end of the year the repo<br />
rate is expected by our macro team to be 2.75% and therefore by no means at an<br />
alarming level. In fact, the modest increases in the policy rate are probably net positive<br />
for the banks, as it allows them to increase deposit margins without really jeopardising<br />
asset quality.<br />
In the short to medium term, we therefore fail to see any major negative credit triggers.<br />
Our main concern would be if we see inflationary signs in Sweden, as this could<br />
result in a more aggressive hiking path from the Riksbank.<br />
Capitalisation<br />
In Q4 10, Swedbank further increased its capitalisation. Under full Basel II, the Tier<br />
1 ratio increased to 15.2% and the current capital level is therefore strong. In connection<br />
with the Q4 report, Swedbank has now communicated a Tier 1 target of 13%, to<br />
be in force until 2013. On a longer horizon, the Tier 1 ratio should not fall below<br />
10%.<br />
Asset quality<br />
For the first time since the financial crisis, Swedbank made a reversal of provisions<br />
in Q4 10. Loan loss reversals are also likely for Q1 11 (see section on next page on<br />
one-off reversals), and asset quality is well supported in the short to medium-term.<br />
Furthermore, the level of impaired loans is coming down, from 3.2% in Q3 10 to<br />
2.9% in Q4 10. Almost two thirds of impaired loans stem from the Baltic countries.<br />
With the importance of the Baltics diminishing, Swedbank is becoming more of a<br />
pure Swedish play, compared with its peers that have bigger operations in the other<br />
Nordic countries. This has been beneficial for the bank so far, as Sweden has been<br />
the European sweet spot when it comes to asset quality. However, it also makes<br />
Swedbank less diversified than its peers, which we consider a slight credit weakness<br />
going forward.<br />
Liquidity and funding<br />
Swedbank is a retail-orientated bank with a substantial domestic branch network<br />
providing access to a relatively stable source of deposits, representing more than one<br />
third of total funding by Q4 10. The loans to deposits ratio has decreased from 2.5x<br />
in 2009 to 2.4x in 2010. The reason for the relatively large gap is the mortgage loan<br />
book, which is financed through issuance of covered bonds.<br />
Swedbank has worked hard on extending its debt maturity profile and increasing its<br />
liquidity reserves. Since year-end 2009, the average maturity of wholesale funding<br />
has increased from 22 to 27 months.<br />
Current performance drivers<br />
Q4 10 report<br />
In Q4 10, Swedbank delivered a solid report. Both net interest and commission income<br />
were ahead of expectations, as was trading income. The improvement in NII of<br />
14% came despite the loan book being reduced by 2% and is therefore a reflection of<br />
improved margins. Lending in Eastern Europe has been reduced by more than<br />
SEK100bn during the past two years. Corporate lending has also decreased, but this<br />
has been largely offset by an increase in residential mortgage lending. Overall, the<br />
risk profile of Swedbank has therefore undergone a material improvement. Naturally,<br />
it is not viable to continue to shrink the loan book, but this should be of more concern<br />
to the equity investors. Considering the strong capitalisation and the much better<br />
macroeconomic visibility, we believe that Swedbank is likely to start growing its<br />
47 | 13 April 2011<br />
Capitalisation<br />
14%<br />
12%<br />
10%<br />
8%<br />
6%<br />
4%<br />
2%<br />
0%<br />
Source: Company data, <strong>Danske</strong> Markets<br />
Loss ratio (% annualised)<br />
2.5%<br />
2.0%<br />
1.5%<br />
1.0%<br />
0.5%<br />
0.0%<br />
-0.5%<br />
2006 2007 2008 2009 2010<br />
Core capital ratio Total capital ratio<br />
Q1 09 Q3 09 Q1 10 Q3 10<br />
Source: Company data, <strong>Danske</strong> Markets<br />
Funding mix, 2010<br />
Market<br />
funds<br />
46%<br />
Sub debt<br />
Equity<br />
2%<br />
6%<br />
Retail<br />
deposits<br />
21%<br />
Interbank<br />
9%<br />
Source: Company data, <strong>Danske</strong> Markets<br />
Corporate<br />
deposits<br />
16%<br />
www.danskeresearch.com
<strong>Scandi</strong> Handbook<br />
business again. Net income came in at SEK2.75bn, up from SEK2.6bn in the previous<br />
quarter and a net loss of SEK1.8bn in Q4 09.<br />
Positive one-off items in Q1 2011<br />
Swedbank had an outstanding repo of USD1.35bn with Lehman Brothers by the time<br />
Lehman defaulted. After Lehman’s bankruptcy, Swedbank took possession of the<br />
approximately 50 commercial real estate loans that served as underlying security for<br />
the repo. Swedbank and the US <strong>Bank</strong>ruptcy Court supervising the Lehman Brothers<br />
Chapter 11 case agreed on the exchange of a number of loans. As a result, Swedbank<br />
will report one-off pre-tax income of USD114m (SEK720m). The remaining carrying<br />
amount of loans relating to the repo was USD940m (SEK6.0bn) as of 8 March 2011.<br />
Earning assets mix, 2010<br />
Due from<br />
banks<br />
11%<br />
Securities<br />
10%<br />
Retail<br />
45%<br />
At the same time, Swedbank reported recoveries for the period January-February<br />
2011 of approximately SEK540m, due to a further improvement in credit quality in<br />
the Baltic countries and Eastern Europe. This suggests that asset quality is well supported,<br />
and from a credit perspective we anticipate a strong Q1 11 report.<br />
Hawkish Swedish regulators supportive for credit quality<br />
In March, the Swedish regulators as well as the Minister of Finance communicated a<br />
rather hawkish stance on bank regulation. Sweden should move ahead of Basel III<br />
and regulatory core capital levels should increase by 1% annually in the next few<br />
years, thereby restricting the possibility for banks to pay large dividends. A core Tier<br />
1 level of 10% and a total capital ratio of 15% will be the target levels for regulation<br />
in Sweden. This is significantly above the Basel III minimum requirements.<br />
Furthermore, the central bank talked about higher risk weightings on Swedish mortgages,<br />
as this would be an effective way of curbing the high growth in mortgage<br />
lending that is currently taking place in Sweden. However, the Swedish FSA has<br />
communicated that they are not in favour of an increase in risk weights. Instead they<br />
prefer more rigorous stress testing as well as additional capital requirements through<br />
Pillar 2 (under Basel II).<br />
Overall, Swedish banks will face a need to act quite conservatively in the next few<br />
years, in order to further build up or protect capital levels. This is positive from a<br />
credit perspective. We also note the regulatory focus on the housing market. Last<br />
year, the LTV requirements for Swedish mortgages were lowered, and now the regulators<br />
want to increase the risk weighting. To us, this is a positive development as it<br />
reduces the risk of Sweden building up a housing bubble.<br />
Recommendation<br />
We believe that the CEO of Swedbank, Michael Wolf, can look back on a remarkable<br />
turnaround that has taken place under his watch. In our view, the risk profile of<br />
Swedbank today is very different from what it was a few years ago, and Sweden is<br />
set to become the most important credit driver for the bank, whereas it used to be the<br />
Baltics and Ukraine. Visibility has therefore improved substantially and the ongoing<br />
loan-loss recoveries at the beginning of the year support this. Overall, we are therefore<br />
comfortable with the name.<br />
Source: Company data, <strong>Danske</strong> Markets<br />
Efficiency and earnings<br />
62%<br />
60%<br />
58%<br />
56%<br />
54%<br />
52%<br />
50%<br />
48%<br />
46%<br />
44%<br />
Corporate<br />
34%<br />
Source: Company data, <strong>Danske</strong> Markets<br />
Revenue split, 2010<br />
Source: Company data, <strong>Danske</strong> Markets<br />
2.7%<br />
2.4%<br />
2.1%<br />
1.8%<br />
1.5%<br />
1.2%<br />
0.9%<br />
0.6%<br />
0.3%<br />
0.0%<br />
2006 2007 2008 2009 2010<br />
Recurring earnings power, RHS<br />
Cost/income<br />
Financial<br />
income<br />
8%<br />
Fees and<br />
comm.<br />
31%<br />
Other<br />
income<br />
7%<br />
Net<br />
interest<br />
income<br />
54%<br />
Swedbank has not been a frequent issuer of senior unsecured bonds in recent years –<br />
instead the bank has issued covered bonds. Furthermore, there are few subordinated<br />
bonds outstanding as Swedbank bought back some of the issues since it wanted to<br />
focus on core Tier 1 capital. We have a HOLD recommendation on Swedbank. See<br />
list of instrument prices at the end of this book.<br />
48 | 13 April 2011<br />
www.danskeresearch.com
<strong>Scandi</strong> Handbook<br />
Financial data Swedbank<br />
P&L (SEKm) 2006 2007 2008 2009 2010<br />
Net interest income 15,977 19,157 21,702 20,765 16,329<br />
Fees and commissions 8,869 9,880 8,830 7,825 9,525<br />
Net result from fin. transactions 2,738 1,691 2,351 2,770 2,400<br />
Other income 1,391 1,772 3,068 2,556 2,166<br />
Total revenue 28,975 32,500 35,951 33,916 30,420<br />
Personnel costs 8,560 9,792 9,142 9,201 9,392<br />
Other costs 5,920 6,222 7,944 7,758 7,300<br />
Depreciation and amortisation 659 705 999 1,338 1,587<br />
Total costs 15,139 16,719 18,085 18,297 18,279<br />
Pre-provision income (PPI) 13,836 15,781 17,866 15,619 12,141<br />
Loan losses and provisions -205 619 3,156 24,641 2,810<br />
Operating profit (core earnings) 14,041 15,162 14,710 -9,022 9,331<br />
Non-recurring items 222 424 -891 -439 624<br />
Pre-tax income 14,263 15,586 13,819 -9,461 9,955<br />
Tax 3,211 3,450 2,880 981 2,472<br />
Net income 11,052 12,136 10,939 -10,442 7,483<br />
Adjusted net income 10,880 11,996 12,290 -9,206 7,483<br />
Balance sheet (SEKm) 2006 2007 2008 2009 2010<br />
Due from cent. banks & credit instns. 201,431 174,014 185,574 130,010 183,526<br />
Lending to general public 946,319 1,135,287 1,287,424 1,290,667 1,187,226<br />
Securities 76,576 193,110 157,354 180,120 137,757<br />
Earning assets 1,224,326 1,502,411 1,630,352 1,600,797 1,508,509<br />
Other assets 128,663 105,573 181,338 193,890 207,172<br />
Total assets 1,352,989 1,607,984 1,811,690 1,794,687 1,715,681<br />
Deposits from the general public 400,035 458,375 508,456 504,424 534,237<br />
Issued securities incl. cov. bonds 561,208 673,116 593,365 703,258 686,519<br />
Subordinated debt ex hybrid 28,859 32,422 35,046 28,765 20,272<br />
Hybrid securities (Tier 1) 5,566 7,314 9,709 9,218 6,915<br />
Equity 59,974 68,008 86,230 89,670 94,897<br />
Risk weighted assets (RWA) 726,712 822,363 916,112 783,593 748,955<br />
Key ratios 2006 2007 2008 2009 2010<br />
Net interest margin 1.4% 1.4% 1.4% 1.3% 1.1%<br />
Recurring earnings power (1) 2.1% 2.0% 2.1% 1.8% 1.6%<br />
Return on average assets (bef. tax) 0.9% 0.8% 0.6% -0.6% 0.4%<br />
Return on average equity before tax 25.1% 24.4% 17.9% -10.8% 10.8%<br />
Return on average equity after tax 19.5% 19.0% 14.2% -11.9% 8.1%<br />
Cost/income 52.2% 51.4% 50.3% 53.9% 60.1%<br />
Problem loans/Total loans 0.1% 0.2% 0.6% 3.1% 2.9%<br />
Loan loss provisions / Total loans 0.0% 0.1% 0.2% 1.9% 0.2%<br />
Loan loss reserves/Problem loans 385.3% 212.1% 85.9% 61.4% 62.7%<br />
Loan loss reserves/Pre-prov. income 23.0% 23.4% 35.6% 157.8% 179.5%<br />
Avg. cust. deposits/avg. tot. funding 34.8% 34.9% 34.6% 34.4% 36.3%<br />
Market funds/total funding 61.2% 62.5% 61.6% 62.1% 57.5%<br />
Avg. gross loans/avg. cust. deposits 239.4% 242.5% 250.6% 254.5% 238.6%<br />
Lending growth 15.1% 20.0% 13.4% 0.3% -8.0%<br />
Payout ratio 39.1% 38.7% 0.0% 0.0% 0.5%<br />
Core capital ratio incl. hybrid 6.5% 6.2% 8.1% 10.4% 11.0%<br />
Core capital ratio excl. hybrid 5.8% 5.3% 7.0% 9.2% 10.1%<br />
Total capital ratio 9.8% 9.3% 11.2% 13.5% 13.3%<br />
Source: Company data, <strong>Danske</strong> Fixed Income Credit Research<br />
P&L (SEK m) Q4 09 Q1 10 Q2 10 Q3 10 Q4 10<br />
Net interest income 4,702 4,023 3,799 3,980 4,527<br />
Fees and commissions 2,273 2,282 2,395 2,310 2,538<br />
Net result from fin. trans. & trading 262 647 822 574 357<br />
Pre-provision income (PPI) 3,559 3,130 3,189 3,195 3,241<br />
Loan losses -5,003 -2,210 -963 -120 483<br />
Net profit -1,804 536 1,567 2,591 2,750<br />
Lending to general public 1,290,667 1,214,007 1,239,104 1,214,302 1,187,226<br />
Net interest margin 1.2% 1.0% 0.9% 1.0% 1.2%<br />
Recurring earning power (1) 1.8% 1.6% 1.6% 1.7% 1.7%<br />
Cost/income 54.7% 58.4% 58.1% 57.1% 58.6%<br />
Problem loans/Total loans 3.1% 3.3% 3.4% 3.2% 2.9%<br />
Loss ratio (% ann.) 1.6% 0.7% 0.3% 0.0% -0.2%<br />
Leverage ratio (core cap./total assets) 4.6% 4.3% 4.3% 4.5% 4.8%<br />
Core capital ratio (Tier 1) 10.4% 10.3% 10.5% 10.8% 11.0%<br />
Total capital ratio (Tier 1 + Tier 2) 13.5% 13.4% 13.4% 13.3% 13.3%<br />
Source: Company data, <strong>Danske</strong> Fixed Income Credit Research<br />
49 | 13 April 2011<br />
www.danskeresearch.com
<strong>Scandi</strong> Handbook<br />
Sydbank<br />
Company overview<br />
Sydbank is a full-service Danish bank with a nationwide presence and a small international<br />
exposure. The bank’s headquarters are at Aabenraa in Southern Jutland,<br />
where it was established in 1970 through the merger of four local banks. Measured<br />
by the loan book, Sydbank is the fourth-largest bank in Denmark, with a market<br />
share of around 5% of the domestic banking market. In the core Jutland area,<br />
Sydbank’s market share is 20-25%, with 80% of its customers and 90% of its branch<br />
network based in this area. The bank operates through more than 100 branches in<br />
Denmark (plus three in Germany and a subsidiary bank in Switzerland) and has<br />
around 390,000 customers, including 32,000 corporates.<br />
The main business areas are Retail and Corporate banking, Sydbank Markets, Asset<br />
Management and Syd-Leasing. In addition, Sydbank has strategic ownership in<br />
<strong>Bank</strong>data (IT services) and <strong>Bank</strong>invest (asset management). Recently, Jyske <strong>Bank</strong><br />
joined <strong>Bank</strong>data, which should lead to cost savings for Sydbank as <strong>Bank</strong>data’s costs<br />
will be shared among more members. Mortgage lending is issued in strategic partnership<br />
with Totalkredit/Nykredit and DLR, while life insurance is offered in<br />
co-operation with Topdanmark and PFA. These partnerships enable the bank to provide<br />
a wide selection of banking services to customers.<br />
Key credit considerations<br />
Independent bank<br />
Sydbank has around 140,000 shareholders, with customers holding around one-third<br />
of the shares. The largest shareholder is Nykredit, which owns more than 5% of the<br />
shares but does not have control of Sydbank. Sydbank has a clear strategy to remain<br />
an independent bank, and with strict ownership rules (voting restrictions) and a high<br />
proportion of shareholders with relatively low stakes, it is effectively protected from<br />
a hostile takeover and from outside influence. Going forward, Sydbank wants to<br />
consolidate its nationwide presence both by expanding its branch network and its<br />
electronic availability, supported by broad market communication.<br />
Recent rating changes at Sydbank (A1/NR/NR)<br />
In March 2009, Moody’s downgraded the Danish banks’ subordinated debt by two<br />
notches to A3 due to the lack of government support for these instruments. In February<br />
2010, Moody’s downgraded Danish hybrid securities by one notch as the rating<br />
agency finalised its revision of the guidelines for rating bank-subordinated debt,<br />
resulting in a subordinated rating of Baa1 for Sydbank.<br />
DATA<br />
Sector: Financials<br />
Corporate ticker: SYDBDC<br />
Equity ticker: SYDB DC<br />
Market cap: DKK10.4bn<br />
Ratings:<br />
S&P rating: Not rated<br />
Moodys rating A1 / NW<br />
Fitch rating: Not rated<br />
Analysts:<br />
Thomas Hovard<br />
Thomas.hovard@danskebank.dk<br />
+45 4512 8505<br />
Henrik Arnt<br />
Henrik.arnt@danskebank.dk<br />
+45 4512 8504<br />
Key credit issues<br />
Strengths:<br />
• High capitalisation.<br />
• Sound profitability.<br />
• Conservative risk management.<br />
Challenges:<br />
• Limited geographic diversification.<br />
• M&A risk.<br />
Source: <strong>Danske</strong> Markets<br />
Following the collapse of Amagerbanken and the resulting haircuts on senior unsecured<br />
debt, Moody’s changed its stance on Denmark from seeing it as a high-support<br />
country to being a low-support one. Consequently, in February 2011, government<br />
support was removed from all but the four largest banks. The expected funding pressure<br />
has led Moody’s to put all Danish banks’ stand-alone ratings on negative outlook<br />
(also spurred by the very modest macroeconomic recovery in Denmark).<br />
Moody’s has put Sydbank’s A1 rating on Negative Watch as the agency is evaluating<br />
the likelihood of the bank being ‘too big to fail’ (currently, systemic support provides<br />
Sydbank’s rating with an extra notch, and we expect this to continue). Importantly,<br />
Sydbank’s stand-alone rating of C+ (BFSR) has not been downgraded.<br />
50 | 13 April 2011<br />
www.danskeresearch.com
<strong>Scandi</strong> Handbook<br />
Asset quality<br />
In 2009, the loan book decreased by 9% and another 4% in 2010, more or less in line<br />
with the sector (corporates and repos being the area of reduction).<br />
Sydbank’s lending portfolio is almost entirely concentrated on Danish customers, but<br />
it is well diversified by industry, with the Finance and Insurance (17%) and Real<br />
Estate (10%) sectors being the largest industry exposures. Compared with other<br />
Danish banks, Sydbank’s exposure to the construction and developer segment is<br />
limited, as it experienced significant difficulties in this segment in the mid 1990s.<br />
The bank has a strong corporate lending profile (65% of lending in 2010), which to<br />
some extent is due to SMEs with retail-like characteristics. The total of the largest<br />
credit exposures was reduced markedly to 17% of total capital at the end of 2009,<br />
from 134% in 2005 – a level significantly below the sector average and a positive<br />
credit factor. In 2010, the exposure increased to 54%. According to Sydbank all of<br />
this exposure is towards large financial institutions. In recent years, Sydbank has<br />
been developing internal models for customers’ credit ratings to gauge credit risk,<br />
monitor credit deterioration and price and assess concentration risk. Sydbank uses the<br />
advanced IRB for households and the Foundation IRB for corporates.<br />
Like other Danish banks, asset quality deteriorated rapidly during 2009, and 2010 has<br />
not shown a meaningful improvement. In Q4 annualised loan losses increased to<br />
around 2% of total lending. On the other hand, we consider Sydbank’s provisioning<br />
policy to be conservative, and the bank has indicated that it will seek to build up its<br />
provisioning account over the next few years (ie, it has a ‘hidden’ buffer, if the provisioning<br />
policy is in fact conservative).<br />
Sydbank comfortably passed the European stress test that was carried out in July<br />
2010, and which showed that Sydbank has no exposure to sovereign debt in Southern<br />
Europe and Ireland.<br />
Liquidity and funding<br />
In recent years, Sydbank’s funding base has been stable and diversified, with 50-55%<br />
stemming from retail deposits, which is in line with the average of other mediumsized<br />
Danish banks. The bank’s dependence on capital markets and money markets,<br />
measured by market funds’ reliance, has grown in recent years. Sydbank has a global<br />
MTN programme in place, which was last used in September 2010 in a EUR1.0bn<br />
2Y bond issue.<br />
Sydbank has a EUR500m senior unsecured bond maturing in June 2011 and the bank<br />
has stated that it intends to test the markets following the Q1 results. The collapse of<br />
the small Danish bank Amagerbanken and the Danish authorities’ willingness,<br />
through bank package 3, to impose haircuts on senior unsecured funding has put<br />
some stress on the funding situation for Danish banks. We regard Sydbank as strong<br />
enough and large enough to be able to continue to attract foreign funding in line with<br />
2010, when the bank issued a EUR1bn 2-year benchmark issue (although any new<br />
issue would probably be at a higher price).<br />
In addition, Sydbank has set requirements concerning its ability to withstand a runoff<br />
of capital market financing, defined in terms of the interbank market and Global<br />
MTN issues, while at the same time financing normal growth in loans and advances.<br />
The time-frame is 12 months and is based on the liquidity value of group assets (eg,<br />
central bank eligible securities).<br />
Note that Sydbank has not taken up any state hybrid capital or any state-guaranteed<br />
funding.<br />
Overall, we view Sydbank’s funding and liquidity risk policies as satisfactory and<br />
prudent. Considering the current general tough environment for wholesale funding,<br />
the relatively high retail deposit share of funding should benefit Sydbank going forward.<br />
51 | 13 April 2011<br />
Loss ratio (% annualised)<br />
2,5%<br />
2,0%<br />
1,5%<br />
1,0%<br />
0,5%<br />
0,0%<br />
-0,5%<br />
-1,0%<br />
-1,5%<br />
Source: Company data, <strong>Danske</strong> Markets<br />
Earnings and efficiency<br />
80%<br />
70%<br />
60%<br />
50%<br />
40%<br />
30%<br />
20%<br />
10%<br />
0%<br />
Q3 07 Q1 08 Q3 08 Q1 09 Q3 09 Q1 10 Q3 10<br />
2005 2006 2007 2008 2009 2010<br />
Recurring earnings power, RHS<br />
Cost/income<br />
Source: Company data & <strong>Danske</strong> Markets<br />
Funding mix 2009<br />
Market<br />
funds<br />
6%<br />
Interbank<br />
34%<br />
Equity<br />
Sub debt 7%<br />
2%<br />
Source: Company data, <strong>Danske</strong> Markets<br />
Deposits<br />
51%<br />
www.danskeresearch.com<br />
2,7%<br />
2,4%<br />
2,1%<br />
1,8%<br />
1,5%<br />
1,2%<br />
0,9%<br />
0,6%<br />
0,3%<br />
0,0%
<strong>Scandi</strong> Handbook<br />
Capitalisation<br />
Sydbank’s capital ratios are strong and have increased in recent years. Previously, the<br />
bank targeted core capitalisation of 8% and a solvency ratio of 10%. Following the<br />
Basel II implementation and in the context of the capital relief, Sydbank has adjusted<br />
its capitalisation targets. In 2009, Sydbank issued a new total capital target of<br />
DKK9.9bn, corresponding to a solvency ratio of 12.7%. Furthermore, Sydbank’s<br />
target for equity Tier-1 capital is a minimum of 80% of total capital. Sydbank reports<br />
an individual solvency requirement of 9.0%. The total capital ratio was 15.4% at end-<br />
2010 and Tier 1 capital was 14.3% (11.9% excluding hybrids). Sydbank more than<br />
fulfils its targets, and, given the risk profile of the bank, we view the capitalisation as<br />
strong.<br />
Current performance drivers<br />
Q4 10 earnings report<br />
After decent results in the previous quarter, the Q4 numbers were a disappointment –<br />
especially from a credit perspective, as loan losses increased, leading to an overall<br />
net loss of DKK25m for the quarter (compared to a Q3 10 net profit of DKK185m).<br />
The more or less neutral development in net interest and commission income was<br />
overshadowed by a significant uptick in loan losses. For the quarter loan losses came<br />
in at DKK456m, up 47% q/q and 30% y/y. This corresponds to an annualised loan<br />
loss ratio of 2.2%, significantly up from the levels we saw in the previous quarters.<br />
According to management the reason for the higher losses is that the bank has decided<br />
to take a more conservative approach. In this respect it is worth noticing that<br />
Sydbank changed its CEO in the middle of last year and part of the increase in the<br />
loan losses may therefore be attributed to her wanting to start from scratch in 2011.<br />
Sydbank’s loan losses in Q4 have been materially above the loan losses taken in<br />
other quarters, suggesting that management is generally examining the loan book<br />
more thoroughly.<br />
M&A risk<br />
Sydbank did not take advantage of the possibility of issuing a hybrid state loan under<br />
the second Danish <strong>Bank</strong> Package. Instead, in mid-September 2009 Sydbank carried<br />
out a successful rights issue, increasing the Tier 1 ratio by 1.2 percentage points. The<br />
main reason for the capital increase was to renounce <strong>Bank</strong> Package II capital. However,<br />
Sydbank also has ambitions to grow its business by participating in the consolidation<br />
process in Denmark (which we expect to occur at a fast pace due to the funding<br />
gap in the Danish banking sector). In particular, Sydbank has stated that it wants<br />
to add to its presence in Eastern Denmark (Copenhagen area), where its market share<br />
is much lower than in Jutland. However, so far nothing has materialised. In our view,<br />
any acquisition would be a bolt-on rather than a larger-scale deal.<br />
Summary<br />
Throughout the financial crisis, Sydbank has performed strongly. We admit the Q4<br />
report was poor, but we still believe that this was mainly because the new CEO wants<br />
to have a clean book going into 2011. Strict underwriting standards, low exposure to<br />
commercial property and a very low number of large customers all support the asset<br />
quality. Furthermore, the bank is well capitalised.<br />
Capitalisation<br />
18%<br />
16%<br />
14%<br />
12%<br />
10%<br />
8%<br />
6%<br />
4%<br />
2%<br />
0%<br />
Source: Company data and <strong>Danske</strong> Markets<br />
Revenue split 2010<br />
Fees and<br />
comm<br />
24%<br />
2005 2006 2007 2008 2009 2010<br />
Source: Company data, <strong>Danske</strong> Markets<br />
Earning assets mix 2010<br />
Securities<br />
29%<br />
Due from<br />
banks<br />
6%<br />
Financial<br />
income<br />
9%<br />
Core capital ratio<br />
Other<br />
income<br />
1%<br />
Total capital ratio<br />
Retail<br />
22%<br />
Corporate<br />
43%<br />
Source: Company reports, <strong>Danske</strong> Markets<br />
Net interest<br />
income<br />
66%<br />
As <strong>Danske</strong> <strong>Bank</strong> is currently involved in a bond transaction for Sydbank, we have no<br />
recommendation on the name.<br />
52 | 13 April 2011<br />
www.danskeresearch.com
<strong>Scandi</strong> Handbook<br />
Financial data Sydbank<br />
P&L (DKKm) 2006 2007 2008 2009 2010<br />
Net interest income 1,886 2,127 2,765 3,405 3,218<br />
Fees and commissions 1,178 1,282 1,084 963 1,146<br />
Net result from financial transactions 682 345 -71 667 420<br />
Other income 50 57 174 54 45<br />
Total revenue 3,796 3,811 3,952 5,089 4,829<br />
Personnel costs 1,186 1,263 1,452 1,454 2,353<br />
Other costs 742 815 997 887 0<br />
Depreciation and amortization 111 136 187 135 153<br />
Total costs 2,039 2,214 2,636 2,476 2,506<br />
Pre-provision income (PPI) 1,757 1,597 1,316 2,613 2,323<br />
Loan losses and provisions -171 -568 545 1,195 1,556<br />
Operating profit (core earnings) 1,928 2,165 771 1,418 767<br />
Non-recurring items 123 92 40 -420 -209<br />
Pre-tax income 2,051 2,257 811 998 558<br />
Tax 537 547 205 217 147<br />
Net income 1,514 1,710 606 781 411<br />
Adjusted net income 1,394 1,655 583 1,224 622<br />
Balance sheet (DKKm) 2006 2007 2008 2009 2010<br />
Due from central banks and credit institutions 16,279 19,127 12,917 14,499 8,382<br />
Lending to general public 73,183 83,027 95,758 87,474 83,752<br />
Securities 14,271 17,456 28,064 38,194 36,915<br />
Earning assets 103,733 119,610 136,739 140,167 129,049<br />
Other assets 11,025 12,713 19,236 17,654 21,794<br />
Total assets 114,758 132,323 155,975 157,821 150,843<br />
Deposits from the general public 49,991 66,037 75,007 68,780 64,161<br />
Issued securities incl. covered bonds 10,049 10,076 10,096 8,622 11,242<br />
Subordinated debt ex hybrid 2,536 2,706 2,837 1,738 945<br />
Hybrid securities (Tier 1) 939 1,123 1,382 1,386 1,384<br />
Equity 6,349 6,697 7,088 9,118 9,554<br />
Risk weighted assets (RWA) 78,260 81,917 74,608 77,909 73,716<br />
Key ratios 2006 2007 2008 2009 2010<br />
Net interest margin 2.1% 1.9% 2.2% 2.5% 2.4%<br />
Recurring earnings power (1) 2.4% 2.0% 1.7% 3.4% 3.1%<br />
Return on average assets (before tax) 1.4% 1.4% 0.4% 0.5% 0.3%<br />
Return on average equity before tax 36.2% 34.6% 11.8% 12.3% 6.0%<br />
Return on average equity after tax 26.7% 26.2% 8.8% 9.6% 4.4%<br />
Cost/income 53.7% 58.1% 66.7% 48.7% 51.9%<br />
Problem loans/Total loans 0.1% 0.1% 2.0% 3.6% 3.6%<br />
Loan loss provisions/Total loans -0.2% -0.7% 0.6% 1.4% 1.9%<br />
Loan loss reserves/Problem loans 1518.8% 721.8% 56.5% 56.9% 58.4%<br />
Loan loss reserves/Pre-provision income 83.0% 56.0% 84.0% 68.0% 75.9%<br />
Avg. customer deposits/avg. total funding 55.4% 59.1% 60.1% 56.6% 54.5%<br />
Market funds/total funding 41.5% 35.7% 39.3% 42.3% 42.2%<br />
Avg. gross loans/avg. customer deposits 143.1% 134.6% 126.8% 127.4% 128.8%<br />
Lending growth 20.5% 13.5% 15.3% -8.7% -4.3%<br />
Payout ratio 13.9% 11.9% 0.0% 0.0% 0.0%<br />
Core capital ratio incl. hybrid 9.0% 8.9% 10.8% 13.1% 14.3%<br />
Core capital ratio ex hybrid 7.8% 7.5% 9.2% 11.3% 12.4%<br />
Total capital ratio 11.8% 11.9% 14.7% 15.2% 15.4%<br />
Source: Company data, <strong>Danske</strong> Fixed Income Credit Research<br />
P&L (DKK m) Q4 09 Q1 10 Q2 10 Q3 10 Q4 10<br />
Net interest income 844 837 828 785 768<br />
Fees and commissions 275 291 284 288 283<br />
Net result from financial transactions & trading 172 204 41 190 -15<br />
Pre-provision income (PPI) 703 671 538 680 434<br />
Loan losses -350 -308 -309 -311 -456<br />
Net profit 212 169 82 185 -27<br />
Lending to general public 87,474 80,665 80,682 80,121 83,752<br />
Net interest margin 2.5% 2.5% 2.6% 2.4% 2.4%<br />
Recurring earning power (1) 3.6% 3.4% 2.7% 3.5% 2.3%<br />
Cost/income 45.8% 50.1% 53.8% 46.5% 58.6%<br />
Problem loans/Total loans 3.6% 4.4% 4.7% 4.5% 3.6%<br />
Loss ratio (% ann.) 1.6% 1.5% 1.5% 1.5% 2.2%<br />
Leverage ratio (core capital/total assets) 6.5% 7.0% 6.8% 6.9% 7.0%<br />
Core capital ratio (Tier 1) 13.1% 13.1% 13.5% 14.1% 14.3%<br />
Total capital ratio (Tier 1 + Tier 2) 15.2% 15.3% 15.7% 16.1% 15.4%<br />
Source: Company data, <strong>Danske</strong> Fixed Income Credit Research<br />
53 | 13 April 2011<br />
www.danskeresearch.com
<strong>Scandi</strong> Handbook<br />
Volvofinans <strong>Bank</strong><br />
Company overview<br />
Established in 1959, Volvofinans <strong>Bank</strong> AB is the captive finance company of the<br />
Volvo dealership network in Sweden. It is the country’s largest car and truck finance<br />
company and has historically had a strong market share in vehicle financing. According<br />
to Moody’s, the company finances 55% of all new Volvo and Renault cars and<br />
25% of new Volvo trucks in Sweden. Its nearest competitor is Nordea Bilfinans. Its<br />
main aim is to promote the sale of Volvo and Renault products through attractive and<br />
competitive financing of cars, trucks and buses sold through the 69 Swedish Volvo<br />
dealerships (200 outlets). Volvo car dealers are the only Swedish distributors of<br />
Renault and Ford cars and enjoy a strong market position in the Swedish market,<br />
with a combined Volvo, Renault and Ford market share of close to 30%. Volvofinans<br />
offers a wide range of financing solutions, including leasing, hire purchase and credit<br />
card services through Volvo Card and car fleet management.<br />
Volvofinans was initially a joint venture between AB Volvo and Volvo dealers in Sweden.<br />
In 2001, AB Volvo was replaced by the Ford Motor Company when the latter bought<br />
the Volvo Car Corporation. In July 2007, the government-controlled Sixth Swedish National<br />
Pension Fund (AP6) bought 40% of the shares from Ford. The Volvofinans Group<br />
consists of Volvofinans, a credit card company called Volvofinans Konto and an IT service<br />
provider, Volvofinans IT. As with all captive financing companies, it relies strongly<br />
on its parent’s brand names and business development, but Volvofinans has legal status as<br />
a financial company. On 15 July 2008 Volvofinans was granted permission by the Swedish<br />
FSA to conduct banking activities under the name Volvofinans <strong>Bank</strong>.<br />
Key credit considerations<br />
Ford Credit is no longer an owner<br />
On 17 July 2007 the ownership structure of Volvofinans changed when AP6 acquired<br />
40% of the shares, leaving Ford Credit with 10% (previously 50%). The 10% ownership<br />
stake was transferred to Volvocars, which is now Chinese-owned. These<br />
changes were highly positive for Volvofinans’ credit quality as they reduced the<br />
contagion risk that had overshadowed the company. According to AP6, its investment<br />
in Volvofinans should be seen as “very much long term”. We view the remaining<br />
owner, Volverkinvest AB (which still holds 50% of shares) as stable, as it is<br />
owned by 70 Volvo dealers, which are dependent on Volvofinans. In addition, AP6’s<br />
involvement reduces the risk that Volvofinans will provide financing too cheaply in<br />
order to cross-subsidise a specific car brand.<br />
Broadening of business<br />
Ford’s exit from Volvo means that Volvofinans has been allowed to finance all car<br />
brands sold by Swedish Volvo dealers, broadening the company’s business. Volvo<br />
dealerships are now marketing Volvo, Renault, Ford, Jaguar, Land Rover, Hyundai,<br />
Mazda, Toyota, Nissan, Peugeot and BMW, giving Volvofinans the opportunity of<br />
increased car financing penetration.<br />
HOLD<br />
Sector: Financials<br />
Corporate ticker: VOLVAB<br />
Equity ticker: Not listed<br />
Market cap: Not listed<br />
Ratings:<br />
S&P rating: Not rated<br />
Moodys rating: Baa2 (NO)<br />
Fitch rating: Not rated<br />
Analysts:<br />
Henrik Arnt<br />
Henrik.arnt@danskebank.dk<br />
+45 4512 8504<br />
Thomas Hovard<br />
Thomas.hovard@danskebank.dk<br />
+45 4512 8505<br />
Key credit issues<br />
Strengths:<br />
• Legal structure supports credit<br />
(dealerships bear most credit risk<br />
in car financing).<br />
• Strong Swedish economy backs<br />
asset quality in both car financing<br />
and credit cards.<br />
Challenges:<br />
• Car financing is highly cyclical.<br />
• Credit card business is inherently<br />
risky.<br />
• High reliance on wholesale funding.<br />
Source: <strong>Danske</strong> Markets<br />
The payment card, Volvo Card, is becoming increasingly significant to Volvofinans’<br />
performance. Volvo Card acts as a credit card at all Volvo dealerships, paying for repairs,<br />
servicing, petrol etc. Goods and services acquired by the Volvo Card amounted to<br />
SEK10bn in 2010. The risk in the credit card business for Volvofinans <strong>Bank</strong> is significantly<br />
higher than in car financing but until now loan losses have been relatively modest.<br />
54 | 13 April 2011<br />
www.danskeresearch.com
<strong>Scandi</strong> Handbook<br />
Swedish economy is among Europes strongest<br />
The domestic economic development – house prices and unemployment in particular<br />
– is central to the prospects for Swedish banks, including Volvofinans, as virtually all<br />
the company’s activities are in Sweden. The domestic Swedish economy fared relatively<br />
well throughout the financial crisis and recently a strong recovery has taken<br />
place. The most recent GDP numbers showed that in the fourth quarter of 2010 the<br />
Swedish economy grew by 7.3% y/y. The macroeconomic backdrop is therefore<br />
highly supportive for the banking system.<br />
During the recent crisis, the central bank aggressively lowered its target rate. As the<br />
bulk of Swedish mortgages are tied to the short-term rate (STIBOR), this corresponded<br />
to an expansionary economic policy, to the benefit of the domestic economy<br />
and house prices in particular. We believe that this stimulus via the steep decline in<br />
short-term interest rates is a key explanation for the low Swedish loan losses in the<br />
past few years.<br />
Profitability and efficiency<br />
90%<br />
80%<br />
70%<br />
60%<br />
50%<br />
40%<br />
30%<br />
20%<br />
10%<br />
0%<br />
2005 2006 2007 2008 2009 2010<br />
Cost-income ratio<br />
Source: Company data and <strong>Danske</strong> Markets<br />
2,0%<br />
1,6%<br />
1,2%<br />
0,8%<br />
0,4%<br />
0,0%<br />
Recurring earnings power, RHS<br />
-0,4%<br />
Naturally, the transmission also works the other way, i.e. when rates go up this will<br />
be felt with immediate effect, and the Riksbank started hiking its policy rate in September.<br />
So far, the level remains low and by the end of the year the repo rate is expected<br />
by our macro team to be 2.75%, by no means alarming. In fact, modest increases<br />
in the policy rate are probably net positive for the banks allowing them to<br />
raise deposit margins without really jeopardising asset quality. In the medium term,<br />
we therefore fail to see any major negative credit triggers for the Swedish banking<br />
sector. Our main concern would be inflationary signs in Sweden, as this could result<br />
in a more aggressive hiking path from the Riksbank.<br />
Asset quality<br />
Legal structure and credit practices at dealer level mitigate credit risk<br />
As its primary aim is to finance and manage financial contracts provided by Volvo<br />
dealers to their customers, Volvofinans does not assume any credit risk from auto<br />
customers directly – this risk is borne solely by the dealers and governed by legal<br />
lending contracts between the dealers and Volvofinans. All auto-financing at the<br />
dealer level is secured by the collateral of the cars and trucks. Volvofinans would<br />
only be exposed to car financing risk if the dealer that underwrote the risk were to go<br />
into liquidation. Historically, the dealers have shown sound performance and only<br />
three have gone bankrupt since Volvofinans’ creation in 1959, none resulting in<br />
actual losses for Volvofinans.<br />
By the end of 2010, the lending volume was SEK23.2bn, up from SEK21.7bn at<br />
year-end 2009. 16% of the loan book was made up of the more cyclical trucks and<br />
buses segment. Problem loans (more than 90 days in arrears) related to credit cards<br />
were SEK119m (down from SEK129m at year-end) and related to vehicle leasing<br />
and lending were SEK103m. Of the latter, dealers bear the credit risk due to recourse<br />
for SEK95m, i.e. virtually all the outstanding amount. Problem loans amounted to<br />
1.6% of total gross loans, which represents a marginal increase compared with end-<br />
2009.<br />
The company has a low market risk appetite: all currency risk is hedged and no equity<br />
risk is undertaken.<br />
Liquidity and funding<br />
Volvofinans' financing requirements are largely met by three public marketing programmes.<br />
A Nordic Company-Certification programme of SEK15bn and a Euro-<br />
Commercial Paper Programme of EUR500m are used for short-term borrowing, and<br />
an MTN programme of SEK12.5bn is used for long-term borrowing. Furthermore,<br />
Volvofinans was granted permission by the Swedish national debt office for a Swedish<br />
state guarantee and used it during the first half of 2009 to replace short-dated<br />
liabilities with longer term-financing.<br />
Problem loans as % of total loans<br />
2,00%<br />
1,80%<br />
1,60%<br />
1,40%<br />
1,20%<br />
1,00%<br />
0,80%<br />
0,60%<br />
0,40%<br />
0,20%<br />
0,00%<br />
2001 2003 2005 2007 2009<br />
Source: Company data and <strong>Danske</strong> Markets<br />
Funding mix<br />
Market<br />
funds<br />
55%<br />
Problem loans/Total loans<br />
Sub debt<br />
1% Equity<br />
17%<br />
Deposits<br />
11%<br />
Source: Company data and <strong>Danske</strong> Markets<br />
55 | 13 April 2011<br />
www.danskeresearch.com
<strong>Scandi</strong> Handbook<br />
Volvofinans is by nature a wholesale-driven business, but it attracts deposits through<br />
its Volvo Card, which now accounts for SEK2.5bn, equivalent to 11% of total funding.<br />
All maturing short-term debt (
<strong>Scandi</strong> Handbook<br />
Financial date Volvofinans<br />
Key figures (SEKm) 2006 2007 2008 2009 2010<br />
Net interest income 93 124 176 337 1,430<br />
Fee and commission 234 246 251 265 266<br />
Net result from financial transactions 1 6 2 3 2<br />
Other income 242 231 184 14 2<br />
Total revenue 570 607 614 619 1,699<br />
Pre-provision income (PPI) 299 313 306 222 269<br />
Loan losses and provisions -1 7 21 5 17<br />
Net income 216 225 260 158 232<br />
Lending to general public 24,307 24,884 24,321 23,155 13,914<br />
Total assets 24,955 25,873 25,382 24,067 25,430<br />
Deposits from the general public 453 0 0 1,900 2,515<br />
Issued securities 13,045 20,593 20,231 16,914 13,242<br />
Subordinated debt 460 195 210 209 203<br />
Equity 2,653 2,552 2,612 2,824 4,140<br />
Ratios 2006 2007 2008 2009 2010<br />
Net interest margin 0.37% 0.49% 0.69% 1.36% 7.40%<br />
Recurring earnings power 1.20% 1.42% 1.63% 1.24% 1.21%<br />
Cost/income 47.6% 47.9% 50.0% 64.0% 84.1%<br />
Problem loans/Total loans 0.28% 0.31% 1.88% 1.31% 1.59%<br />
Loan loss provision/Pre-provision income -0.39% 2.11% 6.70% 2.48% 6.14%<br />
Avg. customer deposits/avg. funding 2.21% 0.00% 0.00% 9.99% 11.34%<br />
Core capital ratio 10.47% 12.24% 13.20% 15.06% 14.45%<br />
Total capital ratio 11.81% 13.16% 14.20% 16.15% 15.43%<br />
Source: Company data, <strong>Danske</strong> Fixed Income Credit Research<br />
Quarterly review (SEKm) Q4 09 Q1 10 Q2 10 Q3 10 Q4 10<br />
Net interest income 58 208 256 280 686<br />
Fee and commission 69 61 69 67 68<br />
Net result from financial transactions 3 0 0 0 2<br />
Other income 16 0 0 0 2<br />
Total revenue 145 269 325 348 758<br />
Pre-provision income 59 61 58 80 71<br />
Lending to the general public (net) 23,155 22,482 22,255 19,876 13,914<br />
Net interest margin 0.96% 3.52% 4.45% 5.16% 15.62%<br />
Recurring earnings power 0.98% 1.04% 0.99% 1.33% 1.14%<br />
Cost/income 58.6% 77.2% 82.0% 77.0% 90.6%<br />
Core capital ratio 15.06% 15.06% 14.02% 13.80% 14.45%<br />
Source: Company data, <strong>Danske</strong> Fixed Income Credit Research<br />
57 | 13 April 2011<br />
www.danskeresearch.com
<strong>Scandi</strong> Handbook<br />
58 | 13 April 2011<br />
www.danskeresearch.com
<strong>Scandi</strong> Handbook<br />
General Industrials<br />
59 | 13 April 2011<br />
www.danskeresearch.com
<strong>Scandi</strong> Handbook<br />
ABB<br />
Company overview<br />
ABB is a global manufacturing conglomerate focused on five major operations: Power<br />
Products, Power Systems, Discrete Automation & Motion, Low-Voltage Products and<br />
Process Automation. The portfolio ranges from light switches to robots and from large<br />
electrical transformers to control systems managing power networks and factories. The<br />
main business drivers are linked to capital expenditure in the utility sector and various<br />
process industries. After three years of speculative-grade ratings, ABB returned to investment<br />
grade in April 2006 after successfully restoring operational and financial performance.<br />
Its largest shareholders are Investor AB, which holds 7.1% of the share capital<br />
and voting rights, and BlackRock with 3.0%. The company employs a staff of around<br />
116,500 people.<br />
Key credit considerations<br />
Strong business risk profile<br />
ABB’s strategy focuses on its core power and automation operations. During years of<br />
restructuring following the distressed situation that emerged in 2002, the focus has<br />
been on improving operating efficiency, risk management and control, and the disposal<br />
of non-core operations. The strong business risk profile is supported by ABB’s<br />
scale, global market leadership and strong geographical diversification. In 2010, the<br />
company had 39% of sales in Europe, 20% in the Americas, 28% in Asia and 13% in<br />
Middle East and Africa. Technological requirements and access to distribution channels<br />
create significant barriers to entry.<br />
Mid- to late-cyclical exposure<br />
Discrete Automation & Motion, Low-Voltage Products, and Process Automation<br />
(around 51% of 2010 sales) are characterised by mid- to late-cyclical investment<br />
peaks. These business segments accounted for most of the decline in sales during the<br />
global recession in 2008 and 2009. Meanwhile, demand for power transmission and<br />
distribution (around 49% of 2010 sales) is linked to long-term economic trends and<br />
growth, rather than shorter business cycle fluctuations. These business segments have<br />
proven more stable throughout the crisis. In the medium term, ABB is expected to<br />
benefit from the need for power and industrial investments in emerging markets and<br />
the need for upgrades and increased efficiency in mature markets. However, uncertainty<br />
over the economic recovery, availability of funding and stability of raw material<br />
prices can result in customers postponing some of their investment decisions.<br />
Strong balance sheet leaves room for acquisitions<br />
After years of focus on restructuring through large divestments and capital injections,<br />
leverage has been reduced significantly and ABB now holds a large net cash position.<br />
Throughout this process, the focus has been on organic growth, with a very conservative<br />
attitude towards acquisitions. However, since Joseph Hogan became CEO in September<br />
2008, ABB has announced its intention to increase the pace of acquisitions and<br />
we expect more efficient debt employment going forward. We expect the company to<br />
pursue bolt-on acquisitions that complement both the product range and the geographical<br />
presence. The risk of a substantial acquisition is present, given the high degree of<br />
sector concentration. However, with its large cash position, ABB has significant headroom<br />
for acquisitions and/or shareholder distribution within its gearing target and current<br />
ratings. When accounting for cash needed for ongoing operations, we estimate the<br />
current headroom available for acquisitions under the ‘A’ credit rating to be in the<br />
range of USD7.0bn. S&P also expects ABB to carry out acquisitions of several billion<br />
USD in the near to medium term.<br />
HOLD<br />
Sector: Industrials;<br />
Automation & Power<br />
Corporate ticker: ABB<br />
Equity ticker: ABBN VX<br />
Market cap: CHF51.2bn<br />
Ratings:<br />
S&P rating: A /S<br />
Moodys rating: A3 /S<br />
Fitch rating: BBB+ /S<br />
Analyst:<br />
Asbjørn Purup Andersen<br />
apu@danskebank.com<br />
+45 45148886<br />
Kristian Myrup Pedersen<br />
kripe@danskebank.com<br />
+45 45128519<br />
Key credit issues<br />
Strengths:<br />
• Leading positions worldwide in<br />
Power and Automation segments.<br />
• Barriers to entry from technology<br />
base and economies of scale.<br />
• Geographical diversification with<br />
emerging market exposure.<br />
• Conservative financial profile, solid<br />
cash flow and credit metrics.<br />
Challenges:<br />
• Cyclical demand volatility in Automation<br />
segment.<br />
• Low capacity utilisation creates<br />
competition and price pressure.<br />
• More acquisitions will likely increase<br />
debt levels in the future.<br />
Source: <strong>Danske</strong> Markets<br />
60 | 13 April 2011<br />
www.danskeresearch.com
<strong>Scandi</strong> Handbook<br />
Liquidity<br />
We consider ABB’s liquidity position particularly strong. At the end of 2010, ABB had<br />
cash and cash equivalents of USD8.6bn, of which S&P estimates that USD1.7bn is<br />
required to maintain ongoing operations. The company also has a USD2.0bn committed<br />
and unutilised syndicated credit facility, which matures in 2015 after being renewed<br />
in November 2010. Moreover, this credit facility is not subject to financial covenants or<br />
material adverse change clauses. ABB also has a strong track record of free operating<br />
cash flow generation, which S&P expects to be around USD2.0bn per annum over the<br />
medium term.<br />
This compares with short-term liabilities of around USD1.0bn. ABB has several of its<br />
debt maturities covered with its freely-available cash. In fact, ABB has total reported<br />
debt of just USD2.2bn, so it holds a significant net cash position.<br />
Current performance drivers<br />
Late cyclical segments yet to see recovery<br />
While ABB was affected by the economic downturn, its EBIT margin actually rose<br />
somewhat due to cost focus and working capital releases. The downturn mainly affected<br />
the short-cycle segments, while the Power segments were largely unaffected<br />
by the business cycle. Conversely, the short-cycle segments are now seeing a recovery,<br />
while the late-cyclical Power segments have yet to see a recovery. Although<br />
ABB has raised its 2011 outlook for the late-cycle segments, this is most likely backend<br />
loaded, with no effects before H2 11.<br />
Emerging markets remain the major growth driver<br />
ABB will continue to focus on cost reductions, with an increased cost saving target in<br />
order to offset pressure on profitability in the weak European and American markets. In<br />
the growth markets (Asia, Middle East and Africa), ABB will focus on “aggressive”<br />
growth and acquisitions. While the need for power transmission infrastructure has not<br />
changed in recent quarters, factors concerning the availability of funding and stability<br />
of raw material prices influence many power investment decisions.<br />
Appetite for acquisitions increases substantially<br />
On 1 September 2008, Joseph Hogan was appointed CEO of ABB. Mr. Hogan has<br />
substantial M&A experience compared with his predecessor, and in 2010 he started<br />
to put the large net cash position to use through acquisitions.<br />
ABB has acquired Ventyx for USD1.1bn, increased its stake in its subsidiary in India<br />
for USD1.0 and also made a USD1.2bn bid for Chloride, although it withdrew the<br />
offer in order to avoid a bidding war (which is credit-positive as it underlines the<br />
prudent financial strategy). In early 2011, ABB also bought Baldor for USD4.6bn,<br />
which has brought the net cash position down to USD2.2bn.<br />
Hence, ABB has spent more than USD6.5bn (excluding the USD1.3bn bid for Chloride)<br />
over the past year. We expect ABB to continue to focus on bolt-on acquisitions<br />
in 2011.<br />
but debt headroom within current ratings is significant<br />
According to S&P, ABB’s financial performance remains significantly above the rating<br />
requirements, and in June 2010 S&P upgraded ABB one notch to ‘A’.<br />
To remain commensurate with this rating, S&P is looking for FFO to net debt of above<br />
50%, FOCF to net debt of above 35%, adjusted net debt to EBITDA in the range of<br />
1.5-2.0x and gearing of up to 40%. Moody’s expects RCF/net debt above 40% for the<br />
‘A3’ rating. ABB’s current credit metrics are significantly above these levels and the<br />
rating agencies factor in substantial headroom to accommodate debt-funded acquisitions<br />
and/or distributions to shareholders. However, this is still based on the expectation<br />
of a conservative growth strategy, with prudent acquisition evaluation and funding<br />
criteria.<br />
Debt maturity profile<br />
(as of 31 December 2010)<br />
USDbn<br />
1.2<br />
1.0<br />
0.8<br />
0.6<br />
0.4<br />
0.2<br />
0.0<br />
Source: Company data, <strong>Danske</strong> Markets<br />
Profitability<br />
USDbn<br />
40<br />
35<br />
30<br />
25<br />
20<br />
15<br />
10<br />
5<br />
0<br />
2011 2012 2013 2014 2015 2016+<br />
2006 2007 2008 2009 2010<br />
Source: Company data, <strong>Danske</strong> Markets<br />
Sales by segment, 2010<br />
Source: Company data, <strong>Danske</strong> Markets<br />
Credit metrics<br />
Source: Company data, <strong>Danske</strong> Markets<br />
18%<br />
16%<br />
14%<br />
12%<br />
10%<br />
8%<br />
6%<br />
4%<br />
2%<br />
0%<br />
Sales EBITDA EBITDA-margin (rhs)<br />
Process Automation,<br />
22%<br />
Low-voltage<br />
Products, 13%<br />
Discrete Automation<br />
& Motion, 16%<br />
USDbn<br />
20.0<br />
15.0<br />
10.0<br />
5.0<br />
0.0<br />
-5.0<br />
-10.0<br />
Power Products,<br />
29%<br />
Power Systems,<br />
20%<br />
2006 2007 2008 2009 2010<br />
2.0x<br />
1.5x<br />
1.0x<br />
0.5x<br />
0.0x<br />
-0.5x<br />
-1.0x<br />
-1.5x<br />
Net debt Equity Net debt/EBITDA<br />
61 | 13 April 2011<br />
www.danskeresearch.com
<strong>Scandi</strong> Handbook<br />
S&P states that ABB has both limited upside and downside rating potential. A rating<br />
downgrade could occur if ABB were to adopt a more aggressive financial policy, carrying<br />
out large debt-funded acquisitions combined with a market downturn, such that<br />
sales were to fall by more than 15% a year and margins by 4%.<br />
If measured against the company’s unadjusted gearing target of 40% (gearing currently<br />
stands at 14%), ABB is able to increase debt levels by USD10.6bn after the<br />
Baldor acquisition (assuming that excess cash above the S&P requirement of<br />
USD1.7bn for daily operations is fully used). S&P expects adjusted net<br />
debt/EBITDA in the range of 1.5x-2.0x under the current ‘A’ rating (this currently<br />
stands at minus 0.75x). Under this metric, ABB currently has USD6.8bn of headroom,<br />
under a very conservative zero acquired EBITDA assumption. These estimates<br />
are within S&P’s expectation of ABB carrying out up to USD10.0bn worth of acquisitions<br />
in the near term. Hence, the debt headroom is significant, but the risk of a<br />
large-scale acquisition is present given the high degree of sector concentration.<br />
2011 financial targets confirmed<br />
In 2009 ABB once again confirmed its 2011 medium-term strategy, as outlined in<br />
September 2007. The company plans to maintain its current core portfolio of businesses<br />
and targets a compound annual growth rate for revenue of 8-11% and an EBIT margin<br />
target corridor of 11-16%. These targets are to be driven by further internal efficiency<br />
improvements and expected continued growth in power utility and industrial automation<br />
investments. Taking possible acquisition financing into account, the target maximum<br />
gearing is 40%. We view this gearing target as commensurate with current ratings.<br />
Recommendation<br />
We have an overall HOLD recommendation on ABB. In our view, the main spread<br />
driver is the potential for large debt-financed M&A. While the company’s large cash<br />
position provides significant headroom for this, we expect ABB to continue to deploy a<br />
more efficient capital structure and take advantage of low company valuations and/or<br />
increase shareholder friendliness.<br />
We have a neutral stance on the rather illiquid ABB 2013 cash bond, trading around an<br />
ASW offer of +29bp (see list of instrument prices at the end of this book). The fact that<br />
ABB has renewed its USD2.0bn credit facility, with 2015 maturity, is positive for the<br />
bonds, and we see very limited risk. However, due to illiquidity we recommend investors<br />
to wait for potential new issuance.<br />
The 5y CDS trades rather tight at around 61/66bp (corresponding to 0.66x iTraxx<br />
Europe) and hence we recommend buying protection.<br />
62 | 13 April 2011<br />
www.danskeresearch.com
<strong>Scandi</strong> Handbook<br />
Financial data ABB<br />
Key figures (USDm) 2006 2007 2008 2009 2010<br />
Net Sales 24,412 29,183 34,912 31,795 31,589<br />
EBITDA 3,138 4,625 5,163 4,781 4,520<br />
EBIT 2,568 4,023 4,552 4,126 3,818<br />
Net interest expenses 153 13 34 6 78<br />
Net profit 1,390 3,757 3,378 3,136 2,732<br />
FFO (1) 2,510 3,321 4,052 3,688 3,598<br />
Capex 536 765 1,171 967 840<br />
EBITDA-Capex 2,602 3,860 3,992 3,814 3,680<br />
FCF (3) 1,200 1,840 1,727 2,033 2,245<br />
Net debt (4) -1,508 -5,436 -5,443 -7,219 -6,428<br />
Adjusted net debt (5) 610 -3,447 -2,492 -4,344 -4,100<br />
Equity (incl. minorities) 6,038 10,957 11,158 13,790 15,458<br />
Total debt 3,282 2,674 2,363 2,333 2,182<br />
Total capital (6) 9,320 13,631 13,521 16,123 17,640<br />
Ratios 2006 2007 2008 2009 2010<br />
EBIT margin 10.5% 13.8% 13.0% 13.0% 12.1%<br />
Capex/sales 2.2% 2.6% 3.4% 3.0% 2.7%<br />
EBITDA/Net interest expenses 20.5x 355.8x 151.9x 796.8x 57.9x<br />
Net debt/EBITDA -0.5x -1.2x -1.1x -1.5x -1.4x<br />
FFO/Net debt -166% -61% -74% -51% -56%<br />
FFO/Adjusted net debt 465% -106% -179% -95% -99%<br />
Net debt/Total capital -16% -40% -40% -45% -36%<br />
Adjusted net debt/total capital 7% -25% -18% -27% -23%<br />
(1) Funds from operations (2) FFO less changes in working capital and CAPEX but before net interest paid and taxes paid. (3) OpFCF less net interest paid and taxes<br />
paid and less dividends. (4) Total interest-bearing debt less cash and marketable securities. (5) Net debt adjusted contingent liabilities/contractual obligations as<br />
reported. (6) Equity and unadjusted total debt. Source: Company data, <strong>Danske</strong> Fixed Income Credit Research<br />
Quarterly review (USDm)<br />
Q4 09 Q1 10 Q2 10 Q3 10 Q4 10<br />
Net sales 8,761 6,934 7,573 7,903 9,179<br />
EBITDA 1,336 885 1,212 1,342 1,293<br />
EBITDA margin 15.2% 12.8% 16.0% 17.0% 14.1%<br />
Net income 540 464 669 819 753<br />
Net debt -7,219 -7,147 -5,890 -5,289 -6,428<br />
Adjusted net debt -4,268 -4,272 -3,015 -2,414 -3,553<br />
Net debt/LTM EBITDA -1.4x -2.0x -1.2x -1.0x -1.2x<br />
Source: Company data, <strong>Danske</strong> Fixed Income Credit Research<br />
Divisional quarterly review (USDm)<br />
Q4 09 Q1 10 Q2 10 Q3 10 Q4 10<br />
Power Products Net sales 3,109 2,319 2,528 2,439 2,913<br />
EBIT margin 15.9% 15.0% 16.5% 16.6% 15.6%<br />
Power Systems Net sales 1,908 1,384 1,635 1,679 2,088<br />
EBIT margin 3.5% -1.0% 1.1% 6.1% 0.2%<br />
Discrete Automation Net sales 1,470 1,213 1,287 1,460 1,657<br />
& Motion EBIT margin 2.9% 13.8% 15.9% 18.4% 17.2%<br />
Low-Voltage Net sales 1,109 1,011 1,102 1,187 1,254<br />
Products EBIT margin 13.4% 14.8% 19.3% 20.6% 15.8%<br />
Process Automation Net sales 2,054 1,735 1,737 1,859 2,101<br />
EBIT margin 8.3% 9.2% 10.9% 11.1% 9.5%<br />
Source: Company data, <strong>Danske</strong> Fixed Income Credit Research<br />
63 | 13 April 2011<br />
www.danskeresearch.com
<strong>Scandi</strong> Handbook<br />
A.P. Moller-Maersk Group<br />
Company overview<br />
Employing some 108,000 people, Danish-based A.P. Moller-Maersk Group (APM)<br />
owns the world’s largest container shipping line, which in 2010 carried some 15% of<br />
total world seaborne containers. APM also has sizeable operations within oil & gas<br />
production and exploration as well as food retailing. A diversified set of activities is<br />
complemented by a favourable geographical spread with operations in 130 countries.<br />
In 2009, the company issued its first-ever unrated capital market debt, followed by a<br />
new euro benchmark issuance in November 2010. The Møller family controls 76.5%<br />
of the voting shares. APM is not rated by rating agencies.<br />
Key credit considerations<br />
Market-leading operations<br />
APM enjoys leading market positions within its main operating areas. Activities<br />
include the world’s largest container shipping line, which combined with port operations<br />
and logistics services enables the company to offer full door-to-door transport<br />
solutions. APM also claims a world-leading position within the transport of refined<br />
oil products. Within food retail, APM has successfully grown its discount chain<br />
Netto and holds around 30% of the Danish food retail market through various brands.<br />
Oil & gas activities are conducted globally, with production on the mature Danish<br />
continental shelf being counterbalanced by production in, among other regions,<br />
Qatar.<br />
Diversification mitigates cyclicality<br />
APM employs a highly diversified business risk profile, which mitigates the inherent<br />
cyclical, capital-intensive and volatile characteristics of shipping and oil & gas production.<br />
Different demand drivers in the divisions make group earnings less vulnerable<br />
to adverse development in a certain demand driver. This overall income diversification<br />
renders a relatively strong business risk profile. However, the almost perfect<br />
storm seen in 2009, with falling freight rates, oil & gas prices and transport demand<br />
caused earnings to fall significantly.<br />
Partial internal hedges through diverse business segments<br />
Stabilising effects arise from one division having a certain factor as an output (e.g.<br />
oil in the oil & gas division) while another division has it as an input (oil-based fuel<br />
in the shipping operations). Such long and short positions in related commodities or<br />
services create partial internal hedges within the group. APM is net long oil and<br />
states that a USD10/bbl price increase will yield a USD200m increase in net income<br />
and vice versa.<br />
Credit metrics regained strength in 2010<br />
The company has a strong and stable ownership structure and a prudent approach to<br />
shareholder distributions. Key credit metrics deteriorated in 2009, but 2010 showed a<br />
strong recovery. Overall, APM benefits from a robust capital structure and cash flow<br />
generation over the cycle. A reduced dividend for 2009 and a sale of treasury shares<br />
worth some DKK8.2bn in September 2009 demonstrate the company’s commitment<br />
to preserving a conservative financial profile, in our view.<br />
BUY<br />
Sector: Diversified operations<br />
Corporate ticker: MAERSK<br />
Equity ticker: MAERSKB DC<br />
Market cap: DKK215bn<br />
Ratings:<br />
NR/NR/NR<br />
Analysts:<br />
Jakob Magnussen<br />
jakja@danskebank.dk<br />
+45 45 12 85 03<br />
Kristian Myrup Pedersen<br />
kripe@danskebank.dk<br />
+45 45 12 85 19<br />
Key credit issues<br />
Strengths:<br />
• Leading market positions.<br />
• Highly diversified operations and<br />
several partial internal hedges.<br />
• Strong and stable ownership<br />
structure and conservative approach<br />
to capital structure.<br />
• Robust credit metrics over the<br />
cycle.<br />
Challenges:<br />
• High cyclicality and capital intensiveness<br />
in major business areas.<br />
• Exposure to volatile commodity<br />
prices and freight rates.<br />
• Challenge of replacing domestic oil<br />
resources being depleted.<br />
• Considerable committed capex.<br />
Source: <strong>Danske</strong> Markets<br />
We see APM as a solid investment grade company<br />
APM does not have a public credit rating. Viewing the different business areas as a<br />
portfolio and taking into account the positive diversification effect and internal<br />
hedges, we view the overall business risk profile as Strong. Based on key credit<br />
metrics, we view APM as having an Intermediate financial risk profile. In combination,<br />
we estimate the rating of APM as comparable to that of an ‘A-’ rated issuer at<br />
the senior unsecured level.<br />
64 | 13 April 2011<br />
www.danskeresearch.com
<strong>Scandi</strong> Handbook<br />
Liquidity<br />
Following a EUR500m benchmark issuance in November 2010 and strong free cash<br />
flow generation, APM’s 2010 report demonstrated a comforting short-term liquidity<br />
profile. At year end APM had DKK25.9bn in cash and equivalents, which is more<br />
than adequate to meet short-term debt maturities of DKK12.6bn. APM’s debt maturity<br />
profile is evenly spread out, with no major maturities in any one year. APM expects<br />
2011 capex to be significantly higher than the DKK26bn seen in 2010 which<br />
was at a low level compared with APM’s normal annual capex level. The group will<br />
pay dividends in 2011 to the tune of DKK4.4bn. To cover this, APM guides for cash<br />
flow from operations to be below the DKK60bn seen in 2010. As the level of the<br />
2011 hike in capex budget is unknown, and given that APM has expressed ambitions<br />
of being a frequent capital market debt issuer in order to diversify funding sources,<br />
we will certainly not rule out that APM could come to the primary market in 2011.<br />
On 23 September 2010, APM announced that it had refinanced a USD6.5bn facility<br />
maturing in 2012 with a new five-year USD6.75bn syndicated revolving credit facility.<br />
APM’s total undrawn committed facilities amount to DKK53bn at end-2010. An<br />
additional source of cash is likely to be seen in 2011, with the proceeds from the<br />
divested Netto UK supermarket chain worth some USD700m, pending competition<br />
authorities approval.<br />
Current performance drivers<br />
Strong end to a record year<br />
APM’s 2010 annual results demonstrated a strong set of full-year numbers. Both revenues<br />
and net profit came in slightly ahead of consensus expectations. The company<br />
enjoyed a significant tailwind as the average freight rate increased 29% in 2010. The<br />
average oil price also increased 29% to USD80/bbl, while APM’s entitlement production<br />
declined 12% mainly stemming from a lower share in Qatar. Container volumes<br />
transported increased 5%. These issues helped boost 2010 revenue, which increased<br />
21% y/y to DKK315bn. APM significantly reduced the cost base during 2010 (particularly<br />
in container activities), which helped group profitability taking APM’s reported<br />
EBITDA up by 81% to DKK89bn and took the EBITDA margin to 28.3% versus<br />
18.9% in 2009. Group net profit improved to DKK26.5bn versus a DKK7bn loss in the<br />
same period last year.<br />
Balance sheet more comforting for debt investors<br />
Cash flow from operations was very strong at DKK57bn in 2010 while capex remained<br />
relatively low at DKK26.1bn. The resulting strong FOCF generation of DKK30.9bn<br />
caused group net debt to fall 25.8% y/y to DKK69.7bn, partly offset by a rising US<br />
dollar impacting APM’s US dollar-denominated debt base. On adjusted numbers we<br />
see net debt at DKK140bn, down 12% y/y. The difference being chiefly explained by a<br />
solid operating lease base primarily devoted to tonnage leasing. Following this, group<br />
adjusted net debt to EBITDA improved to 1.4x in 2010 from 2.5x in 2009. APM’s<br />
adjusted net leverage was 42% vs 50% in 2009.<br />
2011 outlook<br />
APM expects the 2011 group result and operating cash flow to decline y/y while<br />
capex is expected to be “significantly higher”. The company expects the global container<br />
market to grow 6-8% and container activities are expected to generate a satisfactory<br />
but lower result as increased demand will be offset by even greater supply of<br />
new tonnage in the market. Based on an average oil price around USD90/bbl, APM<br />
expects a lower result in the oil business and a higher level of exploration activities.<br />
Obviously the current level of Brent is significantly above this level, boding well for<br />
a positive surprise from this division, which will offset a general falling trend in<br />
production and reserves.<br />
Debt maturity profile (end-2010)<br />
USDbn<br />
7<br />
6<br />
5<br />
4<br />
3<br />
2<br />
1<br />
0<br />
Source: Company data and <strong>Danske</strong> Markets<br />
Profitability<br />
DKKm<br />
350,000<br />
300,000<br />
250,000<br />
200,000<br />
150,000<br />
100,000<br />
50,000<br />
2011 2012 2013 2014 2015 2016 >2016<br />
0<br />
Source: Company data and <strong>Danske</strong> Markets<br />
Divisional EBIT split (DKKm)<br />
Tankers,<br />
offshore<br />
and other<br />
shipping<br />
4%<br />
Source: Company data and <strong>Danske</strong> Markets<br />
Credit metrics<br />
DKKm<br />
250,000<br />
200,000<br />
150,000<br />
100,000<br />
50,000<br />
0<br />
2006 2007 2008 2009 2010<br />
Sales EBITDA EBITDA-margin (rhs)<br />
Retail<br />
activity<br />
7%<br />
APM<br />
Terminals<br />
13%<br />
Other<br />
3%<br />
Oil & Gas<br />
activities<br />
28%<br />
2006 2007 2008 2009 2010<br />
Source: Company data and <strong>Danske</strong> Markets<br />
30%<br />
25%<br />
20%<br />
15%<br />
10%<br />
5%<br />
0%<br />
Container<br />
shipping<br />
45%<br />
Net debt equity Net debt/EBITDA (rhs)<br />
X<br />
2.50<br />
2.00<br />
1.50<br />
1.00<br />
0.50<br />
0.00<br />
65 | 13 April 2011<br />
www.danskeresearch.com
<strong>Scandi</strong> Handbook<br />
2010 container market recovery<br />
APM reported a solid rebound in its shipping activities in 2010 compared with a very<br />
weak 2009. The group reports that freight rates and volumes carried was about at par<br />
with the strong 2008. In spite of this, a high focus on cost and operational efficiency<br />
caused APM to record an extra USD2.2bn in 2010 relative to 2008. In our view, the<br />
strong cost structure spells a key vital competitive edge for APM relative to its competitors.<br />
For 2011 APM states that a 100USD/FFE increase in freight rates will result<br />
in a net gain of USD800m and a volume increase of 0.1m FFE will result in a<br />
USD200m net gain and vice versa.<br />
Capex<br />
Committed capex amounts to DKK50bn (DKK43bn at end-2009), which includes<br />
DKK22.3bn relating to the existing new building programme for ships and rigs, etc.<br />
The remaining DKK27.7bn relates to investments in mainly terminals and oil & gas.<br />
This includes the USD2.4bn acquisition of three E&P partnerships in Brazil through<br />
SK do Brasil Ltda. One field offers immediate production of 10,000bbl/day (APM’s<br />
share) while the two other fields may produce oil in 2016 and 2018. Maersk assesses<br />
the growth potential as “significant”. This acquisition is in line with Maersk Oil’s<br />
strategy of diversifying operations to replace depleting North Sea assets. It is also<br />
consistent with the group ambition of growing the oil and gas operations.<br />
We estimate an A- rating at the senior unsecured level<br />
APM does not have a public credit rating but has a target of maintaining a conservative<br />
capital structure and funding profile matching that of a strong investment grade<br />
company. Viewing the different business areas as a portfolio and taking into account<br />
a certain degree of diversification and internal hedges, we view the overall business<br />
risk profile as Strong 1 . Based on key credit metrics, we view APM as having an<br />
Intermediate financial risk profile. In combination, we estimate the rating of APM as<br />
comparable to that of an ‘A-’ rated issuer at the senior unsecured level. While coming<br />
from levels below over-the-cycle requirements for an ‘A-’ rating, credit metrics<br />
are currently strong and supported by a recovering operating environment and successful<br />
cost-cutting. The large container segment has also demonstrated strong recovery<br />
in 2010. We expect this segment, however, to remain volatile in the longer<br />
run despite APM’s improving and market-leading cost efficiency. This view is supported<br />
by a continued tough competition on rates prices as well as ballooning tonnage<br />
supply.<br />
While the bond documentation does not limit the incurrence of secured debt, we take<br />
some comfort in asset pledges amounting to a modest 15.3% of group asset in 2010.<br />
This is below S&P’s notching threshold (when more senior claims cover more than<br />
20% of assets).<br />
Recommendation<br />
On 24 November, APM decided to revisit the debt capital market by issuing an unrated<br />
EUR500m bond maturing 2017 at MS +175bp. With primary issuance fears out<br />
of the way, we decided to change our recommendation to Buy from Hold, seeing<br />
meaningful spread tightening potential in the name, which trades somewhat wider<br />
than peers with similar or worse credit quality in our view. We continue to believe<br />
that the lack of a credit rating combined with relatively low transparency in disclosure<br />
on certain points will result in a material spread premium to the ‘A-’ curve (we<br />
estimate an ‘A-’ rating at the senior unsecured level). We see most value in MAERSK<br />
2014 offered around ASW +89bp relative to MAERSK 2017 offered around ASW<br />
+106bp. Overall we maintain our BUY recommendation on the name. (See list of instrument<br />
prices at the end of this book.)<br />
1 Under S&P’s rating methodology, the business risk profile is assessed on a 1-6 scale with Excellent as strongest and Vulnerable as<br />
weakest (grades in between are Strong, Satisfactory, Fair and Weak). Under S&P’s rating methodology, the financial risk profile is<br />
assessed on a 1-6 scale with Minimal as strongest and Highly Leveraged as weakest (grades in between are Modest, Intermediate,<br />
Significant and Aggressive).<br />
66 | 13 April 2011<br />
www.danskeresearch.com
<strong>Scandi</strong> Handbook<br />
Financial data A.P. Moller-Maersk Group<br />
Key figures (DKKm) 2006 2007 2008 2009 2010<br />
Net Sales 260,134 278,872 311,821 260,026 315,396<br />
EBITDA 51,192 64,842 83,945 49,262 89,218<br />
EBIT 38,209 47,775 60,627 20,167 59,649<br />
Net interest expenses 2,219 4,047 5,085 5,533 5,022<br />
Net profit 16,186 18,658 17,638 -7,027 26,455<br />
FFO (1) 29,028 37,247 43,128 23,406 59,402<br />
Adjusted FFO 40,888 48,605 53,359 32,521 67,795<br />
Capex 34,321 49,003 52,375 42,195 26,078<br />
RCF (2) 26,599 34,774 40,061 20,324 57,298<br />
FCF (3) -10,624 -9,186 -8,953 -17,097 30,894<br />
Net debt (4) 60,692 68,918 87,276 93,872 69,695<br />
Adjusted net debt (5) 126,576 130,764 157,047 159,079 140,345<br />
Total debt 104,530 104,530 106,205 110,232 101,062<br />
Equity incl. minorities 136,711 146,715 158,394 158,868 192,962<br />
Total capital (6) 241,241 251,245 264,599 269,100 294,024<br />
Ratios<br />
EBITDA margin (%) 19.7% 23.3% 26.9% 18.9% 28.3%<br />
EBIT margin (%) 14.7% 17.1% 19.4% 7.8% 18.9%<br />
FFO interest coverage (x) 6.3x 6.7x 6.2x 3.7x 10.2x<br />
Net debt/EBITDA (x) 1.2x 1.1x 1.0x 1.9x 0.8x<br />
Adj net debt/Adj EBITDA (x) 1.8x 1.6x 1.6x 2.5x 1.4x<br />
FFO/Net debt (x) 47.8% 54.0% 49.4% 24.9% 85.2%<br />
Adj FFO/Adj net debt (x) 32.3% 37.2% 34.0% 20.4% 48.3%<br />
RCF/Net debt (x) 25.4% 33.3% 37.7% 18.4% 56.7%<br />
Adj RCF/Adj net debt (x) 30.4% 35.3% 32.0% 13.3% 46.8%<br />
Adj Net debt/Total capital (%) 48.1% 47.1% 49.8% 50.0% 42.1%<br />
(1) Funds from operations. (2) FFO less dividends. (3) RCF less capex and changes in working capital (4) Total interest-bearing debt less cash and marketable<br />
securities. (5) Net debt adjusted operating leases and contingent liabilities (6) Equity plus total debt. Source: Company data and <strong>Danske</strong> Markets<br />
Divisional quarterly overview (DKKm)<br />
Q209 Q110 Q210 Q3 10 Q4 10<br />
Container shipping Revenue 24,578 30,929 39,110 40,492 35,884<br />
EBIT -3,910 1,260 6,175 6,642 2,202<br />
EBIT margin -15.9% 4.1% 15.8% 16.4% 6.1%<br />
APM Terminals Revenue 10,594 5,945 6,305 5,562 6,094<br />
EBIT 996 707 2,697 1,043 675<br />
EBIT margin 9.4% 11.9% 42.8% 18.8% 11.1%<br />
Tankers, offshore and Revenue 7,543 7,512 8,752 7,760 7,655<br />
other shipping EBIT -428 878 329 962 -50<br />
EBIT margin -5.7% 11.7% 3.8% 12.4% -0.7%<br />
Oil & gas Revenue 12,084 13,438 14,822 13,441 15,933<br />
EBIT -13,574 8,103 8,950 7,471 8,395<br />
EBIT margin -112.3% 60.3% 60.4% 55.6% 52.7%<br />
Retail Revenue 15,640 14,059 14,437 14,753 16,001<br />
EBIT 322 487 664 628 1,025<br />
EBIT margin 2.1% 3.5% 4.6% 4.3% 6.4%<br />
Other Revenue 3,227 1,580 1,826 2,498 2,277<br />
EBIT 98 36 -269 917 222<br />
EBIT margin 3.0% 2.3% -14.7% 36.7% 9.7%<br />
Source: Company data and <strong>Danske</strong> Markets<br />
67 | 13 April 2011<br />
www.danskeresearch.com
<strong>Scandi</strong> Handbook<br />
Assa Abloy<br />
Company overview<br />
Assa Abloy was formed in 1994 through the merger of Assa AB (a unit of Securitas)<br />
and Finland’s Abloy Oyj. The company has historically fuelled its growth through<br />
acquisitions and, following those of Yale and HID in 2000, became the world leader<br />
in locks and ID products for access control. Its product range includes mechanical<br />
locks (traditional locks for doors), electromechanical locks (usually remotely operated),<br />
hotel locks (smart cards), and security doors. The company is globally diversified<br />
with market-leading positions in much of Europe, the US and Australia. The<br />
largest shareholders are Investment AB Latour and SäkI AB (both controlled by the<br />
Swedish long-term investor Gustav Douglas, Chairman of Assa Abloy), which together<br />
hold 29.7% of the votes and 9.6% of the share capital.<br />
Key credit considerations<br />
Strong business risk profile<br />
One of Assa Abloy’s key strengths is its diversified geographical and business mix,<br />
supported by strong brand name recognition and key local market positioning. While<br />
it has exposure to the construction and tourist industries (hotel locks), demand for<br />
security products is generally mature and stable. Stability is further supported by the<br />
high share of replacement sales as two-thirds of the business is derived from the<br />
renovation, replacement and upgrade of locks. The move into higher-value electromechanical<br />
locks offers product substitution opportunities and opens up growth<br />
opportunities. Also, the general trend towards higher security and an increasing share<br />
of electromechanical locks means that locks are upgraded more often during their<br />
lifetime, which generates more repeat business for Assa Abloy.<br />
Exposure to construction spending<br />
The demand for locks is tied to the cyclical construction industry, which causes some<br />
volatility in sales. Around 75% of sales are related to non-residential clients and 25%<br />
to residential clients. Among the non-residential clients, a large proportion consists of<br />
institutions including schools and hospitals where demand is far less cyclical.<br />
Low price competition<br />
Being the market leader with a 10% share of the fragmented global locks market, Assa<br />
can attract higher prices and achieve better economies of scale, which create entry<br />
barriers. Industry price competition is not severe as the cost of locks only represents a<br />
small part of total construction costs and price awareness among end-users is low.<br />
Very stable cash flow<br />
Assa Abloy has historically produced very stable cash flows due to its solid business<br />
positioning. Over the past five years, net sales have had a compound annual growth<br />
of 6.3%, largely built on acquisitions. The company has shown a consistent ability to<br />
achieve synergies and to maintain margins after purchases. Over recent years, its<br />
EBITDA margins have been stable at around 18%, supporting high levels of cash<br />
flow generation, which has remained largely unaffected by the global recession.<br />
Debt and high acquisition activity<br />
The balance sheet is slightly stretched for the rating category with a debt-to-equity<br />
(unadjusted) ratio of 53% due to large acquisitions. This is mitigated by strong free<br />
cash flow generation.<br />
Assa Abloy maintains a growth strategy which includes acquisitions, although these are<br />
usually bolt-ons. However, in December 2010, Assa Abloy announced the sizeable<br />
acquisition of Cardo for a total of SEK11.3bn which caused S&P to place the ‘A-’<br />
credit rating on negative watch (which was changed to negative outlook in April 2011).<br />
SELL<br />
Sector: Industrials; Machinery<br />
Corporate ticker: ASSABS<br />
Equity ticker: ASSAB SS<br />
Market cap: SEK65.9bn<br />
Ratings:<br />
S&P rating: A- /NO<br />
Moodys rating: NR<br />
Fitch rating: NR<br />
Analyst:<br />
Asbjørn Purup Andersen<br />
apu@danskebank.com<br />
+45 45148886<br />
Kristian Myrup Pedersen<br />
kripe@danskebank.com<br />
+45 45128519<br />
Key credit issues<br />
Strengths:<br />
• Leading position in moderately<br />
cyclical lock market.<br />
• Strong diversification by geography<br />
and customer base.<br />
• Stability from high share of<br />
replacement sales.<br />
• Low price competition and<br />
stable cash flow.<br />
Challenges:<br />
• Exposure to demand volatility<br />
in cyclical construction markets.<br />
• High leverage from frequent acquisition<br />
activities.<br />
• Shareholder friendliness by<br />
high dividend payments.<br />
Source: <strong>Danske</strong> Markets<br />
68 | 13 April 2011<br />
www.danskeresearch.com
<strong>Scandi</strong> Handbook<br />
Liquidity<br />
We view Assa Abloy’s liquidity as adequate. At the end of 2010, the company had<br />
SEK1.3bn in cash and cash equivalents of which 99.8% are cash and bank deposits.<br />
This is supplemented by an undrawn back-up syndicated credit facility of EUR1.1bn<br />
(approximately SEK9.8bn) maturing in 2014. According to S&P, the credit facility is<br />
not subject to financial covenants or any material adverse change clause. Furthermore,<br />
Assa Abloy obtained a bridge loan of SEK14.3bn to finance the Cardo acquisition<br />
(consisting of three tranches, maturing in December 2011, June 2013 and December<br />
2013). Assa Abloy plans to refinance the bridge loan in the capital markets in<br />
2011.<br />
This compares with short-term interest-bearing liabilities of SEK2.9bn (equal to 24%<br />
of total debt). In 2009, all loan facilities set to mature in 2009 were refinanced at a<br />
total of SEK3.3bn and the debt maturity profile has improved from the somewhat<br />
front-end loaded level in 2008. Assa Abloy has SEK0.3bn of bonds maturing in<br />
2011.<br />
Current performance drivers<br />
Focus on acquisitions returned in 2010<br />
After a long period of acquisition-fuelled growth from 1996 to 2002 (revenue CAGR<br />
31%), Assa Abloy entered a phase more characterised by restructuring, cost cutting and<br />
rationalisation, although bolt-on acquisitions were still a vital part of the growth strategy<br />
to expand geographical reach and complement the product offering. CAGR in<br />
2003-2009 was 6.4%. However, in 2010 the pace of acquisitions has started to pick<br />
up again, including more medium-sized transactions.<br />
with the acquisition of Cardo stealing focus<br />
In December 2010, Assa Abloy announced the acquisition of Cardo which we consider<br />
the most important credit driver in the short term. Assa Abloy acquired 63.3%<br />
of the company for SEK7.2bn and subsequently launched an offer to tender the remaining<br />
shares in February 2011 (which brings the total price to SEK11.3bn). Currently<br />
Assa Abloy holds 98.9% of Cardo. However, Assa Abloy has dispose of<br />
Cardo’s Flow Solutions division for SEK5.9bn and plans to dispose of the Lorentzen<br />
& Wettre division as well.<br />
Assa Abloy has financed the transaction with a bridge loan of SEK14.3bn with intensions<br />
to refinance the facility in the capital markets in prudent time during 2011. We<br />
emphasize that 35% of the bridge loan matures at the end of 2011 so we anticipate that<br />
Assa Abloy could issue new bonds around Q2 11 or Q3 11.<br />
Debt-financing results in rating pressure<br />
On 15 December 2010, S&P placed Assa Abloy’s ‘A-’ credit rating on negative watch<br />
due to worries about integration risks and a possibly weaker stance on financial policies.<br />
However, in April the negative watch was removed and Assa Abloy was instead<br />
placed on a negative outlook due to integration risks. Although credit metrics will<br />
inevitably deteriorate due to the acquisition, Assa Abloy expects a swift improvement<br />
due to strong and stable cash flow.<br />
Dividend payout increased<br />
Assa Abloy has a dividend policy that aims to pay out 33-50% of net earnings. Assa<br />
Abloy does make the reservation, however, that it will always take into account longterm<br />
financing requirements when applying the dividend policy.<br />
That said, Assa Abloy will pay a dividend per share of SEK4.0 for fiscal year 2010,<br />
which is an increase of 11% y/y. During the economic downturn, Assa Abloy was also<br />
able to avoid reducing or eliminating dividend payments like other companies due to its<br />
stable operations and cash flow.<br />
Debt maturity profile<br />
(as of 31 December 2010)<br />
SEKbn<br />
4.0<br />
3.5<br />
3.0<br />
2.5<br />
2.0<br />
1.5<br />
1.0<br />
0.5<br />
0.0<br />
Source: Company data and <strong>Danske</strong> Markets<br />
Profitability<br />
SEKbn<br />
40<br />
35<br />
30<br />
25<br />
20<br />
15<br />
10<br />
5<br />
-<br />
< 1y 1y - 2y 2y - 5y > 5 y<br />
Source: Company data and <strong>Danske</strong> Markets<br />
Sales by segments, 2010<br />
Asia Pacific<br />
16%<br />
Americas<br />
25%<br />
Source: Company data and <strong>Danske</strong> Markets<br />
Credit metrics<br />
SEKbn<br />
21<br />
18<br />
15<br />
12<br />
9<br />
6<br />
3<br />
0<br />
2006 2007 2008 2009 2010<br />
Source: Company data and <strong>Danske</strong> Markets<br />
21%<br />
18%<br />
15%<br />
12%<br />
9%<br />
6%<br />
3%<br />
0%<br />
Sales EBITDA EBITDA margin (rhs)<br />
Global Tech<br />
13%<br />
Entrance Systems<br />
11%<br />
EMEA<br />
35%<br />
2006 2007 2008 2009 2010<br />
3.0x<br />
2.5x<br />
2.0x<br />
1.5x<br />
1.0x<br />
0.5x<br />
0.0x<br />
Adj. net debt Equity Adj. net debt/EBITDA<br />
69 | 13 April 2011<br />
www.danskeresearch.com
<strong>Scandi</strong> Handbook<br />
Recommendation<br />
We changed our recommendation to SELL (from HOLD) on 17 February 2011 with<br />
focus on a tight CDS. We view the Cardo acquisition and the related financing as the<br />
main short-term credit driver. The divestment of the Cardo Flow Solution for<br />
SEK5.9bn removes some of the refinancing pressure. However, while Assa Abloy<br />
has sound and stable fundamentals and could avoid a credit rating downgrade, the<br />
CDS could still widen on new bond issuance.<br />
The 5y CDS is currently trading at very tight levels (49/54bp) and we recommend<br />
investors to buy protection. Assa Abloy has no outstanding Eurobonds (only SEK<br />
and NOK bonds outstanding, which are not deliverable into the CDS) which can<br />
partially explain the technically tight CDS levels.<br />
Assa Abloy has stated it intends to refinance the SEK14.3bn bridge loan related to<br />
the Cardo acquisition in the capital markets during 2011, which could put the CDS<br />
under pressure and widen spreads (e.g. if Assa Abloy issues a Eurobond). 35% of the<br />
SEK14.3bn bridge loan will mature in December 2011 and we believe that Assa<br />
Abloy could refinance its bridge financing in prudent time ahead of this deadline.<br />
Hence we would not be surprised to see a bond issue in Q2 11 or Q3 11.<br />
70 | 13 April 2011<br />
www.danskeresearch.com
<strong>Scandi</strong> Handbook<br />
Financial data - Assa Abloy<br />
Key figures (SEKm) 2006 2007 2008 2009 2010<br />
Net Sales 31,137 33,550 34,918 34,963 36,823<br />
EBITDAR 5,661 6,367 6,447 6,426 7,041<br />
EBIT (1) 4,763 5,458 5,526 5,413 6,045<br />
Net interest expenses 663 849 770 634 680<br />
Net profit 1,756 3,368 2,438 2,659 4,080<br />
FFO (2) 3,672 3,896 4,374 4,464 5,367<br />
Gross capex 905 1,050 829 752 1,092<br />
EBITDA-capex 4,756 5,317 5,618 5,674 5,949<br />
RCF (3) 2,483 2,707 3,057 3,147 4,050<br />
FCF (4) 874 1,632 2,223 3,855 3,320<br />
Net debt 12,389 12,953 14,013 11,048 10,564<br />
Adjusted net debt (5) 14,034 14,981 14,841 12,005 11,473<br />
Total capital 25,936 28,976 34,192 31,927 31,819<br />
Ratios 2006 2007 2008 2009 2010<br />
EBITDAR margin (%) 18.2% 19.0% 18.5% 18.4% 19.1%<br />
EBIT margin (%) 15.3% 16.3% 15.8% 15.5% 16.4%<br />
Capex/Net revenues (%) 2.9% 3.1% 2.4% 2.2% 3.0%<br />
EBITDAR/Net interest expenses (x) 8.5x 7.5x 8.4x 10.1x 10.4x<br />
Net debt/EBITDA (x) 2.2x 2.0x 2.2x 1.7x 1.5x<br />
Adjusted net debt/EBITDA (x) 2.5x 2.4x 2.3x 1.9x 1.6x<br />
FFO/Adjusted net debt 26% 26% 29% 37% 47%<br />
RCF/Adjusted net debt 18% 18% 21% 26% 35%<br />
Net debt/Total capital (%) 48% 45% 41% 35% 33%<br />
(1) Adjusted for non-recurring items. (2) Funds from operations. (3) FFO less dividends. (4) RCF less capex and after changes in working capital.<br />
(5) Net debt adjusted for operating leases and contingent liabilities.<br />
Source: Company data and <strong>Danske</strong> Fixed Income Credit Research<br />
Quarterly review (SEKm)<br />
Q4 09 Q1 10 Q2 10 Q3 10 Q4 10<br />
Net sales 8,799 8,345 9,356 9,474 9,648<br />
EBIT 468 1,295 1,515 1,630 1,606<br />
EBIT margin 5% 16% 16% 17% 16.6%<br />
Net income 200 880 1,031 1,099 1,071<br />
Net debt (reported) 11,048 11,469 12,608 10,864 10,564<br />
Net debt/LTM EBITDA 1.7x 1.9x 1.8x 1.4x 1.4x<br />
Source: Company data and <strong>Danske</strong> Fixed Income Credit Research<br />
Divisional quarterly review (SEKm)<br />
Q4 09 Q1 10 Q2 10 Q3 10 Q4 10<br />
EMEA Net sales 3,544 3,296 3,311 3,065 3,364<br />
EBIT margin 16.8% 15.9% 15.9% 17.0% 18.0%<br />
Americas Net sales 2,108 2,205 2,503 2,537 2,291<br />
EBIT margin 19.5% 19.0% 19.7% 20.3% 20.0%<br />
Asia Pacific Net sales 1,044 1,014 1,566 1,735 1,766<br />
EBIT margin 13.8% 10.3% 14.2% 15.6% 13.9%<br />
Global Technologies Net sales 1,145 1,085 1,240 1,365 1,325<br />
EBIT margin 16.2% 17.0% 16.8% 18.1% 16.9%<br />
Entrance Systems Net sales 1,152 954 1,012 987 1,118<br />
EBIT margin 17.0% 14.0% 14.3% 15.4% 17.7%<br />
Source: Company data and <strong>Danske</strong> Fixed Income Credit Research<br />
71 | 13 April 2011<br />
www.danskeresearch.com
<strong>Scandi</strong> Handbook<br />
Atlas Copco<br />
Company overview<br />
Swedish Atlas Copco, founded in 1873, is an industrial machinery manufacturer. The<br />
company is the global market leader in its Industrial Technique and Compressor<br />
Technique divisions and holds leading positions in the Construction and Mining<br />
Technique business. High exposure to cyclicality is alleviated by diversification by<br />
geography and customer base, a high share of aftermarket sales, relatively flexible<br />
costs and high barriers to entry. The group employs some 33,000 people, operates in<br />
more than 170 countries and had revenues of SEK70bn in 2010. The largest shareholder<br />
is the Sweden-based investment holding company Investor AB, accounting for<br />
17% of the share capital and 22% of the voting rights.<br />
Key credit considerations<br />
Leading market positions<br />
Atlas Copco operates through three major divisions: Compressor Technique (49% of<br />
sales in 2010), Construction and Mining Technique (42% of sales in 2010) and Industrial<br />
Technique (9% of sales in 2010). Compressor Technique produces and services<br />
compressors, turbines and pumps. Construction and Mining Technique produces<br />
and services rock-drilling equipment, tunnelling equipment, construction tools<br />
and demolition tools, whereas Industrial Technique produces industrial power tools<br />
and assembly systems. Atlas Copco holds market leading positions in all three divisions<br />
and is the world leader in compressors with a one-third share of the market.<br />
Atlas Copco is well positioned in terms of product development capabilities, branding<br />
and reputation, distribution channels and cost efficiency. Despite barriers to entry<br />
there is meaningful competition and some pricing pressure in several business areas.<br />
Resilience to cyclicality<br />
Atlas Copco is exposed to cyclical demand in all three business areas. This is, however,<br />
mitigated through broad geographical and customer base diversification and a<br />
high share of aftermarket and rental revenues, at about 40% of total revenues. Aftermarket<br />
sales contribute to the high margin performance, a more stable cash flow, and<br />
help to reduce the capital intensiveness of the group. In 2010, 32% of revenues were<br />
derived from Europe, 18% from North America, 28% from Asia and Australia, 11%<br />
from Africa and Middle East and 11% from South America. A strategy of focusing<br />
production on core components and assembly, while outsourcing less vital components,<br />
creates flexibility toward fluctuations in demand. As a result, a relatively low<br />
fixed-cost base contributes to lower earnings volatility.<br />
Strong and stable cash flow generation but shareholder friendly policy<br />
Following increasing debt levels in 2007 and 2008, Atlas Copco’s strong free cash<br />
flows in 2009 and 2010 were used to significantly reduce debt. Adjusted net debt<br />
declined to SEK13bn end-2010 from SEK29bn end-2008. FFO generation declined<br />
but showed remarkable resilience in 2009, manifesting the strong internal cash generation<br />
even during brutal downturns. In 2010, FFO increased by more than 50%,<br />
ending at SEK13bn – i.e. above pre-crises levels. Then, on 2 February 2011, Atlas<br />
Copco announced a proposed increase in the ordinary dividend to SEK4/share<br />
(SEK3/share last year), which is combined with an extraordinary distribution of<br />
SEK5/share, through a share split and subsequent mandatory redemption. The total<br />
shareholder distribution amounts to SEK11bn. Despite this shareholder friendly<br />
action, on 24 February 2011, S&P upgraded its rating of Atlas Copco to ‘A’ (Stable)<br />
from ‘A-’, primarily due to the afore mentioned strong and stable cash flows.<br />
HOLD<br />
Sector: Industrials, Machinery<br />
Corporate ticker: ATCOA<br />
Equity ticker: ATCOA SS<br />
Market cap: SEK199bn<br />
Ratings:<br />
S&P rating: A /S<br />
Moodys rating: A3 /S<br />
Fitch rating: NR<br />
Analyst:<br />
Kristian Myrup Pedersen<br />
kripe@danskebank.dk<br />
+45 45128519<br />
Asbjørn Purup Andersen<br />
apu@danskebank.dk<br />
+45 45148886<br />
Key credit issues<br />
Strengths:<br />
• World-leading market position.<br />
• Strong customer segment and<br />
geographical diversification.<br />
• High-margin and relatively stable<br />
aftermarket services.<br />
• Strong cash flow generation and<br />
resilient credit metrics through<br />
the crisis.<br />
Challenges:<br />
• Cyclical demand.<br />
• Shareholder-friendly financial policies.<br />
• Lack of quantitative targets on the<br />
balance sheet.<br />
• Operating leverage and capital<br />
intensiveness although less than<br />
peers.<br />
Source: <strong>Danske</strong> Markets<br />
72 | 13 April 2011<br />
www.danskeresearch.com
<strong>Scandi</strong> Handbook<br />
Liquidity<br />
End-2010, cash and cash equivalents amounted to SEK14.3bn. In addition to this,<br />
Atlas Copco has USD1bn committed revolving credit facility maturing 2012 together<br />
with a SEK6.4bn committed facility maturing in 2017. According to S&P, these<br />
facilities are free of financial covenants. As of end-2010, neither of the two facilities<br />
has ever been utilised. Moreover, Atlas Copco generated strong FCFs of SEK9.2bn<br />
and SEK5.5bn in 2009 and 2010, respectively. This compares with a favourable<br />
back-end loaded debt maturity profile with a limited amount of debt maturing before<br />
2014.<br />
However, at the AGM last year, the board was granted a mandate to acquire up to a<br />
maximum of 5% of all issued shares. If the mandate to acquire the maximum 5% of<br />
shares is fully utilised, this currently corresponds to a SEK7.5bn cash outflow. S&P<br />
views a maximum utilisation as highly unlikely on the back of the share redemption<br />
programme for 2011. We believe Atlas Copco has a strong liquidity position.<br />
Current performance drivers<br />
Strong FY 2010<br />
Atlas Copco had a very strong 2010, as it benefited from the continued increase in<br />
global industrial production. Orders received significantly increased in all divisions,<br />
amounting to a 29% increase on a group basis to SEK75bn for the FY 2010. Net<br />
sales were up 10% to SEK70bn and net profit was up by almost 60% to SEK10bn.<br />
In Q4 10, Atlas Copco continued the strong momentum from the first three quarters<br />
of the year and reported key numbers slightly ahead of consensus expectations.<br />
Revenue increased 22% y/y after a 4% currency headwind to SEK19.4bn, while the<br />
operating profit margin was 20.7% (21.3% in the previous quarter and 15.4% in the<br />
same period last year). Net profit improved year-on-year and sequentially to<br />
SEK2.9bn.<br />
Order intake increased 27% y/y to SEK19.3bn. While being significantly ahead of<br />
the same period last year, demand also increased “somewhat” sequentially – particularly<br />
in mining and industrial equipment. Demand continued to improve in North<br />
America (18% of net sales in 2010) while the development was mixed in Europe<br />
(32%) with very positive momentum in eastern Europe and softer demand in southern<br />
and western Europe. Demand remained strong or very strong in South America<br />
(11%), Africa/Middle East (11%) and Asia/Australia (28%). Overall, the company<br />
expects demand to “increase somewhat” in the near-term and demand in emerging<br />
markets, as well as from the mining industry, is expected to remain strong.<br />
Credit metrics improvement rating upgraded by S&P<br />
In 2010, FFO increased by more than 50% to SEK13.2bn, compared to SEK8.5bn in<br />
2009, and notably, it is now higher than pre-crisis levels. However, due the an impressive<br />
NWC release of SEK6.7bn back in 2009, the 2010 FCF of SEK5.5bn was<br />
actually down by about 40% compared to 2009. Compared with pre-crisis levels in<br />
2007 and 2008, on the other hand, FCF more than doubled in 2010. This very strong<br />
cash flow generation has partially been used for debt reductions. Therefore, adjusted<br />
net debt to EBITDA declined to 0.8x end-2010, compared with 1.6x and 1.8x in 2009<br />
and 2008, respectively. FFO to adjusted net debt also improved to 104% in 2010,<br />
compared with 46% and 42% in 2009 and 2008. Despite Atlas Copco’s shareholder<br />
friendly actions (read more below), S&P upgraded its rating of Atlas Copco to ‘A’<br />
(Stable) from ‘A-’ on 24 February 2011, primarily due to the strong cash flow.<br />
Debt maturity profile (end-2010)<br />
SEK bn<br />
8<br />
7<br />
6<br />
5<br />
4<br />
3<br />
2<br />
1<br />
0<br />
Source: Company data and <strong>Danske</strong> Markets<br />
Profitability<br />
SEK bn<br />
80<br />
70<br />
60<br />
50<br />
40<br />
30<br />
20<br />
10<br />
0<br />
Source: Company data and <strong>Danske</strong> Markets<br />
Sales by geography 2010<br />
Asia/Austr<br />
alia<br />
28%<br />
Source: Company data and <strong>Danske</strong> Markets<br />
Credit metrics<br />
2011 2012 2013 2014 2015 2016+<br />
2006 2007 2008 2009 2010<br />
Source: Company data and <strong>Danske</strong> Markets<br />
25%<br />
20%<br />
15%<br />
10%<br />
5%<br />
0%<br />
Net sales EBITDA EBITDA margin<br />
Africa/Midd<br />
le East<br />
11%<br />
SEK bn<br />
35<br />
30<br />
25<br />
20<br />
15<br />
10<br />
5<br />
0<br />
-5<br />
-10<br />
North<br />
America<br />
18%<br />
Europe<br />
32%<br />
South<br />
America<br />
11%<br />
2006 2007 2008 2009 2010<br />
2,0<br />
1,5<br />
1,0<br />
0,5<br />
0,0<br />
-0,5<br />
-1,0<br />
Adj. net debt Equity Adj. net debt/EBITDA<br />
73 | 13 April 2011<br />
www.danskeresearch.com
<strong>Scandi</strong> Handbook<br />
Shareholder rewards are acceptable under current ratings<br />
Unsurprisingly, in February 2010, Atlas Copco announced a proposed increase in the<br />
ordinary dividend to SEK4/share (SEK3/share last year), which is combined with an<br />
extraordinary distribution of SEK5/share through a share split and subsequent mandatory<br />
redemption. The total distribution amounts to SEK11bn.<br />
While payment of the redemption shares would not be made until mid-June 2011, an<br />
immediate payment of the total SEK11bn distribution results in an adjusted net<br />
debt/EBITDA of 1.4x (0.8x end-2010) and a FFO/adjusted net debt of 56% (104%<br />
end-2010). For the current rating, S&P expects adjusted net debt/EBITDA of 1.5x<br />
and FFO to adjusted net debt above 50%.<br />
However, at the annual general meeting last year, the board was granted a mandate to<br />
acquire up to a maximum of 5% of all issued shares. If the mandate to acquire the<br />
maximum 5% of shares is fully utilised, this corresponds to an SEK7.5bn cash outflow.<br />
Atlas Copco furthermore hiked its long-term dividend ratio target to 50% of EPS.<br />
This represents an increase, as the ratio has averaged 41% over the last 10 years.<br />
While higher dividend payments going forward are credit negative, we also note that<br />
Atlas Copco on several occasions has paid out an extraordinary dividend to rebalance<br />
its capital structure. Hence, we are not overly concerned about the hiked target.<br />
Therefore, in our view, Atlas Copco has enough headroom for the SEK11bn distribution<br />
to shareholders within the rating metrics, but negative pressure could arise if the<br />
board decides to fully utilise the share buyback programme on top of this. S&P views<br />
a maximum utilisation as highly unlikely on the back of the share redemption programme<br />
for 2011. We share this view and are comfortable with current ratings.<br />
Financial targets we do not expect a near-term repeat of 2007<br />
Atlas Copco has a declared revenue growth target of 8% annually. Growth is to be<br />
achieved largely through organic growth with the remainder coming from selected<br />
acquisitions. Although the majority focus on organic growth is credit positive, a lack<br />
of capitalisation and gearing related targets reduces visibility on the balance sheet.<br />
However, comfort to credit investors is provided by an objective of maintaining a<br />
solid investment grade rating.<br />
In 2007, Atlas Copco reversed a SEK13bn net cash position to a SEK19bn net debt<br />
position in a single year. This followed large shareholder distributions, including<br />
share repurchases, as well as acquisitions. The current mandate to acquire up to 5%<br />
of outstanding shares is likely to result in negative rating pressure if fully utilised in<br />
2011, as it would take the total distribution to shareholders to SEK18.5bn. However,<br />
we would be surprised to see such significant shareholder friendliness repeated today,<br />
although Atlas Copco, in line with other larger companies, has been increasingly<br />
shareholder friendly in 2010 and the beginning of 2011.<br />
Recommendation<br />
ATCOA 2014 (around ASW +24/18bp) should – and does – trade substantially<br />
tighter than lower-rated METSO 2014 (around ASW +94/88bp) and SANDVK 2014<br />
(around ASW +83/77bp) but only slightly tighter than almost equally-rated SKF<br />
2013 (around ASW +38/28bp). This is emphasised by the comparably strong credit<br />
metrics and resilience through the past few turbulent years. The bond is well placed<br />
with buy-and-hold investors, and thus fairly illiquid. ATCOA trades tighter than a<br />
fair market curve of industrials in the A category and we do not see further relative<br />
tightening potential nor catalysts for a widening. We recommend to HOLD ATCOA<br />
2014 and have a neutral view on 5y CDS trading around 49/54bp.<br />
74 | 13 April 2011<br />
www.danskeresearch.com
<strong>Scandi</strong> Handbook<br />
Financial data Atlas Copco<br />
Key figures (SEKm) 2006 2007 2008 2009 2010<br />
Net sales 50,512 63,355 74,177 63,762 69,875<br />
EBITDA (1) 11,391 13,925 15,960 11,635 16,495<br />
EBIT (1) 9,249 12,125 13,880 9,165 13,997<br />
Net interest expenses 654 453 1,243 808 423<br />
Net profit 15,373 7,469 10,190 6,276 9,944<br />
FFO (2) 11,906 10,361 12,373 8,531 13,190<br />
Capex 2,168 2,359 2,899 1,723 1,693<br />
EBITDA-capex 9,223 11,566 13,061 9,912 14,802<br />
OpFCF (3) 10,824 9,045 9,915 16,214 12,905<br />
FCF (4) 4,361 2,417 2,317 9,229 5,482<br />
Net debt (5) -12,995 19,196 23,027 11,802 5,850<br />
Adjusted net debt (6) -5,668 25,412 29,174 18,705 12,646<br />
Total capital 39,848 37,309 52,250 49,638 49,435<br />
Ratios<br />
EBITDA margin (%) 22.6% 22.0% 21.5% 18.2% 23.6%<br />
EBIT margin (%) 18.3% 19.1% 18.7% 14.4% 20.0%<br />
Capex/net revenues (%) 4.3% 3.7% 3.9% 2.7% 2.4%<br />
EBITDA/net interest expenses (x) 17.4x 30.7x 12.8x 14.4x 39.0x<br />
FFO/net debt (%) nm 54.0% 53.7% 72.3% 225.5%<br />
FFO/adj net debt (%) nm 40.8% 42.4% 45.6% 104.3%<br />
Net debt/EBITDA (x) nm 1.4x 1.4x 1.0x 0.4x<br />
Adj net debt/EBITDA (x) nm 1.8x 1.8x 1.6x 0.8x<br />
Net debt/total capital (%) nm 51% 44% 24% 12%<br />
(1) Adjusted for non-recurring items and operating leases. (2) Net income after tax plus depreciation and amortization, deferred tax and other non cash items.<br />
Adjusted for operating leases. (3) CFO plus interest and taxes paid less capex. (4) OpFCF less interest paid, tax paid, and dividends. (5) Total interest-bearing debt<br />
less cash and marketable securities. (6) Net debt adjusted for operating leases, postretirement liabilities and contingent liabilities. Source: Company data and<br />
<strong>Danske</strong> Markets<br />
Quarterly review (SEKm)<br />
Q4 09 Q1 10 Q2 10 Q3 10 Q4 10<br />
Net sales 15,942 15,301 17,430 17,743 19,401<br />
EBIT 2,450 2,627 3,499 3,782 4,007<br />
EBIT margin (%) 15.4% 17.2% 20.1% 21.3% 20.7%<br />
Net income 1,700 1,855 2,523 2,650 2,916<br />
Net debt 11,802 10,969 12,446 8,895 5,850<br />
Adj net debt/LTM EBITDA (x) 1.6 1.5 1.4 1.1 0.6<br />
LTM FFO/adj net debt (%) 45.4% 48.8% 56.5% 79.9% 134.0%<br />
Source: Company data and <strong>Danske</strong> Markets<br />
Divisional quarterly overview (SEKm)<br />
Q4 09 Q1 10 Q2 10 Q3 10 Q4 10<br />
Compressor Technique Sales 8,144 7,659 8,615 8,877 9,451<br />
EBIT margin 19.6% 20.6% 23.2% 26.0% 23.7%<br />
Construction & Mining Sales 6,395 6,233 7,393 7,357 8,173<br />
Technique EBIT margin 14.1% 15.4% 18.0% 17.8% 20.1%<br />
Industrial Technique Sales 1,455 1,483 1,535 1,569 1,885<br />
EBIT margin 7.4% 16.4% 18.8% 20.2% 21.9%<br />
Source: Company data and <strong>Danske</strong> Markets<br />
75 | 13 April 2011<br />
www.danskeresearch.com
<strong>Scandi</strong> Handbook<br />
Carlsberg<br />
Company overview<br />
Carlsberg is the fourth-largest brewery group in the world and holds market-leading<br />
positions in low-cyclical markets. The acquisition of assets from S&N in 2008 gave<br />
Carlsberg full ownership of Russian BBH and a market-leading position in France<br />
with the Kronenbourg brand. Carlsberg is one of the largest breweries in the mature<br />
Western European market and it has no. 1 positions in <strong>Scandi</strong>navia (50% market<br />
share), Russia (40%) and France (30%). While Carlsberg is committed to maintaining<br />
an investment-grade rating, the S&N acquisition resulted in materially increased<br />
debt levels. During 2009 and 2010, credit metrics strengthened significantly. The<br />
largest shareholder is the Carlsberg Foundation, holding 30% of the share capital and<br />
70% of the voting shares.<br />
Key credit considerations<br />
Market-leading positions in low-cyclical markets<br />
Carlsberg is the fourth-largest brewery group in the world ranking behind AB InBev,<br />
SAB Miller and Heineken. Carlsberg sold 137m hl of beer and 23m hl of other beverages<br />
in 2010 and holds market-leading positions in low-cyclical markets. Carlsberg<br />
is one of the largest breweries in the mature Western European market. Sluggish<br />
population growth, an ageing population and a substitution trend towards wine and<br />
other alcoholic beverages have caused Western European beer volumes to stagnate.<br />
Hence, Carlsberg has a strong focus on cost efficiency and increased premiumisation.<br />
Still, the mature markets generate strong cash flow, characterised by low volatility.<br />
Carlsberg has a strong and diversified brand portfolio and is the owner of four of<br />
Europe’s top 10 beer brands by volume. Brands vary considerably in volume, price,<br />
target audience and geographical representation.<br />
Increased exposure to emerging markets<br />
The acquisition of assets from S&N in 2008 gave Carlsberg full ownership of Russian<br />
BBH and S&N’s activities in France, Greece, China and Vietnam. As a result,<br />
Carlsberg’s exposure to emerging markets has increased significantly and Eastern<br />
Europe accounted for 45% of EBIT in 2010. Carlsberg is by far the largest brewer in<br />
Russia and is focussing on growing its market share in Eastern Europe and Asia.<br />
While these markets offer higher growth potential, they come with higher business<br />
risk and expected cash-flow volatility. This was most recently exemplified by the<br />
increased excise duties in Russia as of 1 January 2010, together with political discussions<br />
about further curbing alcohol consumption by banning sale through certain<br />
channels and advertising restrictions.<br />
Significant deleveraging in 2009/10: rating upgraded in 2011<br />
The acquisition of assets from S&N resulted in a substantially increased debt burden<br />
and credit metrics close to high-yield territory. However, very strong free cash flow<br />
generation in both 2009 and 2010, as well as a reduced payout ratio, have materially<br />
improved the credit metrics, demonstrating Carlsberg’s strong commitment to maintaining<br />
its investment-grade rating. As Carlsberg has performed well despite challenging<br />
market conditions in recent years, as well as delivering the planned deleveraging,<br />
it was upgraded one notch by Fitch and Moody’s in February 2011. Carlsberg<br />
has regained financial flexibility to acquire further assets, and in August and December<br />
2010 the CEO reiterated the acquisition plans in Asia. In addition, in March 2011<br />
the Chairman stated that the company could raise as much as DKK50bn for acquisitions.<br />
Increased leverage may be ahead, but we take some comfort in management’s<br />
repeated statements on its commitment to the investment-grade rating.<br />
HOLD<br />
Sector: Beverages<br />
Corporate ticker: CARLB<br />
Equity ticker: CARLB DC<br />
Market cap: DKK90bn<br />
Ratings:<br />
S&P rating: NR<br />
Moodys rating: Baa2 /S<br />
Fitch rating: BBB /S<br />
Analyst:<br />
Kristian Myrup Pedersen<br />
kripe@danskebank.dk<br />
+45 45128519<br />
Asbjørn Purup Andersen<br />
apu@danskebank.dk<br />
+45 45148886<br />
Key credit issues<br />
Strengths:<br />
• Leading positions in low-cyclical<br />
markets.<br />
• Strong brand portfolio in all segments.<br />
• Positioned to capture long-term<br />
Russian growth potential.<br />
• Strong free cash flow generation<br />
and deleveraging in 2009/10.<br />
Challenges:<br />
• Increased exposure to emerging<br />
markets.<br />
• Risk of debt-financed M&A.<br />
• Stagnating beer consumption in<br />
mature markets.<br />
• Ambitious growth strategy could<br />
lead to excessive risk-taking.<br />
Source: <strong>Danske</strong> Markets<br />
76 | 13 April 2011<br />
www.danskeresearch.com
<strong>Scandi</strong> Handbook<br />
Liquidity<br />
As of end-2010, Carlsberg reported cash and cash equivalents of DKK2.7bn, shortterm<br />
debt of DKK4bn and a larger refinancing need in 2012. Due to improved operating<br />
profit, lower capex and a release of working capital, Carlsberg has recently<br />
generated very strong FOCF, supporting debt reductions.<br />
On 1 October 2010, Carlsberg announced that it had signed a new five-year revolving<br />
credit facility, amounting to EUR1.75bn, to partially refinance the S&N acquisition<br />
facilities and extend the debt maturity profile, which peaked in 2012. According<br />
to Fitch, the new 5Y facility was virtually undrawn by year-end. In addition to this,<br />
on 6 October 2010, Carlsberg launched a EUR1bn bond, maturing in 2017, using the<br />
proceeds to refinance the remaining part of the acquisition facility maturing in 2012<br />
and for general corporate purposes. As a result, Carlsberg has significantly extended<br />
its debt maturity profile and we view the liquidity position as strong.<br />
Current performance drivers<br />
Strong 2010 performance and significant full-year earnings upgrade<br />
FY 10 was very strong from an earnings perspective, with consolidated profit up<br />
more than 40% to DKK6bn in 2010, from DKK4.2bn in 2009, with almost flat net<br />
sales (up 1.1% to DKK60bn). The FY 10 operating margin was an impressive 17.1%,<br />
up from 15.8% in the FY 09. However, the year ended a bit softer, as Carlsberg reported<br />
Q4 10 sales of DKK13.4bn (down 2% y/y), clean EBIT of DKK1.1bn (down<br />
33% y/y) and consolidated profit of DKK380m (down 25% y/y), all slightly behind<br />
consensus expectations. The group’s operating margin in Q4 weakened to 8.2%,<br />
from 12.1% in the same period last year, reflecting significant regional differences<br />
and strong comparison numbers from Q4 09.<br />
Debt maturity profile (end- 2010)<br />
DKKm<br />
14000<br />
12000<br />
10000<br />
8000<br />
6000<br />
4000<br />
2000<br />
0<br />
5y<br />
Source: Company data, <strong>Danske</strong> Markets<br />
Profitability<br />
DKKm<br />
25%<br />
60.000<br />
50.000<br />
20%<br />
40.000<br />
15%<br />
30.000<br />
10%<br />
20.000<br />
5%<br />
10.000<br />
0<br />
0%<br />
2006 2007 2008 2009 2010<br />
Sales EBITDA EBITDA-Margin (rhs)<br />
Source: Company data, <strong>Danske</strong> Markets<br />
In 2010, the beer market in Northern & Western Europe declined by 2-3%, but this<br />
compares with a 5% fall in 2009. The positive story is that Carlsberg managed to<br />
boost its market share by around 50bp in the region, despite the challenging market.<br />
In Eastern Europe, the group suffered from tough comparisons, due to Russian stockbuilding<br />
in the same period last year, ahead of the excise duty increase on 1 January<br />
2010. However, most markets in the region improved throughout the year. In Asia,<br />
on the other hand, the performance was very strong, with high organic volume and<br />
revenue growth, combined with significantly higher operating margins.<br />
EBIT by segment, 2010<br />
Eastern<br />
Europe;<br />
45%<br />
Asia; 9%<br />
Northern<br />
and<br />
Western<br />
Europe;<br />
46%<br />
In 2011, Carlsberg expects a low single-digit decline in Northern & Western Europe<br />
and 2-4% Russian market growth. Carlsberg guides for increased input costs, which<br />
will be mitigated by higher sales prices in all regions. This mirrors comments from<br />
peers, indicating price discipline in the sector, which is credit-positive.<br />
Acquisition appetite increasing again: rating upgrade potential limited<br />
Following the acquisition of assets from S&N in 2008, the credit metrics have improved<br />
significantly. Looking at adjusted net debt to EBITDA clearly tells the story,<br />
as the number was down to 2.6x by the end of 2010, compared with 3x and 4.2x in<br />
2009 and 2008, respectively. In addition, FFO to adjusted net debt was up to 29% at<br />
the end of 2010, compared with 26% and 14% in 2009 and 2008, respectively. This<br />
improved financial strength was highlighted by the one-notch upgrade to BBB and<br />
Baa2 by Fitch and Moody’s in February 2011.<br />
However, the acquisition appetite is rising again. In June 2010, Carlsberg announced<br />
that it would increase its shareholding in Chongqing Brewery Co. (CBC) from<br />
17.46% to 29.71%. The DKK2.1bn transaction was conditional on a number of steps<br />
and approvals by authorities and minority shareholders, but it went through at the end<br />
of December 2010. As Carlsberg is also pursuing smaller and bolt-on acquisitions,<br />
mainly in Asia and Eastern Europe, we do not expect the credit metrics to improve<br />
much further. While these markets offer higher growth potential, this strategy also<br />
Northern and Western Europe Eastern Europe Asia<br />
Source: Company data and <strong>Danske</strong> Markets<br />
Credit metrics<br />
DKKm<br />
X<br />
4<br />
60.000<br />
50.000<br />
3,5<br />
40.000<br />
30.000<br />
3<br />
20.000<br />
2,5<br />
10.000<br />
0<br />
2<br />
2006 2007 2008 2009 2010<br />
Net debt Equity (incl. minority) Net debt/EBITDA (rhs)<br />
Source: Company data, <strong>Danske</strong> Markets<br />
77 | 13 April 2011<br />
www.danskeresearch.com
<strong>Scandi</strong> Handbook<br />
much further. While these markets offer higher growth potential, this strategy also<br />
comes with higher business risk and expected cash-flow volatility. On several occasions,<br />
CEO Rasmussen has stated that the company may consider buying a further<br />
stake in Chongqing Brewery Co.<br />
Then, in March 2011, according to a Danish newspaper, the Chairman of Carlsberg<br />
said that the company could raise as much as DKK50bn for acquisitions. However,<br />
he did not elaborate on either the financing sources or the acquisition targets. In our<br />
view, this (hypothetical) statement on further acquisitions is in line with previous<br />
ones from the group. However, as the Chairman is now taking the ‘indications of<br />
interest’ to the next level by mentioning specific numbers, we view the “M&A risk”<br />
as now being more material than before. Therefore, from a credit perspective, this is<br />
slightly negative, even though it is in line with expectations. While the number mentioned<br />
could significantly leverage Carlsberg’s balance sheet, we take some comfort<br />
in management’s repeated commitment to an investment-grade rating. However, we<br />
believe that the credit metrics may have peaked for now and we see no further upside.<br />
Improved margin performance<br />
As of end-2009, Carlsberg raised its medium-term (three to five years) operating<br />
margin targets as follows:<br />
• Northern & Western Europe: 15-17% (old target: 14-16%).<br />
• Eastern Europe: 26-29% (old target: 23-25%).<br />
• Asia: 15-20% (no previous concrete target).<br />
• Carlsberg Group: around 20% (no previous concrete target).<br />
In 2010, the operating margin at group level increased to 17.1%, from 15.8% in<br />
2009, i.e. the margin improved but was still behind the medium-term target. In<br />
Northern & Western Europe, the margin is also short of the target but improving, as<br />
it increased to 14.1% in 2010, compared with 11.6% in 2009. In Eastern Europe and<br />
Asia, the medium-term targets are met by 2010 margins of 27.8% and 18.6%, respectively.<br />
As the numbers show, Carlsberg’s margins in Eastern Europe are very attractive.<br />
Corporate structure: Carlsberg Breweries A/S is the rated entity<br />
The rated entity and issuer of (most) capital-market debt, Carlsberg Breweries A/S, is<br />
wholly owned by Carlsberg A/S. The Carlsberg Foundation owns 30% of the share<br />
capital and 70% of the voting shares in Carlsberg A/S. Some real estate assets (e.g.<br />
the Valby property, which is currently up for sale) are owned by Carlsberg A/S, but<br />
Carlsberg Breweries A/S is the owner of the operating subsidiaries (i.e. breweries).<br />
As Carlsberg pursues a centralised funding and risk management strategy, only a<br />
small part of debt in operating subsidiaries structurally subordinates senior unsecured<br />
issuance out of Carlsberg Breweries A/S (well below S&P’s threshold for notching).<br />
Recommendation<br />
The CARLB curve has tightened and flattened materially, and we do not see further<br />
relative tightening potential compared with peers (HEIANA, SABLN, ABIBB, etc.).<br />
CARLB 2014 and 2017 are currently trading around ASW+78/76bp and<br />
ASW+90/86bp, respectively. We keep our HOLD recommendation on both bonds.<br />
We are slightly negative on the 5Y CDS, which is trading around 85/95bp.<br />
78 | 13 April 2011<br />
www.danskeresearch.com
<strong>Scandi</strong> Handbook<br />
Financial data Carlsberg<br />
Key figures (DKKm) 2006 2007 2008 2009 2010<br />
Net Sales 41,083 44,750 59,944 59,382 60,054<br />
EBITDA 6,999 8,030 11,605 13,159 14,236<br />
EBIT 4,046 5,262 7,978 9,390 10,249<br />
Net interest expenses 1,029 1,076 2,386 2,161 1,933<br />
Consolidated profit 2,171 2,596 3,193 4,167 5,960<br />
FFO (1) 4,340 5,404 6,707 10,265 10,667<br />
Capex 3,188 4,929 5,292 2,767 3,326<br />
EBITDA-Capex 3,811 3,101 6,313 10,392 10,910<br />
RCF (2) 3,700 4,609 5,798 9,422 9,770<br />
FCF (3) 901 -550 2,062 10,330 7,160<br />
Net debt (4) 19,229 19,726 44,156 35,679 32,743<br />
Adjusted net debt (5) 22,403 22,906 48,163 39,550 36,802<br />
Total capital (6) 41,784 43,198 109,272 98,886 106,175<br />
Ratios<br />
EBITDA margin (%) 17.0% 17.9% 19.4% 22.2% 23.7%<br />
EBIT margin (%) 9.8% 11.8% 13.3% 15.8% 17.1%<br />
Capex/Net revenues (%) 8% 11% 9% 5% 6%<br />
EBITDA/Net interest exp. (x) 6.8x 7.5x 4.9x 6.1x 7.4x<br />
Net debt/EBITDA (x) 2.7x 2.5x 3.8x 2.7x 2.3x<br />
Adjusted net debt/EBITDA (x) 3.2x 2.9x 4.2x 3.0x 2.6x<br />
FFO/Adjusted net debt 19% 24% 14% 26% 29%<br />
RCF/Adjusted net debt 17% 20% 12% 24% 27%<br />
(1) CFO before change in NWC (2) FFO less dividend (3) CFO less dividend and capex. (4) Total interest-bearing debt less cash and marketable securities. (5) Net<br />
debt adjusted for pensions, operational leasing and contingent liabilities as reported. (6) Total equity plus total debt. Source: Company data, <strong>Danske</strong> Markets<br />
Divisional quarterly overview (DKKm)<br />
Q4 09 Q1 10 Q2 10 Q3 10 Q4 10<br />
North & Western Net sales 8,451 7,309 10,199 10,198 8,450<br />
Europe Clean EBIT 657 406 1,892 1,949 839<br />
Margin 8% 6% 19% 19% 10%<br />
Eastern Europe Net sales 4,103 2,386 6,294 6,016 3,491<br />
Clean EBIT 1,092 321 2,276 1,969 482<br />
Margin 27% 13% 36% 33% 14%<br />
Asia Net sales 1,041 1,234 1,492 1,464 1,423<br />
Clean EBIT 147 231 299 320 194<br />
Margin 14% 19% 20% 22% 14%<br />
Source: <strong>Danske</strong> Markets, company data<br />
79 | 13 April 2011<br />
www.danskeresearch.com
<strong>Scandi</strong> Handbook<br />
Electrolux<br />
Company overview<br />
Sweden’s Electrolux is one of the world’s largest manufacturers of white goods<br />
through a combination of acquisitions and disposals. With leading brands such as<br />
Electrolux, AEG and Zanussi, its products include refrigerators, cookers, washing<br />
machines and vacuum cleaners. It is also a global leader in the production of similar<br />
equipment for professional users. Electrolux has a turnover in excess of SEK100bn<br />
annually, operates in more than 150 countries and has about 50,900 employees. In<br />
June 2006, the company spun off its most profitable division – the outdoor unit – into<br />
an independently-listed company, Husqvarna. The outdoor division accounted for<br />
22% of Group sales. The largest shareholder in Electrolux is Investor AB with 13.6%<br />
of the share capital and 29.9% of the voting rights.<br />
Key credit considerations<br />
Leading position<br />
Global diversity with critical mass and market-leading positions in Europe (16%<br />
market share within core appliances and 14% in floor-care products) and the US<br />
(21% core appliances and 18% in floor-care) helps smooth out the cyclical fluctuations<br />
associated with an industry where growth is generally linked to consumer<br />
spending and housing activity. Even if cyclicality is less of an issue than it has been<br />
historically, as white goods are now considered more ‘essential’ purchases than in the<br />
past, economic downturns delay replacements and prompt a shift towards lower-cost<br />
products. Price competition is generally intense, partly due to overcapacity. In addition,<br />
none of the players in the global white goods market enjoy sufficiently large<br />
market share to act as price leaders and the technology is not sufficiently sophisticated<br />
to keep out new competition.<br />
Focus on branding and retailer distribution<br />
Brand strength is a key credit factor in a relatively homogenous industry. Electrolux<br />
is actively developing this by focusing on a reduced number of global brands, which<br />
should support a more targeted and cost-effective advertising and promotion strategy,<br />
as well as a more loyal customer base and a better pricing environment. Its strategy is<br />
to build Electrolux as a global brand, by single or double branding the products,<br />
although this will entail increasing marketing costs.<br />
Retailer dependency is an inevitable threat to performance. However, Electrolux is<br />
the leading manufacturer for most of the main European retailers. It is highly dependent<br />
on Sears in the US, the biggest seller of white goods, but less dependent than<br />
its competitor, Whirlpool. It also produces private label goods for European retailers.<br />
Electrolux’s brand strength helps offset the power of the retailers. On the positive<br />
side, a close link with a strong retailer acts as an entry barrier.<br />
Sensitivity to raw material prices<br />
As the company has streamlined its operations and outsourced assembly to low labour<br />
cost countries, the proportion of variable costs, such as materials and components,<br />
has risen substantially. Raw materials and components represented 43% of<br />
total costs in 2010. In recent years, spot price volatility has risen substantially for the<br />
most important raw material inputs such as carbon steel (representing 37% of the<br />
total cost for raw materials), stainless steel (8%), aluminium and copper (13%) and<br />
plastics (27%). Although the economic downturn put pressure on these commodity<br />
prices, this has now reversed and prices are rising again.<br />
SELL<br />
Sector: Consumer Discretionary<br />
Corporate ticker: ELTLX<br />
Equity ticker: ELUXB SS<br />
Market cap: SEK47.5bn<br />
Ratings:<br />
S&P rating: BBB /S<br />
Moodys rating: NR<br />
Fitch rating: BBB- /S<br />
Analyst:<br />
Asbjørn Purup Andersen<br />
apu@danskebank.com<br />
+45 45148886<br />
Kristian Myrup Pedersen<br />
kripe@danskebank.com<br />
+45 45128519<br />
Key credit issues<br />
Strengths:<br />
• Leading producer of indoor household<br />
appliances.<br />
• Most diverse geographic<br />
exposure in the industry.<br />
• Good distributions network and<br />
close relationships with retailers.<br />
• Strong brand names.<br />
Challenges:<br />
• Cyclical demand leads to fluctuating<br />
profitability.<br />
• Strong competition and price<br />
pressure from Asia.<br />
• Fragmented European market.<br />
• Volatile raw materials cost base.<br />
Source: <strong>Danske</strong> Markets<br />
80 | 13 April 2011<br />
www.danskeresearch.com
<strong>Scandi</strong> Handbook<br />
Liquidity<br />
We view Electrolux as having a sound liquidity position. At the end of 2010, the company<br />
had around SEK12.8bn in cash and cash equivalents available. Electrolux also has<br />
access to an unutilised, committed EUR0.5bn (SEK4.5bn) revolving credit facility that<br />
matures in 2012 and in 2010 Electrolux signed an additional committed 2017 credit<br />
facility of SEK3.4bn that is also unutilised. This compares with short-term debt of<br />
SEK3.7bn. According to Standard & Poor’s, there are no covenants or rating triggers<br />
on the company’s debt.<br />
In 2007, Electrolux made a decision to extend its debt maturities and significantly<br />
reduce dependence on short-term debt. The goal for long-term funding includes an<br />
average time to maturity of at least two years, an even spread of maturities, as well as<br />
an average interest-fixing of 1.0 years. At end 2010, the company’s long-term debt had<br />
an average maturity of 3.3 years and the average interest fixing was 0.9 years. Furthermore,<br />
it is stressed as part of financial policy that it is the Group’s ambition to maintain<br />
a safe margin from a non-investment grade credit rating. In November 2010, S&P<br />
upgraded its credit rating from ‘BBB’ to ‘BBB+’ and soon after Fitch upgraded its<br />
unsolicited credit rating from ‘BBB-’ to ‘BBB’.<br />
Current performance drivers<br />
Earnings improve while demand remains depressed<br />
Electrolux has maintained strong focus on profitability and cash flow. Through cost<br />
cutting, price increases and working capital reductions, the company managed to increase<br />
its EBIT margin to 6.1% at the end of 2010, thus surpassing its 6% target over<br />
the cycle.<br />
However, the core markets have yet to see a recovery in demand as Western Europe,<br />
Southern Europe and North American markets remain subdued. However, demand in<br />
Latin America and Asia/Pacific remains strong. This uneven growth is expected to<br />
continue in 2011 as Electrolux forecasts modest growth of 2% in Europe and 3% in<br />
North America.<br />
The North American market was also hit by subsidy discontinuations in Q3 10. This<br />
followed higher replacement demand in Q2 10 due to US state-sponsored rebate<br />
programmes for energy-efficient products.<br />
Low gearing, but substantial unfunded pension liabilities<br />
During 2009, reported net debt was reduced significantly and the net debt-to-equity<br />
ratio improved from 28% in 2008 to 4% in 2009. In Q2 10, Electrolux ended up with<br />
a net cash position.<br />
However, we stress that Electrolux has significant unfunded pension liabilities (although<br />
it did make a SEK3.9bn contribution to pension funds in Q4 09), operating<br />
leasing commitments and guarantees to some of its US customers. When adjusting<br />
for these figures, net debt-to-equity was 21% in 2010 (versus 36% in 2009 and 89%<br />
in 2008).<br />
Olympic acquisition put on hold because of the Egypt uprising<br />
As part of Electrolux’s strategy to grow in the emerging markets, the company announced<br />
its intention to acquire 52% of Olympic Group in Egypt for an enterprise<br />
value equivalent to SEK3.2bn (excluding associated companies Namaa and B-tech,<br />
to be divested). Afterwards, Electrolux were set to launch a mandatory tender offer<br />
for the remaining shares; however, due to the turmoil in Egypt, the acquisition was<br />
put on hold in February 2011. We still expect Electrolux to complete the acquisition<br />
in 2011 and do not foresee any rating impact due to the strong credit metrics.<br />
Debt maturity profile<br />
(as of 31 December 2010)<br />
SEKbn<br />
4.5<br />
4.0<br />
3.5<br />
3.0<br />
2.5<br />
2.0<br />
1.5<br />
1.0<br />
0.5<br />
0.0<br />
Source: Company data and <strong>Danske</strong> Markets<br />
Profitability<br />
SEKbn<br />
140<br />
120<br />
100<br />
80<br />
60<br />
40<br />
20<br />
0<br />
2011 2012 2013 2014 2015 2016+<br />
2006 2007 2008 2009 2010<br />
Source: Company data, <strong>Danske</strong> Markets<br />
Sales by segment, 2010<br />
Source: Company data, <strong>Danske</strong> Markets<br />
Credit metrics<br />
Source: Company data, <strong>Danske</strong> Markets<br />
14%<br />
12%<br />
10%<br />
8%<br />
6%<br />
4%<br />
2%<br />
0%<br />
Net sales EBITDA EBITDA margin (rhs)<br />
Consumer<br />
(Latin Am.)<br />
16%<br />
Consumer<br />
(North Am.)<br />
32%<br />
SEKbn<br />
35<br />
30<br />
25<br />
20<br />
15<br />
10<br />
5<br />
0<br />
Consumer<br />
(Asia)<br />
8%<br />
Professional<br />
Products<br />
6%<br />
2006 2007 2008 2009 2010<br />
Consumer<br />
(EMEA)<br />
38%<br />
3.5x<br />
3.0x<br />
2.5x<br />
2.0x<br />
1.5x<br />
1.0x<br />
0.5x<br />
0.0x<br />
Adj net debt Equity Adj net debt/EBITDA (rhs)<br />
81 | 13 April 2011<br />
www.danskeresearch.com
<strong>Scandi</strong> Handbook<br />
Restructuring programme to be completed in 2011<br />
The company is in the final phase of its ambitious restructuring programme, initiated<br />
in 2004 and expected to be completed in 2011. A central part of the programme<br />
involves plant closures and relocation of production to low-cost countries. When<br />
fully implemented, 60% of appliance manufacturing will take place in these countries.<br />
Production of vacuum cleaners is already located in such countries. Annual<br />
savings are estimated at SEK3.4bn, when finalised.<br />
Litigation risk<br />
Electrolux currently faces around 2,800 pending US lawsuits representing around 3,120<br />
plaintiffs. These lawsuits relate to externally-supplied components containing asbestos<br />
used in Electrolux’s industrial products prior to the early 1970s. Electrolux itself has<br />
not manufactured any of these components and the companies that provided the components<br />
are no longer operating. S&P does not expect this issue to be a major rating<br />
factor and we do not consider this to be a material issue.<br />
Recommendation<br />
We have an overall SELL recommendation on Electrolux. Although demand has stabilised,<br />
this could be negatively affected by government austerity measures in Europe<br />
going forward. The continued weak market conditions in Europe and North America<br />
and large restructuring charges will continue to weigh on the company’s credit quality,<br />
in our view.<br />
The 5y CDS, trading at 65/72bp, is very tight compared with iTraxx Europe<br />
(94/95bp). We recommend that investors buy 5y protection against iTraxx Europe<br />
(see list of instrument prices at the end of this book). Given the continued difficult<br />
conditions in the white goods industry, we expect Electrolux to underperform the<br />
market.<br />
Currently, Electrolux has no outstanding Eurobonds apart from a very illiquid 2013<br />
floater. Electrolux does, however, have bonds issued in US dollars (a USD100m<br />
floater issued in April 2008 and a USD42m floater issued in June 2008), which could<br />
be delivered into the CDS contract. The bonds issued in SEK under the company’s<br />
domestic MTN programme are not deliverable under ISDA documentation. We believe<br />
that the limited amount of deliverable obligations could explain the tight CDS<br />
levels on Electrolux and we could see pressure on the CDS upon new issuance. Electrolux<br />
has SEK250m of bond redemptions in 2011 that may be refinanced in the<br />
capital markets.<br />
82 | 13 April 2011<br />
www.danskeresearch.com
<strong>Scandi</strong> Handbook<br />
Financial data - Electrolux<br />
Key figures (SEKm) 2006 2007 2008 2009 2010<br />
Net Sales 103,848 104,732 104,792 109,132 106,326<br />
EBITDA 7,333 7,575 4,553 8,764 9,822<br />
EBIT excl non-rec items 4,575 4,837 1,543 5,322 6,494<br />
Net interest expenses 147 440 535 277 124<br />
Net profit 3,847 2,925 366 2,607 3,997<br />
FFO (1) 5,263 5,498 3,446 6,378 7,741<br />
Capex 3,667 3,950 3,158 2,223 3,221<br />
EBITDA-Capex 3,666 3,625 1,395 6,541 6,601<br />
RCF (2) 3,041 4,372 2,242 6,378 8,879<br />
FCF (3) -1,329 270 -916 1,224 5,597<br />
Net debt (4) -304 4,703 4,556 665 -709<br />
Adjusted net debt (5) 8,093 12,061 14,572 6,862 4,291<br />
Equity (incl. minorities) 13,194 16,040 16,385 18,841 20,613<br />
Total capital (6) 20,689 27,203 30,331 32,863 32,709<br />
Ratios 2006 2007 2008 2009 2010<br />
EBITDA margin (%) 7.1% 7.2% 4.3% 8.0% 9.2%<br />
EBIT margin (%) 4.4% 4.6% 1.5% 4.9% 6.1%<br />
Capex/Net revenues (%) 3.5% 3.8% 3.0% 2.0% 3.0%<br />
EBITDA/Net interest expenses (x) 49.9x 17.2x 8.5x 31.6x 79.2x<br />
FFO/Adj net debt (%) 65% 46% 24% 93% 180%<br />
Adj net debt/EBITDAR (x) 1.0x 1.4x 2.7x 0.8x 0.4x<br />
Adjusted net debt/Total capital (%) 39% 44% 48% 21% 13%<br />
(1) Funds from operations. (2) FFO less dividends. (3) RCF less capex and changes in working capital (4) Total interest-bearing debt less cash and marketable<br />
securities. (5) Net debt adjusted contingent liabilities/contractual obligations as reported. (6) Equity and unadjusted total debt. Source: Company data, <strong>Danske</strong> Fixed<br />
Income Credit Research<br />
Quarterly overview (SEKm)<br />
Q4 09 Q1 10 Q2 10 Q3 10 Q4 10<br />
Net sales 28,215 25,133 27,311 26,326 27,556<br />
Adjusted EBIT 2,023 1,326 1,477 1,977 1,714<br />
Adjusted EBIT margin 7.2% 5.3% 5.4% 7.5% 6.2%<br />
Net income 664 911 1,028 1,381 677<br />
Net debt (reported) 665 730 -496 -609 -709<br />
Net debt/LTM EBITDA 0.1x 0.1x -0.1x -0.1x -0.1x<br />
Source: Company data, <strong>Danske</strong> Fixed Income Credit Research<br />
Divisional quarterly overview (SEKm)<br />
Q4 09 Q1 10 Q2 10 Q3 10 Q4 10<br />
Cons. Durables Europe Net sales 11,285 9,719 9,349 10,210 10,760<br />
EBIT margin 7.3% 6.4% 5.4% 9.9% 5.3%<br />
Cons. Durables North America Net sales 7,865 7,995 10,027 8,353 7,401<br />
EBIT margin 5.7% 4.5% 4.6% 5.3% 4.3%<br />
Cons. Durables Latin America Net sales 4,401 3,998 3,905 4,069 5,304<br />
EBIT margin 8.4% 5.5% 6.1% 5.7% 7.4%<br />
Cons. Durables Asia/Pacific Net sales 2,741 1,912 2,298 2,192 2,434<br />
EBIT margin 9.3% 8.4% 10.1% 12.1% 11.2%<br />
Professional products Net sales 1,923 1,501 1,730 1,501 1,657<br />
EBIT margin 11.7% 6.1% 12.0% 13.5% 14.7%<br />
Source: Company data, <strong>Danske</strong> Fixed Income Credit Research<br />
83 | 13 April 2011<br />
www.danskeresearch.com
<strong>Scandi</strong> Handbook<br />
Investor AB<br />
Company overview<br />
Established in 1916, Investor AB is the largest industrial holding company in the<br />
Nordic region. Investor AB is represented with offices in Stockholm, Amsterdam,<br />
Beijing, Hong Kong, Tokyo, Menlo Park and New York. Investor’s business concept<br />
is to generate solid long-term returns by investing in companies with attractive potential<br />
for value creation. Investor is an active owner and is often represented at the<br />
board level of the companies in which it invests. The three largest Wallenberg foundations<br />
jointly own 22.3% of the shares and 48.0% of the voting rights, which we<br />
consider to be credit supportive. Investor’s business operations are conducted primarily<br />
through the following three main business areas:<br />
• Core Investments, representing the largest percentage of Investor’s total assets,<br />
are well-established, global companies that are listed. The investment cycle is<br />
long term and the ownership is through minority positions of significant sizes.<br />
This business area represents 72% of the total portfolio.<br />
• Operating Investments are medium-sized to large companies that are mainly<br />
unlisted and have international operations. The investment cycle is longer than<br />
five years and ownership is through minority positions of significant sizes. This<br />
business area represents 15% of the total portfolio.<br />
• Private Equity Investments are holdings in small- and medium-sized young<br />
growth companies that are mainly unlisted and operating in the healthcare, IT and<br />
technology sectors. Investor expects to grow its share of unlisted investments to<br />
25% on a five-year horizon from the current 11% of the total portfolio.<br />
The specific investments in the investment areas are described further below. In<br />
addition, Investor has some financial investments but these are of relatively minor<br />
importance (less than 2% of net asset value).<br />
Key credit considerations<br />
Underlying asset quality is central to performance<br />
As an investment holding company, Investor’s credit quality is largely determined by<br />
the asset quality of its portfolio. The total portfolio of listed and unlisted companies<br />
is best measured by the net asset value (market value of total assets less net debt).<br />
Listed assets are typically more liquid while unlisted assets tend to come with a larger<br />
degree of control with the ability to determine dividend payments and corporate<br />
strategies.<br />
Diversification of investments<br />
The investments are diversified across business areas and geography. While the<br />
majority of investments are Swedish-based companies, the operations of these are<br />
international, if not global. Moreover, the investments span many different sectors<br />
(e.g. financial services, technology, engineering and healthcare). The largest investment<br />
is in Atlas Copco (19.1% of total assets) and the second-largest is SEB (14.1%).<br />
BUY<br />
Sector: Industrials;<br />
Investment holding companies<br />
Corporate ticker: INVSA<br />
Equity ticker: INVEB SS<br />
Market cap: SEK117.8bn<br />
Ratings:<br />
S&P rating: AA- /S<br />
Moodys rating: A1 /S<br />
Fitch rating: NR<br />
Analysts:<br />
Asbjørn Purup Andersen<br />
apu@danskebank.com<br />
+45 45148886<br />
Kristian Myrup Pedersen<br />
kripe@danskebank.com<br />
+45 45128519<br />
Key credit issues<br />
Strengths:<br />
• Good asset quality and diversification<br />
in portfolio.<br />
• Strong ownership support from<br />
Wallenberg foundations.<br />
• Strong capital structure with<br />
modest leverage.<br />
• Adequate liquidity with<br />
long-dated debt maturity profile.<br />
Challenges:<br />
• Volatile portfolio value from<br />
share price fluctuations.<br />
• Exposure to higher-risk<br />
unlisted investments.<br />
• Debt servicing dependent on dividends<br />
and divestments.<br />
Source: <strong>Danske</strong> Markets<br />
Dividend income and asset divestments determine liquidity<br />
Investor is reliant on dividends from its investments and/or disposals in order to<br />
service its debt. Investor’s own distribution policy is closely linked to the dividends it<br />
receives from its (core) investments. This was emphasised during the financial crisis<br />
which put dividend payments under pressure in several companies as, for example,<br />
SEB suspended its dividend for 2008. Investor’s interest coverage (dividends received/financial<br />
expenses) was 3.5x in 2010, up from a modest 0.9x in 2008. However,<br />
the strong net cash position of SEK2.7bn at the end of 2010 safeguards against<br />
a cash shortfall resulting from reduced dividend payments.<br />
84 | 13 April 2011<br />
www.danskeresearch.com
<strong>Scandi</strong> Handbook<br />
Liquidity and leverage policy<br />
Investor has a policy of a maximum leverage (net debt/total assets) target of 25%, but<br />
over the business cycle Investor aims at a leverage ratio of 5-10%. The 25% leverage<br />
target may only be exceeded on a short-term basis and if the target is breached Investor<br />
starts to sell off assets. By the end of 2010, Investor had a net debt position of<br />
SEK11.5bn, corresponding to a leverage ratio of 6.3%. Furthermore, the company’s<br />
total readily available liquid funds of SEK12.0bn provide a short-term buffer. In<br />
addition, the company has a SEK10bn committed syndicated back-up loan facility,<br />
which is fully undrawn and matures in October 2012. The syndicated facility also has<br />
no restrictive financial covenants that could reduce the available credit.<br />
In the period when conditions in the credit market were still benign, Investor increased<br />
the maturity of its debt and at the end of 2010 the average maturity of the<br />
total debt portfolio was at more than 12.1 years.<br />
Except for 3 <strong>Scandi</strong>navia (where Investor has made a loan guarantee of SEK4.2bn,<br />
corresponding to 40% of total debt in the company), the debt at the companies is<br />
ring-fenced with no recourse to Investor AB.<br />
Current performance drivers<br />
Portfolio value<br />
Investor’s net asset value (market value of total assets less net debt) is the best way to<br />
measure the performance of the company. In 2008, the deteriorating equity market<br />
took its toll and resulted in a 26% fall in net asset value relative to 2007. In 2009, net<br />
asset value rose sharply by 24% and the upward trend continued in 2010 with an<br />
increase of 19% y/y. Thus, most of the lost ground has been regained.<br />
This is also evident from the share price of Investor AB which has performed in line<br />
with this development. The credit quality of Investor is therefore highly correlated<br />
with the development in the underlying assets.<br />
Asset allocation<br />
The largest share of Investor AB’s portfolio is Core Investments (72% of the total<br />
portfolio at the end of 2010), which is credit positive as these listed minority stakes are<br />
more liquid and provide greater diversification. While Operating Investments (15% of<br />
total portfolio) benefits from a greater degree of influence and control, the unlisted<br />
companies are less liquid and take longer to divest when needed. Furthermore, they<br />
may have higher financial risk from leverage. This is even more the case for Private<br />
Equity Investments (11% of total portfolio). The characteristics and credit considerations<br />
of each of the three business areas are described in detail on the next page.<br />
2010 results<br />
In 2010, Investor reported a net profit of SEK30.7bn, mainly reflecting the positive<br />
changes in enterprise valuations on the stock markets. Net asset value rose 19% y/y<br />
to SEK169.9bn. This was mainly attributable to Operating Investments (+77%) and<br />
Core Investments (+23%).<br />
Investor maintained its conservative balance sheet structure, although it continued to<br />
increase its net debt to SEK11.5bn (corresponding to a leverage of 6.3%). We expect<br />
this to slow down and remain within the leverage target of 5-10%.<br />
Reorganisation of portfolio in 2011<br />
In April, Investor announced that it would restructure its portfolio to focus more on<br />
Core Investments and hence wind down Active Portfolio Management and divest<br />
Investor Growth Capital as a standalone entity on 1 July 2011 (in order to facilitate<br />
this, Investor will contribute SEK750m in 2011 and SEK750m in 2012 after which<br />
no additional funding is provided). As a consequence, costs are expected to decrease<br />
by SEK140m per annum. In our view, the restructuring lowers risks.<br />
Leverage (net debt to assets)<br />
25%<br />
20%<br />
15%<br />
10%<br />
5%<br />
0%<br />
-5%<br />
-10%<br />
Source: Company data and <strong>Danske</strong> Markets<br />
Net asset value<br />
SEKbn<br />
200<br />
180<br />
160<br />
140<br />
120<br />
100<br />
80<br />
60<br />
40<br />
20<br />
-<br />
Q1<br />
03<br />
Q1<br />
04<br />
Q1<br />
05<br />
Q1<br />
06<br />
Q1<br />
07<br />
Source: Company data and <strong>Danske</strong> Markets<br />
Investor AB share price<br />
SEK<br />
200<br />
180<br />
160<br />
140<br />
120<br />
100<br />
80<br />
60<br />
40<br />
20<br />
0<br />
Q1<br />
03<br />
Q1<br />
04<br />
Q1<br />
05<br />
Q1<br />
06<br />
Q1<br />
07<br />
Q1<br />
08<br />
Q1<br />
08<br />
Q1<br />
09<br />
Q1<br />
09<br />
Source: Bloomberg and <strong>Danske</strong> Markets<br />
Allocation of assets (end-2010)<br />
Source: Company data and <strong>Danske</strong> Markets<br />
max<br />
target<br />
Q1<br />
10<br />
Q1<br />
10<br />
2003 2004 2005 2006 2007 2008 2009 2010 2011<br />
Financial<br />
Investments<br />
Private Equity 2%<br />
Investments<br />
11%<br />
Operating<br />
Investments<br />
15%<br />
Index (2003)<br />
350<br />
300<br />
250<br />
200<br />
150<br />
100<br />
50<br />
0<br />
Core<br />
Investments<br />
72%<br />
85 | 13 April 2011<br />
www.danskeresearch.com
<strong>Scandi</strong> Handbook<br />
Core Investments<br />
Core Investments constituted 72% of the total assets by end-2010 and is therefore by<br />
far Investor’s most important area. The investments are in liquid shares in larger<br />
companies and Investor pursues an active ownership strategy.<br />
The business area currently comprises eight companies: ABB (‘A3’, ‘A’, ‘BBB+’),<br />
AstraZeneca (‘A1’, ‘AA-’, ‘AA-’), Atlas Copco (‘A3’, ‘A’, NR), Electrolux (NR,<br />
‘BBB+’, ‘BBB’), Ericsson (‘Baa1’, ‘BBB+’, ‘BBB+’), Husqvarna (NR, NR, NR),<br />
Saab (NR, NR, NR) and SEB (‘A1’, ‘A’, ‘A+’). The overall credit quality of the core<br />
investments is high as reflected by the solid investment-grade credit ratings of the<br />
companies.<br />
Operating Investments<br />
Operating Investments constitute around 15% of total assets and currently the business<br />
area mainly consists of the following holdings: 3 <strong>Scandi</strong>navia, Gambro, Grand<br />
Hôtel, Mölnlycke Health Care, Biovitrum, Aleris and Lindorff. In addition, Investor<br />
has entered the land and real estate market although the investment remains modest.<br />
The focus continues to be on unlisted companies with an international presence and<br />
the investment horizon is long (five to 10 years or more). The investment risks are<br />
higher than for Core Investments as financial leverage in this segment can be substantially<br />
higher in order to enhance returns.<br />
Private Equity Investments<br />
Private Equity constituted 11% of total investments in 2010. Venture capital investments<br />
are made through the subsidiary Investor Growth Capital and buyout investments<br />
are made indirectly through EQTs funds, which are partly owned by Investor.<br />
The focus of the former is on young growth-oriented companies while the focus of<br />
EQTs is on larger companies.<br />
After several years when the investment climate for private equity has been good, the<br />
exit possibilities are now negatively affected by the ongoing crisis in the financial<br />
markets. Lately, however, financial conditions have eased markedly, paving the way<br />
for exits but IPO activity is still somewhat restrained. Private equity is the riskiest of<br />
the three investment areas, but since 1998 the return (IRR) for realised investments<br />
has been above the 20% target set by Investor. From a credit perspective, we note<br />
that the investments in Private Equity are largely illiquid.<br />
Recommendation<br />
On 20 January 2011, we changed our recommendation to BUY (from HOLD). We<br />
believe fundamentals are improving and expect that Investor AB is close to the end of<br />
its re-leveraging path, being within the target area. Furthermore, most companies have<br />
increased or reinstated their dividends; such cash inflow should support debt servicing.<br />
Investor also had a liquid cash position of SEK12.1bn at the end of 2010, which fully<br />
covers debt maturities up to 2020 and provides a short-term buffer.<br />
The current valuation looks attractive as the bonds are trading at a wide level relative<br />
to Investor’s senior unsecured ratings (‘AA-’/‘A1’). Our top pick is the INVSA 2016<br />
bond which currently trades at ASW +49bp (ask). However, the new INVSA 2018<br />
also looks attractive for investors with appetite for longer duration (ASW +65bp) as<br />
it trades almost unchanged from its inception in September 2010 (see list of prices at<br />
the end of this book).<br />
Core Investments (end-2010)<br />
Saab<br />
3%<br />
Electrolux<br />
6%<br />
AstraZeneca<br />
12%<br />
ABB<br />
19%<br />
Source: <strong>Danske</strong> Markets<br />
Operating Investments (end-2010)<br />
Biovitrium<br />
12%<br />
Land and real<br />
Other<br />
estate<br />
1% Aleris 2%<br />
The Grand<br />
Group<br />
4%<br />
3 <strong>Scandi</strong>navia<br />
5%<br />
Lindorff<br />
13%<br />
Source: <strong>Danske</strong> Markets<br />
Private Equity Investments (end-2010)<br />
EQT<br />
56%<br />
Source: <strong>Danske</strong> Markets<br />
Husqvarna<br />
4%<br />
SEB<br />
20%<br />
Ericsson<br />
9%<br />
Atlas Copco<br />
27%<br />
Gambro<br />
Holding<br />
6%<br />
Mölnlycke<br />
Health Care<br />
48%<br />
Investor<br />
Growth<br />
Capital<br />
44%<br />
86 | 13 April 2011<br />
www.danskeresearch.com
<strong>Scandi</strong> Handbook<br />
Financial data Investor AB<br />
P&L (SEKm) 2006 2007 2008 2009 2010<br />
Operating profit 28,966 273 -36,521 32,297 31,920<br />
Financial income 1,685 729 4,727 0 0<br />
Financial expenses -1,836 -1,213 -5,015 -597 -1,186<br />
Net financial items -151 -484 -288 -597 -1,186<br />
Pre tax profit 28,815 -211 -36,809 31,700 30,734<br />
Tax -329 -156 73 -332 -41<br />
Net profit 28,486 -367 -36,736 31,368 30,693<br />
Balance Sheet (SEKm) 2006 2007 2008 2009 2010<br />
Fixed assets 2,489 2,464 2,376 2,184 3,553<br />
Shares & particip. in investing activities 152,219 146,354 96,581 130,792 156,745<br />
Investments in associates 3,713 5,963 0 9,062 665<br />
Long-term receivables 966 4,823 11,318 10,846 5,531<br />
Deferred tax assets 14 13 20 11 467<br />
Total non-current assets 159,401 159,617 110,295 152,895 200,851<br />
Short term investments 13,045 9,998 18,821 6,130 9,295<br />
Cash & cash equivalents 5,608 5,010 9,151 5,804 2,684<br />
Other current assets 2,886 2,606 2,392 5,395 8,498<br />
Current assets 21,539 17,614 30,364 17,329 20,477<br />
Total assets 180,940 177,231 140,659 170,224 221,328<br />
Long-term interest bearing debt 17,633 18,837 21,591 23,550 40,536<br />
Pension liabilities 199 192 197 297 602<br />
Provisions 129 89 83 56 78<br />
Deferred tax 619 665 522 573 3,730<br />
Non-current liabilities 18,580 19,783 22,393 24,476 44,946<br />
Short-term interest bearing debt 666 271 818 299 948<br />
Accrued expenses and pre-paid income 1,265 1,298 1,337 1,122 2,023<br />
Provisions 33 22 10 5 14<br />
Other 1,076 653 761 1,649 2,785<br />
Current liabilities 3,040 2,244 2,926 3,075 5,770<br />
Total equity 159,320 155,204 115,340 142,673 142,673<br />
Key ratios 2006 2007 2008 2009 2010<br />
Net debt 416 -3,583 9,415 -588 -11,472<br />
Net asset value 159,320 155,204 115,340 142,673 169,947<br />
Interest cover (x) 1.8 3.2 0.9 5.8 3.5<br />
Leverage (%) -0.2% 2.0% -6.7% 0.3% 5.2%<br />
Source: Company data <strong>Danske</strong> Fixed Income Credit Research<br />
Quarterly overview (SEKm)<br />
Q4 09 Q1 10 Q2 10 Q3 10 Q4 10<br />
Core Investments 106,231 112,264 112,647 117,172 130,828<br />
Operating Investment 15,931 18,202 18,508 21,452 28,194<br />
Private Equity Investments 18,333 17,711 18,730 17,429 19,297<br />
Financial Investments 3,283 4,043 4,103 4,528 3,706<br />
Other assets and liabilities -1,105 -551 -578 -694 -606<br />
Net debt -588 -1,353 -5,486 -7,484 -11,472<br />
Net asset value 142,085 150,316 147,924 152,403 169,947<br />
Source: Company data and <strong>Danske</strong> Fixed Income Credit Research<br />
87 | 13 April 2011<br />
www.danskeresearch.com
<strong>Scandi</strong> Handbook<br />
ISS<br />
Company overview<br />
Denmark-based ISS is one of the world’s leading providers of facility services, with<br />
522,000 employees in more than 50 countries. In March 2005, EQT and Goldman<br />
Sachs Capital Partners made a public tender offer to the shareholders of ISS A/S<br />
through an entity now named ISS (previously ISS Holding). In May 2005, the LBO<br />
was completed and as a result the Group has weak credit metrics. Under its new<br />
ownership structure, ISS has made numerous acquisitions in order to broaden its<br />
scope of service offerings and geographical presence. In 2010, 52% of DKK74bn in<br />
revenues came from cleaning, 20% from property services, 10% from catering, 8%<br />
from support services, and 7% from security. The broadening of services offerings is<br />
highlighted by the current sales split, as the non-cleaning services has increased to<br />
48% of sales in 2010, compared to 33% in 2004. Although operations continue to be<br />
biased towards Western Europe and the Nordic region, ISS generated 18% of 2010<br />
sales from emerging markets, compared with 6% in 2004. Since the LBO, ISS has<br />
been on a slow deleveraging route on a multiple basis, primarily due to its acquisition<br />
strategy.<br />
Key credit considerations<br />
Strong business risk profile<br />
ISS is one of the world’s leading providers of facility services and operates in a competitive<br />
and fragmented market with low barriers to entry. However, as ISS is successfully<br />
focusing on Integrated Facility Services (IFS) and offers bundled services<br />
on a global scale, the entry barriers are raised in this part of the business. The operating<br />
margin and cash-generation ability have recently proven relatively resilient to the<br />
macroeconomic cycle. This is underpinned by ISS’s highly flexible low-cost base,<br />
well-diversified service portfolio and customer base (more than 200,000 public and<br />
private sector customers in 2010), high customer retention rate, good geographical<br />
diversification and the critical mass to benefit from economies of scale.<br />
but weak credit metrics<br />
The strong business risk profile should be viewed in combination with weak credit<br />
metrics following the LBO. ISS grew rapidly after the LBO, spending free cash flow<br />
on acquisitions rather than debt reduction, but since late 2008, the acquisition activity<br />
has materially slowed due to a strategy change. However, ISS has a strong track<br />
record in integrating acquired businesses and acquisitions have normally been immediately<br />
cash-flow enhancing. Although we assess ISS’s external growth ambitions to<br />
be solid in the long term, the company now identifies organic growth and debt reduction<br />
as key priorities. ISS Global (the issuer of pre-LBO EMTNs) is indirectly wholly<br />
owned by ISS (former ISS Holding, and the issuer of 2016 HY notes) and the latter<br />
does not run any operational activities. Following the LBO, S&P downgraded ISS<br />
from BBB+ to B+. Moody’s assigned the high-yield bond a Caa1 rating. In May<br />
2008, S&P raised its long-term corporate credit rating on ISS and ISS Global from<br />
B+ to BB-. Issue ratings from S&P remain two notches below the corporate credit<br />
rating. In July 2009, EUR525m senior unsecured notes due 2014 and rated B by S&P<br />
were issued through a new entity called ISS Financing plc.<br />
Potential IPO is key<br />
In March 2011, ISS was almost made public through an IPO, which was postponed at<br />
the last minute due to financial turmoil (the VIX index jumped by 50% to 30 from<br />
20) on the back of the conflicts in North Africa and the Japanese earthquake. As the<br />
IPO is a vital step in the deleveraging process, this was credit negative and news of a<br />
second IPO attempt will be the key credit driver in 2011 (read more on the IPO below).<br />
SELL<br />
Sector: Industrials, Commercial<br />
Services<br />
Corporate ticker: ISSDC<br />
Equity ticker: NA<br />
Market cap: NA<br />
Ratings:<br />
S&P rating: BB- S<br />
Moodys rating: B2 PW<br />
Fitch rating: NR<br />
Analyst:<br />
Kristian Myrup Pedersen<br />
kripe@danskebank.dk<br />
+45 45128519<br />
Asbjørn Purup Andersen<br />
apu@danskebank.dk<br />
+45 45148886<br />
Key credit issues<br />
Strengths:<br />
• Strong geographical and product<br />
diversification through integrated<br />
facility services<br />
• Highly diverse and recurring customer<br />
base<br />
• Industry resilient to business cycle<br />
fluctuations<br />
• Flexible low-cost base and capex<br />
directly related to sales<br />
Challenges:<br />
• Highly leveraged financial profile<br />
• Competitive and fragmented industry<br />
• Few barriers to entry and pricing<br />
pressure<br />
• Deleveraging path under pressure<br />
during financial crisis<br />
Source: <strong>Danske</strong> Markets<br />
88 | 13 April 2011<br />
www.danskeresearch.com
<strong>Scandi</strong> Handbook<br />
Liquidity<br />
As of end-2010, cash and cash equivalents amounted to DKK3.6bn, while adjusted<br />
FOCF was DKK898m. ISS had short-term debt of DKK5.3bn, plus estimated interest<br />
payments of DKK1.7bn. Importantly, due to the terms in the securitisation programme,<br />
DKK2.5bn of related debt was classified as short-term, although the facility<br />
is committed until September 2012. ISS Global has senior credit facilities with a<br />
principal amount of DKK19.6bn, of which DKK18.1bn was utilised at the end of<br />
2010. The senior credit facilities include customary covenants, all of which ISS complied<br />
with in 2010. These facilities mature in 2012 and 2013 and it was the intention<br />
to repay these facilities, as well as a second-lien facility of DKK4.5bn maturing in<br />
2015, with the proceeds from the IPO plus an additional DKK7.8bn from new IPOcontingent<br />
5Y credit facilities of DKK12.3bn. A refinancing of existing senior facilities<br />
without an upcoming IPO, i.e. as a highly leveraged entity, will significantly<br />
increase the interest rate burden and likely result in more supply from ISS in the<br />
high-yield bond market.<br />
On 25 March 2010, ISS made a EUR127.5m tap of its existing 2016 notes, with the<br />
proceeds passed on to ISS Global. We view ISS’s liquidity profile as adequate for the<br />
time being, but we (and so does S&P) expect the company to initiate refinancing of<br />
its large facilities well ahead of due dates in 2012 and particularly 2013.<br />
Current performance drivers<br />
2010 was a strong year for ISS and it ended solidly as expected<br />
In the full year 2010, revenue increased 7.3% to DKK74.1bn. Organic growth for the<br />
year was 3.5% compared with 0.6% in 2009 while net divestments decreased revenue<br />
by 1.5%. France continued to suffer from exposure to the manufacturing and public<br />
sectors and the effect from turnaround initiatives have yet to substantially materialise.<br />
2010 clean operating profit (i.e. operating profit before other items) increased<br />
10% to DKK4.3bn and the clean operating margin improved to 5.8% from 5.6% in<br />
2009.<br />
As expected, ISS delivered robust Q4 10 numbers with organic revenue growth marginally<br />
up sequentially to 4.0%. As in earlier quarters, Asia and Latin America delivered<br />
double-digit organic growth rates, while growth was weaker – albeit improving -<br />
in mature markets. The clean operating margin improved to 6.21% from 5.97% in the<br />
same period last year. During Q4 10, cash flow was strong, supported by a<br />
DKK1.1bn seasonal inflow of working capital. As a result, net debt declined to<br />
DKK30.6bn from DKK31.8bn after the previous quarter and DKK30.7bn at the end<br />
of the previous year. Net debt to EBITDA declined to 6.0x end-2010 from 6.5x end-<br />
2009.<br />
Broadly stated, going forward ISS pursues a further increase in service integration,<br />
more international contracts and increased emerging markets exposure. It targets<br />
medium-term organic growth of at least 6% (3.5%, 0.6% and 5.9% in 2010, 2009 and<br />
2008, respectively). ISS also targets a medium-term clean operating margin of 6.5%<br />
(5.8%, 5.6% and 5.9% in 2010, 2009 and 2008, respectively). The company will<br />
continue the disciplined approach to acquisitions, with activities primarily taking<br />
place in emerging markets. For 2011, ISS expects organic growth of 5%, and it expects<br />
the clean operating margin to be slightly above the level realised in 2010.<br />
IPO postponed uncertainty remains regarding second IPO attempt<br />
On 17 February 2011, ISS announced its intention to launch an IPO and the book<br />
building process started up on 8 March. However, on 17 March, ISS announced that<br />
– due to the high uncertainty and volatility in the financial markets – it had postponed<br />
the IPO. According to ISS, “the IPO was oversubscribed within our price range and<br />
comprised a book of demand from over 150 institutions around the world and more<br />
than 10,000 retail subscribers in Denmark.” However, due to a very high increase in<br />
risk aversion during the book building process, we believe the order book ended up<br />
weak in the sense that it was only oversubscribed at the bottom of the price range.<br />
89 | 13 April 2011<br />
Debt maturity profile (end 2010)<br />
DKKm<br />
16000<br />
14000<br />
12000<br />
10000<br />
8000<br />
6000<br />
4000<br />
2000<br />
0<br />
Source: Company data and <strong>Danske</strong> Markets<br />
Profitability<br />
DKKbn<br />
80<br />
70<br />
60<br />
50<br />
40<br />
30<br />
20<br />
10<br />
0<br />
Source: Company data, <strong>Danske</strong> Markets<br />
Revenue by region 2010<br />
Source: Company data, <strong>Danske</strong> Markets<br />
Credit metrics<br />
DKKbn<br />
35<br />
30<br />
25<br />
20<br />
15<br />
10<br />
5<br />
0<br />
2011 2012 2013 2014 20152016+<br />
2006 2007 2008 2009 2010<br />
Source: Company data, <strong>Danske</strong> Markets<br />
www.danskeresearch.com<br />
8%<br />
7%<br />
6%<br />
5%<br />
4%<br />
3%<br />
2%<br />
1%<br />
0%<br />
Net sales EBITDA EBITDA margin (rhs<br />
USA<br />
4%<br />
Latin<br />
America<br />
4%<br />
Asia<br />
7%<br />
Eastern<br />
Europe<br />
2%<br />
Pacific<br />
7%<br />
Nordic<br />
23%<br />
2006 2007 2008 2009 2010<br />
Western<br />
Europe<br />
53%<br />
8,0x<br />
7,5x<br />
7,0x<br />
6,5x<br />
6,0x<br />
5,5x<br />
5,0x<br />
4,5x<br />
Net debt Equity Adj net debt/EBITDA
<strong>Scandi</strong> Handbook<br />
Therefore, uncertainties exist regarding the IPO prospects, including the timeline. In<br />
our view, this event was credit negative, as the IPO was an important step in the<br />
deleveraging process. On 7 April 2011, ISS released some preliminary results for Q1<br />
in a trading update, well ahead of the final interim report expected to be published on<br />
12 May. The numbers were strong, as both revenue and operating profit were up, but<br />
the financial outlook for 2011 remains unchanged. In our view, the information signal<br />
from the update is more important than the exact numbers. The update signals<br />
that ISS could be working on a second IPO attempt, as the update should help to keep<br />
investors focused on ISS. With the equity market (as of the release day) in a substantially<br />
better mood than during the period when the first IPO attempt was postponed,<br />
this could be interpreted as if a second attempt is coming closer (ISS could have<br />
chosen not to disclose the numbers now and instead waited until the Q1 report on 12<br />
May). Still, we also caution against over interpreting the update, and we believe that<br />
the timeline remains uncertain, and that that the postponement could still be for a<br />
longer period.<br />
What could be expected should ISS successfully launch an IPO?<br />
The key credit driver for ISS in 2011 is likely to be news on a potential second IPO<br />
attempt. If ISS pursues a second IPO attempt, we expect the structure to mirror the<br />
first one. Hence, we expect the company to target net debt to adjusted EBITDA of<br />
3.5x immediately after the IPO, compared with 6.0x as of end-10, as well as targeting<br />
a stable investment grade rating down the road.<br />
The first IPO attempt consisted of a sale of new shares to raise gross proceeds of<br />
approximately DKK13.3bn. Proceeds were proposed, together with DKK7.8bn<br />
drawn under a new five-year senior secured facility (conditional on an IPO taking<br />
place), to repay all amounts under the current senior secured facilities (DKK18.1bn<br />
end-2010) and the second-lien (DKK4.5bn end-2010). Hence, the EUR581.5m<br />
8.875% 2016 Senior Sub. Notes issued by ISS (previously ISS Holding), the<br />
EUR525m 11% 2014 Senior Notes issued by ISS Financing and the residual<br />
EUR110.4m 4.5% 2014 EMTNs issued by ISS Global were not expected to be immediately<br />
redeemed after the IPO.<br />
ISS’s intention was to adopt a dividend policy with an initial target payout ratio of<br />
35% of profit after tax. However, ISS also stated that the target could be raised once<br />
ISS had reached a stable investment grade rating. In our view, this could take place<br />
after achievement of net debt to EBITDA of 3x, i.e. after further deleveraging. We<br />
would expect ISS to call and refinance the 2014 notes issued by ISS Financing and<br />
the 2016 notes when reaching investment grade status. The new DKK12.3bn IPOcontingent<br />
credit facility is secured (necessary due to the documentation in the 2016<br />
notes), raising concerns of notching and high yield status of future bond issues. However,<br />
the security package backing the new facility is released upon refinancing of<br />
the 2016 notes, opening up for future bonds being pari passu with most debt in the<br />
capital structure (excluding the securitisation programme). Hence, in our view, future<br />
bond issues after an IPO are likely to have investment-grade status.<br />
Recommendation<br />
Due to the combination of a strong performance on the back of, among other things,<br />
IPO/deleveraging expectations and the uncertainty regarding a second IPO attempt,<br />
we keep a SELL recommendation on both the ISS 2016 (around ASW to final maturity<br />
+466/454bp) and the ISS Financing 2014 (around ASW to final maturity<br />
+480/445bp). The reason behind this view is not, that the IPO is unlikely, but that the<br />
potential credit benefits from an IPO are, to a large extent, already priced into the<br />
bonds, and that we view the downside risk as being higher than the upside potential.<br />
Hence, we find the bonds unattractive from a risk/reward perspective. The 5y CDSs<br />
on both ISS and on ISS Global have also tightened materially, and we recommend<br />
buying protection on ISS Global (trading around 145/175bp). However, we take a<br />
neutral stance on the ISS CDS (trading around 160/175) due to orphanage risk.<br />
90 | 13 April 2011<br />
www.danskeresearch.com
<strong>Scandi</strong> Handbook<br />
Financial data ISS<br />
Key figures (DKKm) 2006 2007 2008 2009 2010<br />
Net Sales 55,772 63,922 68,829 69,004 74,073<br />
EBITDA 3,979 4,680 4,930 4,742 5,117<br />
EBIT 3,234 3,835 4,061 3,874 4,267<br />
Net interest expenses 2,152 2,234 2,312 1,999 2,127<br />
Net profit -809 -442 -631 -1,629 -532<br />
FFO (1) 2,348 3,041 3,657 3,554 3,792<br />
Capex 843 715 718 897 886<br />
EBITDA-Capex 3,136 3,965 4,212 3,845 4,231<br />
OpFCF (2) 3,020 3,718 4,225 3,658 4,059<br />
FCF (3) -894 -90 1,595 1,059 1,084<br />
RCF (4) -51 625 2,313 1,956 1,970<br />
Net debt (5) 26,365 29,340 29,528 30,739 30,638<br />
Adjusted net debt (6) 30,478 33,541 33,905 35,176 35,438<br />
Equity (incl minorities) 5,980 5,518 3,533 2,213 2,651<br />
Total capital (7) 34,620 37,439 36,022 36,316 36,895<br />
Ratios<br />
EBIT margin (%) 5.8% 6.0% 5.9% 5.6% 5.8%<br />
Capex/Net revenues (%) 1.5% 1.1% 1.0% 1.3% 1.2%<br />
EBITDA/Net interest expenses (x) 1.7x 1.9x 2.0x 2.2x 2.2x<br />
Adj net debt/EBITDA (x) 7.7x 7.2x 6.9x 7.4x 6.9x<br />
Adj FFO/Adj net debt (%) 7.4% 8.7% 10.4% 9.7% 10.3%<br />
Net debt/Total capital (%) 76% 78% 82% 85% 83%<br />
(1) Funds from operations. (2) Cash flow from operating activities before net interest paid and taxes paid but less capex. (3) OpFCF less net interest paid, taxes paid,<br />
and dividends (4) Cash flow from operating activities after net interest paid, taxes paid, change in working capital, and less dividends (5) Total interest-bearing debt<br />
less cash and cash equivalents (6) Net debt adjusted for contingent liabilities (7) Equity plus unadjusted total debt. Source: Company data, <strong>Danske</strong> Fixed Income<br />
Credit Research.<br />
Quarterly review (DKKm)<br />
Q4 09 Q1 10 Q2 10 Q3 10 Q4 10<br />
Net sales 17,870 17,574 18,619 18,584 19,296<br />
Clean EBIT margin 6.0% 4.6% 5.8% 6.4% 6.2%<br />
Clean EBITDA margin 7.2% 5.7% 6.9% 7.6% 7.4%<br />
Net income -667 -197 -112 -29 -194<br />
Net debt 30,739 31,485 32,019 31,842 30,638<br />
Adj net debt/LTM EBITDA 7.4x 7.5x 7.5x 7.3x 6.9x<br />
LTM Adj FFO/Adj net debt 9.72% 9.61% 9.16% 10.3% 10.0%<br />
LTM Adj FOCF/Adj net debt 2.36% 3.47% 2.18% 2.68% 2.46%<br />
Equity/Total assets 4.07% 4.20% 4.84% 4.46% 4.78%<br />
Source: Company data, <strong>Danske</strong> Markets<br />
91 | 13 April 2011<br />
www.danskeresearch.com
<strong>Scandi</strong> Handbook<br />
Metso<br />
Company overview<br />
Finland-based Metso Corporation holds market-leading positions in the manufacturing<br />
of pulp and paper machinery, rock and mineral processing equipment, and energy<br />
and environmental technology. Metso operates in sectors characterised by cyclical<br />
demand, price competition and limited end-user industry diversification. These factors<br />
are mitigated by substantial aftermarket services and a well-diversified geographical<br />
representation. Metso is a global player with operations in more than 50<br />
countries, serving customers in more than 100 countries. The company employs<br />
around 28,500 people and had revenues of EUR5.6bn in 2010. Its largest shareholder<br />
is Solidium Oy (wholly owned by the Finnish state) with 10.4% of the shares and<br />
votes.<br />
Key credit considerations<br />
Leading market positions<br />
Metso enjoys market-leading positions in equipment for metals & mining as well as<br />
pulp & paper machinery. Mining and Construction Equipment (accounting for 40%<br />
of sales in 2010) holds world-leading positions in crushing, screening and minerals<br />
processing equipment. Paper and Fibre (33% of sales) holds market-leading positions<br />
in paper, board and pulp lines. Energy and Environmental Technology (26% of sales)<br />
has strong positions in metal recycling systems, waste management and automation.<br />
In general, Metso’s strong brand name, technical capabilities, access to distribution<br />
channels and presence of an extensive installed base create substantial barriers to<br />
entry. However, the company is exposed to price competition in its core business,<br />
limited end-user industry diversification and bleak medium-term demand prospects<br />
in mature Western European and North American paper markets.<br />
Cyclicality mitigated by aftermarket sales and geographical spread<br />
Operations in Metso’s core business areas exhibit significant cyclicality. However, a<br />
diversification gain is derived from demand being only partially correlated across the<br />
paper and mining industries, etc. To mitigate the high cyclical dependence on newbuilds,<br />
Metso has expanded its aftermarket services (spare parts and maintenance<br />
services), which accounted for 45% of group sales in 2010. Besides reducing overall<br />
volatility, this also lowers the capital intensiveness of the company and yields higher<br />
margins. The order intake, and with that the group sales, is geographically well diversified<br />
across Europe (36% in 2010), North America (15%), South & Central<br />
America (17%), Asia-Pacific (27%) and Africa & Middle East (5%).<br />
Study to evaluate structural options discontinued<br />
In late 2008, Metso discontinued a study to evaluate structural options due to the<br />
uncertain economic outlook. This is clearly positive for credit investors, as a potential<br />
break-up of the company would create significant risks regarding where bonds<br />
are placed, where the CDS would reference and how the entities would be capitalised.<br />
Furthermore, diversification benefits are now maintained, as cash flows from<br />
different business areas are only partially correlated and kept under one roof. However,<br />
in our view, a study to evaluate transforming structural options could resurface<br />
in the future.<br />
HOLD<br />
Sector: Industrials, Machinery<br />
Corporate ticker: METSO<br />
Equity ticker: MEO1V FH<br />
Market cap: EUR6bn<br />
Ratings:<br />
S&P rating: BBB / S<br />
Moodys rating: Baa2 / S<br />
Fitch rating: NR<br />
Analyst:<br />
Kristian Myrup Pedersen<br />
kripe@danskebank.dk<br />
+45 45128519<br />
Asbjørn Purup Andersen<br />
apu@danskebank.dk<br />
+45 45148886<br />
Key credit issues<br />
Strengths:<br />
• World-leading market positions<br />
and barriers to entry<br />
• Attractive geographical diversification<br />
• Strong cash flow generation and<br />
debt reductions through crisis<br />
• High-margin and relatively stable<br />
aftermarket services<br />
Challenges:<br />
• Cyclical demand<br />
• High operating leverage and capital<br />
intensiveness<br />
• Limited end-user diversification<br />
• Structural overcapacity in paper<br />
segment<br />
Source: <strong>Danske</strong> Markets<br />
Significant deleveraging in 2009 and 2010<br />
Following increased debt levels in 2007 and 2008, Metso significantly deleveraged in<br />
2009 helped by strong free cash flow generation and a massive release of working<br />
capital. This trend continued in 2010, as net debt decreased by almost 50% to<br />
EUR310m end-2010 from EUR583m end-2009. S&P and Moody’s placed the outlook<br />
on the BBB/ Baa2 ratings on Stable (up from negative) in August and September<br />
2010.<br />
92 | 13 April 2011<br />
www.danskeresearch.com
<strong>Scandi</strong> Handbook<br />
Liquidity<br />
In late 2010, Metso refinanced its old 5Y EUR500m facility, set to mature in late<br />
2011, with a new 5Y EUR500m committed credit facility. The facility was undrawn<br />
at the end of 2010. According to S&P, the new facility contains a capital structure<br />
covenant (undisclosed), but it only applies at lower rating levels, and it currently<br />
leaves ample headroom. Cash and cash equivalents amounted to EUR645m end-<br />
2010, and Metso generated EUR372m in FOCF in 2010. The liquidity position comfortably<br />
covers short-term debt of EUR417m, and we view it as solid.<br />
Current performance drivers<br />
2010 was a strong full year and it also ended solid in Q4<br />
FY 2010 was characterised by higher sales in Mining & Construction (up 8% compared<br />
to FY 2009) and Paper & Fibre (up 32%), but lower sales in Energy & Environmental<br />
(down 6%, due to low order intake in 2009). However, about 7% of the<br />
overall increase in net sales of 11% arises from exchange rate effects. The EBITmargin<br />
increased significantly to 8.0% in 2010 from 5.9% in 2009, and the net income<br />
ended up 71% higher at EUR258m, compared to EUR151m in 2009. The FY<br />
2010 order intake was up by 36%, as most of Metso’s markets improved significantly.<br />
Metso reported Q4 10 net sales up 25% y/y to EUR1.7bn, which was in line with<br />
consensus expectations, while an improved net result of EUR76m came in slightly<br />
below expectations. The clean operating margin was sequentially unchanged at 7.8%,<br />
but improved on the 4.1% in the same period last year. Order growth sequentially<br />
slowed to 10% y/y and orders received amounted to EUR1.5bn. Emerging markets<br />
accounted for 52% of new orders compared with 46% in the same period last year,<br />
illustrating Metso’s attractive global footprint. End-2010, the order book stands at<br />
EUR4.0bn, which is 18% higher than end-2009. New orders surged 42% y/y in Mining<br />
and Construction (40% of 2010 sales), where Metso towards the end of the year<br />
saw an increase in quotations for bigger new capacity investments. We interpret this<br />
as a sign of increased risk appetite among Metso’s major customers. New orders<br />
decreased 11% y/y in Energy and Environmental Technology (26% of 2010 sales) on<br />
tough comparisons while order intake in Paper and Fibre (33%) decreased 4% y/y.<br />
Cash flow remained solid in Q4 and continued to benefit from strong working capital<br />
management. LTM FFO to adj. net debt improved to 53% (40% after Q3 10, 22%<br />
end-09), while LTM FOCF to adj. net debt was 42% (53% after Q3 10, 57% end-09).<br />
Adj. net debt to LTM EBITDA improved to 1.4x (1.6x after Q3 10, 2.6x end-09).<br />
Credit metrics have improved to a level commensurate with the rating<br />
Cash flow was once again solid in 2010, and FFO nearly doubled to EUR481m in<br />
2010 from EUR252m in 2009. However, adjusting for capex and changes in NWC,<br />
the FOCF actually dropped to EUR372m from an impressive EUR654m in 2009. The<br />
reason for the strong FOCF in 2009 was a release of NWC of EUR518m, compared<br />
to EUR25m in 2010. In our view, however, Metso actually showed strong NWC<br />
management in 2010, as it managed to release NWC in times of increasing sales. Due<br />
to the strong FOCF in 2009, Metso significantly deleveraged in 2009, and in 2010,<br />
this trend continued, as net debt decreased by almost 50% to EUR310m from<br />
EUR583m.<br />
Debt maturity profile (end-2010)<br />
EURm<br />
Source: Company data, <strong>Danske</strong> Markets<br />
Profitability<br />
EURm<br />
Source: Company data, <strong>Danske</strong> Markets<br />
Sales by segments 2010<br />
Source: Company data, <strong>Danske</strong> Markets<br />
Credit metrics<br />
EURm<br />
450<br />
400<br />
350<br />
300<br />
250<br />
200<br />
150<br />
100<br />
50<br />
0<br />
7.000<br />
6.000<br />
5.000<br />
4.000<br />
3.000<br />
2.000<br />
1.000<br />
0<br />
2.500<br />
2.000<br />
1.500<br />
1.000<br />
500<br />
2011 2012 2013 2014 2015 2016+<br />
2006 2007 2008 2009 2010<br />
Net sales EBITDA EBITDA margin<br />
Energy and<br />
Environmen<br />
tal<br />
26%<br />
0<br />
Paper and<br />
Fibre<br />
33%<br />
Others<br />
1%<br />
Mining and<br />
Constuction<br />
40%<br />
2006 2007 2008 2009 2010<br />
Net debt Equity Net debt/EBITDA<br />
Source: Company data, <strong>Danske</strong> Markets<br />
12%<br />
11%<br />
10%<br />
9%<br />
8%<br />
7%<br />
6%<br />
1,6<br />
1,4<br />
1,2<br />
1,0<br />
0,8<br />
0,6<br />
0,4<br />
0,2<br />
0,0<br />
S&P expects FFO/adj. net debt of 35% for the current BBB rating, and the realised<br />
number ended well above this threshold at 53% in 2010. After accounting for a suggested<br />
121% ordinary dividend increase to EUR232m and a 10-20% capex increase<br />
to around EUR155m in 2011, we expect metrics in 2011 to remain solid for the rating.<br />
S&P and Moody’s placed the outlook on the BBB/ Baa2 ratings on Stable (up<br />
from Negative) in August and September 2010.<br />
93 | 13 April 2011<br />
www.danskeresearch.com
<strong>Scandi</strong> Handbook<br />
2009 was a difficult year but 2010 marked the turning point<br />
Metso faced tough market conditions in 2009, as its customers dramatically reduced<br />
capital spending levels. Net sales declined 22% to EUR5bn, and the EBIT margin<br />
declined to 5.9%, from 10% in the previous year. However, in 2010 net sales increased<br />
11%, and the EBIT margin was up above 2pp to 8%. Although sales and<br />
profitability are not back at 2008 levels yet, we expect 2011 to be a strong year in<br />
terms of sales and profitability, highlighted by the impressive 36% increase in order<br />
intake in 2010 compared to 2009.<br />
Metso expects 2011 sales to grow more than 10%, and it also expects an improvement<br />
in clean EBITA from the 8.8% and 8.0% in 2010 and 2009, respectively. Metso<br />
bases these estimates on, among other things, the order backlog of EUR4.0bn at the<br />
end of 2010, compared to EUR3.4bn at the end of 2009. The order backlog contains<br />
orders worth about EUR3.1bn for 2011.<br />
Following the strong rebound in 2010, we expect order intake to slow over the coming<br />
quarters, but to remain supported by Metso’s global geographical diversification.<br />
We expect FFO to continue the improving trend, also supported by significant cost<br />
reductions and higher capacity utilisation. In our view, some increase in net working<br />
capital and higher capex will weigh on FOCF and reduce the potential for further<br />
significant debt reductions.<br />
Study to evaluate structural options discontinued<br />
In August 2008, Metso announced that it had hired Goldman Sachs to assess valueenhancing<br />
opportunities, including structural options for the group. Speculation of a<br />
break-up of the company was therefore on the table again (a similar announcement<br />
was made in August 2005). In November 2008, Metso announced that the study to<br />
evaluate structural options had been discontinued due to the uncertain economic<br />
outlook.<br />
This is clearly positive for credit investors, as a potential break-up of the company<br />
would create significant risks regarding where bonds are placed, where the CDS<br />
would reference and how the entities would be capitalised. Furthermore, diversification<br />
benefits are maintained as cash flow from different business areas is only partially<br />
correlated and kept under one roof. A study to evaluate transforming structural<br />
options could resurface in the future, in our view.<br />
Recommendation<br />
METSO’14 trades just above a curve of BBB industrials. Still, we do not find<br />
METSO’14 attractive at current levels due to the latent break-up risk of the company<br />
with potential significant adverse consequences for debt holders. We want a material<br />
risk premium for exposure to METSO’14 (around ASW +94/88bp) relative to<br />
equally-rated SANDVK’14 (around ASW +83/77bp) and better-rated ATCOA’14<br />
(around ASW +24/18bp) and recommend investors to HOLD METSO’14 (we prefer<br />
exposure to SANDVK’14). We have a negative view on the 5y CDS trading around<br />
103/113bp and recommend buying protection.<br />
Metso signed a 5Y EUR500m committed revolving credit facility in December 2010<br />
to replace an existing facility of equal size. While Metso’s liquidity profile is strong,<br />
we would not be surprised to see the company approach the primary bond market to<br />
opportunistically extend debt maturities.<br />
94 | 13 April 2011<br />
www.danskeresearch.com
<strong>Scandi</strong> Handbook<br />
Financial data Metso<br />
Key figures (EURm) 2006 2007 2008 2009 2010<br />
Net Sales 4,955 6,250 6,400 5,016 5,552<br />
EBITDA 562 728 775 437 623<br />
EBIT 457 580 637 294 445<br />
Net interest expenses 36 33 89 72 75<br />
Net profit 410 384 390 151 258<br />
FFO (1) 460 580 574 252 481<br />
Capex 131 159 255 116 134<br />
EBITDA-Capex 431 569 520 321 489<br />
RCF (2) 262 368 149 153 376<br />
FCF (3) 113 -77 -543 555 267<br />
Net debt (4) 454 540 1,099 583 310<br />
Adjusted net debt (5) 797 856 1,614 1,151 894<br />
Equity (incl. minorities) 1,474 1,615 1,453 1,792 2,071<br />
Total debt 830 819 1,435 1,576 1,373<br />
Total capital (6) 2,304 2,434 2,888 3,368 3,444<br />
Ratios<br />
EBITDA margin (%) 11% 12% 12% 9% 11%<br />
Capex/Net revenues (%) 3% 3% 4% 2% 2%<br />
EBITDA/Net interest expenses (x) 15.6x 22.1x 8.7x 6.1x 8.3x<br />
Adj net debt/EBITDA (x) 1.4x 1.2x 2.1x 2.6x 1.4x<br />
Net debt/EBITDA (x) 0.8x 0.7x 1.4x 1.3x 0.5x<br />
FFO/Adjusted net debt 58% 68% 36% 22% 54%<br />
RCF/Adjusted net debt 33% 43% 9% 13% 42%<br />
Net debt/Equity (%) 31% 33% 76% 33% 15%<br />
Net debt/Total capital (%) 20% 22% 38% 17% 9%<br />
Adjusted net debt/Total capital (%) 35% 35% 56% 34% 26%<br />
(1) Funds from operations. (2) FFO less dividends. (3) RCF less capex and changes in working capital (4) Total interest-bearing debt less cash and marketable<br />
securities. (5) Net debt adjusted contingent liabilities/contractual obligations as reported. (6) Equity and unadjusted total debt. Source: Company data, <strong>Danske</strong> Fixed<br />
Income Credit Research<br />
Quarterly review (EURm)<br />
Q4 09 Q1 10 Q2 10 Q3 10 Q4 10<br />
Net sales 1,353 1,170 1,370 1,325 1,687<br />
EBITDA 124 135 169 174 196<br />
EBITDA margin (%) 9% 12% 12% 13% 12%<br />
Net income 25 30 85 67 76<br />
Net debt 583 578 538 415 310<br />
Adjusted net debt 1,151 1,146 1,106 983 878<br />
Source: Company data, <strong>Danske</strong> Fixed Income Credit Research<br />
Divisional quarterly overview (EURm)<br />
Q4 09 Q1 10 Q2 10 Q3 10 Q4 10<br />
Mining and Construction Net sales 524 472 541 563 659<br />
EBIT margin 8% 8% 18% 13% 13%<br />
Energy and Environmental Net sales 419 332 334 312 457<br />
EBIT margin 7% 7% 7% 10% 9%<br />
Paper and Fibre Net sales 406 364 494 443 555<br />
EBIT margin -2% 3% 5% 7% 2%<br />
Source: Company data, <strong>Danske</strong> Fixed Income Credit Research<br />
95 | 13 April 2011<br />
www.danskeresearch.com
<strong>Scandi</strong> Handbook<br />
Sandvik<br />
Company overview<br />
Swedish Sandvik, founded in 1862, has market-leading positions in tooling systems<br />
for the metalworking industry, products for rock-excavation operations and speciality<br />
steel products. Generally cyclical demand is mitigated by global diversification of<br />
sales, increasing aftermarket sales, technological leadership, effective barriers to<br />
entry and economies of scale. The business is split between Tooling (29% of 2010<br />
sales), Mining & Construction (43% of sales), and Materials Technology (21% of<br />
sales). Sandvik also fully consolidates Seco Tools (7% of sales) due to its 61% ownership.<br />
The group has about 47,000 employees and representation in 130 countries.<br />
Sandvik has a diverse ownership structure. The largest shareholder is Industrivärden<br />
AB (12% of shares).<br />
Key credit considerations<br />
High value-added products and technological leadership<br />
Sandvik’s global business concept revolves around developing, manufacturing and<br />
marketing products and services of key importance to customer productivity. Given<br />
technological leadership, economies of scale and access to distribution channels,<br />
barriers to entry are significant. Sandvik Tooling (together with Seco Tools) is the<br />
clear global market leader in tooling systems for the metalworking industry while<br />
Mining & Construction holds leading positions in equipment for drilling, excavation,<br />
demolition and transport of rock and minerals. Materials Technology holds worldleading<br />
positions in most of its niche markets supported by high value-added content.<br />
Cyclical demand mitigated by global diversification<br />
Operations in the three core business areas of Tooling, Mining & Construction and<br />
Materials Technology exhibit significant cyclicality. However, a diversification gain<br />
is derived from demand being only partially correlated across divisions. Demand for<br />
Sandvik’s products is broadly correlated with general industrial activity in segments<br />
such as automotive and general engineering as well as capital spending levels in the<br />
mining and construction industry. Strong geographical and good customer segment<br />
diversification balance cyclicality in demand. While M&A activity has been reduced<br />
recently, Sandvik carried out some 50 acquisitions in 1997 to 2007 adding around<br />
17,000 employees in line with the company’s strategy to strengthen and add new<br />
products and markets. In the same period, geographical diversification increased<br />
significantly. In 2010, 38% of sales were generated in Europe, 17% in NAFTA, 28%<br />
in Asia and Australia, 10% in Africa and Middle East, and 7% in South America. A<br />
large installed base partially reduces earnings volatility given an increasing share of<br />
relatively stable service and aftermarket sales. Demand and operating performance<br />
plunged in 2009 but strongly recovered throughout 2010.<br />
Credit metrics are rapidly improving and strong for BBB<br />
While having an A+ rating from S&P until May 2008, the company was most recently<br />
downgraded two notches to BBB (Stable) in March 2010. For the current<br />
rating, S&P expects FFO to adjusted net debt of 30-35% (45% end-2010, 2% end-<br />
2009) and FOCF to adjusted net debt of 10-15% (29% end-2010, 20% end-2009).<br />
Hence, credit metrics have improved to a level significantly exceeding expectations<br />
for the rating. Despite an increase in the proposed dividend for 2010, we expect a<br />
one-notch upgrade from S&P to BBB+ to be just around the corner. This is also<br />
supported by strong working capital management under recent quarters of sales and<br />
order growth.<br />
BUY<br />
Sector: Industrials, Machinery<br />
Corporate ticker: SANDVK<br />
Equity ticker: SAND SS<br />
Market cap: SEK145bn<br />
Ratings:<br />
S&P rating: BBB S<br />
Moodys rating: NR<br />
Fitch rating: NR<br />
Analyst:<br />
Kristian Myrup Pedersen<br />
kripe@danskebank.dk<br />
+45 45128519<br />
Asbjørn Purup Andersen<br />
apu@danskebank.dk<br />
+45 45148886<br />
Key credit issues<br />
Strengths:<br />
• World-leading market positions<br />
• High value-added products and<br />
technological leadership<br />
• Strong customer segment and<br />
geographical diversification<br />
• High-margin and relatively stable<br />
aftermarket services<br />
Challenges:<br />
• Cyclical demand<br />
• High operating leverage and capital<br />
intensiveness<br />
• High debt level heading into crisis<br />
• Sharp decline in credit metrics<br />
triggered multi notch rating downgrades<br />
during crisis<br />
Source: <strong>Danske</strong> Markets<br />
96 | 13 April 2011<br />
www.danskeresearch.com
<strong>Scandi</strong> Handbook<br />
Liquidity<br />
End-2010, cash and cash equivalents amounted to SEK4.8bn and the EUR500m<br />
committed credit facility maturing 2012 and the EUR1bn committed credit facility<br />
maturing 2013 were fully undrawn. According to S&P, both are free of financial<br />
covenants. This compares with SEK3.8bn in short-term debt. Sandvik generated<br />
SEK8.4bn in FCF in 2010. This is record high, and we could see this decline in 2011,<br />
although we expect it to remain satisfactory. Following a 5Y EUR600m Eurobond<br />
issue in February 2009, Sandvik redeemed SEK3.5bn of commercial paper, thus<br />
reducing its short-term debt exposure. Debt maturities in 2011 to 2013 are fairly<br />
limited and smooth. Of course, the two before mentioned committed credit facilities<br />
are to mature in 2012 and 2013, but we do not expect the refinancing to cause any<br />
difficulties. All in all, we believe Sandvik’s liquidity position is solid.<br />
Current performance drivers<br />
Strong rebound in profit and new orders<br />
Being a relatively cyclical company, Sandvik benefitted from the continued increase<br />
in global industrial production during 2010, and it experienced increased demand in<br />
all products across all markets. Net sales increased by 15% to SEK82.7bn in 2010,<br />
compared to SEK71.9bn in 2009. Importantly, net profit turned back to positive<br />
territory and amounted to SEK6.9bn for 2010, compared to a loss of SEK2.6bn in<br />
2009. However, net profit is still some 20% behind pre-crises levels.<br />
Sandvik reported Q4 10 sales and net profit in line with consensus expectations and<br />
materially up from last year. Net sales increased 28% y/y to SEK23.3bn after 3%<br />
currency headwind while order intake surged 33% to SEK26.3bn (the highest order<br />
intake in a single quarter to date), resulting in a 114% book-to-build ratio. Strong<br />
demand from particularly mining, energy, automotive and aerospace industries continued<br />
during the quarter. Sandvik saw a pronounced increase in major project orders<br />
most of which related to material-handling systems. Combined with significant 2011<br />
capex budgets expected from large mining companies, we interpret a pick-up in<br />
major project orders towards end-2010 as a sign of increased risk appetite among<br />
Sandvik’s major customers.<br />
The clean operating margin improved to 13.4% from 2.2% in the same period last<br />
year and 12.5% in the previous quarter supported by higher volumes, higher capacity<br />
utilization, favourable product mix and a lower cost level. Net profit increased to<br />
SEK2.1bn from red numbers in the same period last year. Cash flow remained strong<br />
during Q4 10 where only a minor increase in working capital resulted in a ratio to<br />
sales of 22% (32% last year). This is below the target level of 25% for the first time.<br />
Reported net debt further declined to SEK23.2bn from SEK30.3bn end-2009. A<br />
pension-adjusted gearing ratio of 0.7x is below the company target of a maximum 1x,<br />
and an increase in the proposed dividend to SEK3.00/share (from SEK1.00/share last<br />
year) is expected and acceptable from a credit perspective.<br />
Credit metrics turned significantly around in 2010 all for the better<br />
Sandvik was dramatically affected by the global economic downturn in 2009, but this<br />
trend turned around in 2010 when Sandvik benefitted from the continued increase in<br />
global industrial production. Hence, credit metrics improved significantly, and we<br />
expect a one-notch upgrade from S&P to BBB+ to be just around the corner.<br />
Debt maturity profile (end-2010)<br />
SEKm<br />
14000<br />
12000<br />
10000<br />
8000<br />
6000<br />
4000<br />
2000<br />
0<br />
Source: Company data and <strong>Danske</strong> Markets<br />
Profitability<br />
SEKm<br />
Source: Company data and <strong>Danske</strong> Markets<br />
Credit metrics<br />
SEKm<br />
100.000<br />
90.000<br />
80.000<br />
70.000<br />
60.000<br />
50.000<br />
40.000<br />
30.000<br />
20.000<br />
10.000<br />
0<br />
45.000<br />
40.000<br />
35.000<br />
30.000<br />
25.000<br />
20.000<br />
15.000<br />
10.000<br />
5.000<br />
0<br />
2011 2012 2013 2014 2015+<br />
2006 2007 2008 2009 2010<br />
Net sales EBITDA EBITDA margin<br />
2006 2007 2008 2009 2010<br />
Source: Company data and <strong>Danske</strong> Markets<br />
Sales by segments 2010<br />
Source: Company data and <strong>Danske</strong> Markets<br />
25%<br />
20%<br />
15%<br />
10%<br />
5%<br />
0%<br />
Adj Net debt Equity Adj. net debt/EBITDA<br />
Materials<br />
Technology<br />
21%<br />
Seco Tools<br />
7%<br />
Tooling<br />
29%<br />
Mining and<br />
Construction<br />
43%<br />
12<br />
10<br />
8<br />
6<br />
4<br />
2<br />
0<br />
FFO to adjusted net debt improved to 45% end-2010, compared to 2% and 30% in<br />
2009 and 2008, respectively. Adjusted net debt to EBITDA improved to 1.9x end-<br />
2010, compared to 11.4x and 2.4x in 2009 and 2008. As the metrics show, 2009 was<br />
an extremely bad year for Sandvik, but after a strong 2010, credit metrics are back at<br />
levels that are stronger than the 2008-levels – and actually closer to 2007-levels.<br />
97 | 13 April 2011<br />
www.danskeresearch.com
<strong>Scandi</strong> Handbook<br />
2009 was brutal but after 2010 Sandvik is back in line with targets<br />
Sandvik was dramatically affected by the global economic downturn in 2009 and<br />
significant adjustments to production and cost-reduction efforts were initiated. Net<br />
sales organically declined 29% in 2009 and the operating loss amounted to SEK1.4bn<br />
compared with an operating profit of SEK12.9bn in 2008. This was reflected in a<br />
significant underperformance on long-term financial targets in 2009. Sandvik operates<br />
with four long-term financial targets: 1) Organic growth of 8%, 2) Return on<br />
capital employed of 25%, 3) net debt/equity ratio between 0.7-1.0, and 4) payout<br />
ratio above 50% of earnings per share. In 2009, organic growth was -29%, return on<br />
capital employed was -1.3%, net debt/equity was 1.0, and the payout ratio was not<br />
meaningful given negative earnings. However, as mentioned above, Sandvik’s performance<br />
turned around in 2010, and as a consequence it met three out of the four<br />
financial long-term targets. The organic growth was 17%, return on capital employed<br />
was 17%, net debt/equity was 0.7, and the payout ratio was 54%.<br />
Although Sandvik underperformed on financial targets in 2009, an important – and<br />
credit positive – take away from the year was Sandvik’s ability to manage and control<br />
cash flows. Sandvik took strong measures to secure cash flow generation in<br />
2009. The rate of production was below invoiced sales with significant fixed cost<br />
under-absorption as a result. However, the credit-supportive focus on cash flow resulted<br />
in a substantial reduction in inventory and a SEK12bn release of working<br />
capital for the full year. Capex declined 35% to SEK4.6bn in 2009. As a result,<br />
Sandvik generated a very strong SEK7.2bn FOCF in 2009.<br />
Broad exposure toward cyclical industrials<br />
Importantly, Sandvik serves a broad range of customers in different industries and<br />
geographic regions. However, the cyclical construction, mining and automotive<br />
industries accounted for roughly 60% of sales in 2010. Operations in the three core<br />
business areas of Tooling, Mining & Construction and Materials Technology exhibit<br />
significant cyclicality. However, a diversification gain is derived from demand being<br />
only partially correlated across divisions. Demand for Sandvik’s products is broadly<br />
correlated with general industrial activity in segments such as automotive and general<br />
engineering as well as capital spending levels in the mining and construction industry.<br />
Strong geographical and good customer segment diversification balance cyclicality in<br />
demand. This diversification has been increased throughout the period 2000-2010, as<br />
Sandvik has acquired about 40 companies in 20 countries, thereby adding around<br />
SEK17bn in sales and more than 10,000 employees to the organisation.<br />
Recommendation<br />
Sandvik should clearly trade within equally rated METSO 2014 (around ASW<br />
+94/88bp) but we require a spread premium relative to better-rated SKF 2013<br />
(around ASW +38/28bp) and ATCOA 2014 (around ASW +24/18bp). SANDVK<br />
2014 (around ASW +83/77bp) trades cheap compared to BBB+ general industrials,<br />
and we see further upside and find it attractive on a relative basis. Hence, we have a<br />
BUY recommendation on the name. There is currently no liquid CDS trading on<br />
Sandvik.<br />
98 | 13 April 2011<br />
www.danskeresearch.com
<strong>Scandi</strong> Handbook<br />
Financial data Sandvik<br />
Key figures (SEKm) 2006 2007 2008 2009 2010<br />
Net sales 72,289 86,338 92,654 71,937 82,654<br />
EBITDA (1) 15,112 17,550 16,354 3,227 15,178<br />
EBIT (1) 12,136 14,473 12,873 -1,314 11,140<br />
Net interest expenses 900 1,344 2,217 2,060 1,617<br />
Net profit 8,107 9,594 7,836 -2,596 6,943<br />
FFO (2) 11,439 12,415 11,435 645 12,701<br />
Capex 4,801 5,399 7,169 4,625 3,747<br />
EBITDA-capex 10,311 12,151 9,185 -1,398 11,431<br />
OpFCF (3) 7,032 4,878 7,568 10,032 11,341<br />
FCF (4) -164 -4,130 -2,609 3,241 7,214<br />
Net debt (5) 13,630 26,840 32,130 29,218 22,420<br />
Adjusted net debt (6) 19,722 33,982 38,588 36,748 28,557<br />
Total capital 42,573 58,669 73,853 66,681 61,016<br />
Ratios<br />
EBITDA margin (%) 20.9% 20.3% 17.7% 4.5% 18.4%<br />
EBIT margin (%) 16.8% 16.8% 13.9% -1.8% 13.5%<br />
Capex/net revenues (%) 6.6% 6.3% 7.7% 6.4% 4.5%<br />
EBITDA/net interest expenses (x) 16.8x 13.1x 7.4x 1.6x 9.4x<br />
FFO/net debt (%) 83.9% 46.3% 35.6% 2.2% 56.7%<br />
FFO/adj net debt (%) 58.0% 36.5% 29.6% 1.8% 44.5%<br />
Net debt/EBITDA (x) 0.9x 1.5x 2.0x 9.1x 1.5x<br />
Adj net debt/EBITDA (x) 1.3x 1.9x 2.4x 11.4x 1.9x<br />
Net debt/total capital (%) 32% 46% 44% 44% 37%<br />
(1) Adjusted for non-recurring items and operating leases. (2) Net income after tax plus depreciation and amortization, deferred tax and other non cash items.<br />
Adjusted for operating leases. (3) CFO plus interest and taxes paid less capex. (4) OpFCF less interest paid, tax paid, and dividends. (5) Total interest-bearing debt<br />
less cash and equivalents. (6) Net debt adjusted for operating leases, postretirement liabilities and contingent liabilities. Source: Company data and <strong>Danske</strong> Markets<br />
Quarterly review (SEKm)<br />
Q4 09 Q1 10 Q2 10 Q3 10 Q4 10<br />
Net sales 18,211 18,534 20,603 20,241 23,276<br />
EBIT 408 1,897 3,471 2,532 3,129<br />
EBIT margin (%) 2% 10% 17% 13% 13%<br />
Net income -103 1,122 2,075 1,560 2,094<br />
Net debt (reported) 30,342 29,078 28,922 24,909 23,200<br />
Adj net debt/LTM EBITDA (x) 11.3 6.9 3.4 2.4 1.9<br />
LTM FFO/adj net debt (%) 3% 10% 24% 36% 45%<br />
Source: Company data and <strong>Danske</strong> Markets<br />
Divisional quarterly overview (SEKm)<br />
Q4 09 Q1 10 Q2 10 Q3 10 Q4 10<br />
Tooling Sales 4,960 5,551 6,122 5,966 6,255<br />
EBIT margin -2% 15% 21% 16% 19%<br />
Mining & Construction Sales 8,042 7,588 8,375 8,676 10,543<br />
EBIT margin 5% 8% 15% 14% 14%<br />
Materials Technology Sales 3,976 4,019 4,618 4,170 4,896<br />
EBIT margin 3% 8% 15% 5% 7%<br />
Seco Tools Sales 1,225 1,367 1,479 1,420 1,572<br />
EBIT margin 10% 16% 21% 17% 20%<br />
Source: Company data and <strong>Danske</strong> Markets<br />
99 | 13 April 2011<br />
www.danskeresearch.com
<strong>Scandi</strong> Handbook<br />
Scania<br />
Company overview<br />
Sweden’s Scania is the fourth-largest heavy truck producer globally, focusing solely<br />
on the heavy segment (over 16 tonnes). Scania also operates in buses, industrial engines<br />
and marine engines and provides significant aftermarket and financial services. The<br />
industry is capital-intensive, competitive and highly-cyclical. Scania has marketleading<br />
profitability, driven by its superior operating efficiency and component<br />
commonality. Scania’s largest market is Europe with 41% of vehicles delivered in<br />
2010, followed by Latin America (32%), Asia (18%), Africa & Oceania (5%) and<br />
Eurasia (4%). Volkswagen took over tendered shares from Porsche in February 2009<br />
and now controls 46% of the capital and 71% of the voting rights in Scania.<br />
Key credit considerations<br />
Sound geographical diversification in highly-cyclical heavy truck market<br />
Scania operates in highly-cyclical, capital-intensive and competitive industries and<br />
has large operations in heavy-duty trucks over 16 tonnes (accounting for 61% of<br />
2010 sales). This segment is generally considered to be more profitable but also more<br />
volatile than lighter truck segments. This is mitigated by sound geographical diversification<br />
(although diversification lags its peer, Volvo), critical mass that creates economics<br />
of scale, market-leading innovations and an up-to-date product line. Furthermore,<br />
an increasing proportion of aftermarket and financial services is creditpositive,<br />
as the former is characterised by lower risk and higher margins, while the<br />
latter has rating dependency. Hence, Scania has an incentive to preserve a conservative<br />
capital structure to facilitate attractive financing conditions for customers.<br />
The demand for heavy trucks is strongly correlated with the level of overall economic<br />
and industrial activity, and the introduction of new emission standards. While<br />
Scania’s reliance on Europe is significant, with 51% of sales in 2010, the contribution<br />
from Latin America, where Scania is the market leader, has been growing steadily<br />
since 2002 and accounted for 28% of sales in 2010, ahead of Asia with 12%. New<br />
order intake and deliveries contracted sharply on a global basis in the first half of<br />
2009 and Scania initiated substantial production cuts. Although emerging market<br />
demand has picked up, the European market is still rather subdued.<br />
Leading operational efficiency and solid balance sheet<br />
Scania has market-leading operational efficiency and synchronisation of engine platforms,<br />
which is credit-positive and driven by its continued focus on synergies across its<br />
truck, bus and coach production sites. It benefits from the highest level of component<br />
commonality in the sector and has increased the annualised number of vehicles produced<br />
per employee from 3 in 1990 to 6.6 in 2010. Furthermore, Scania is not exposed<br />
to the traditionally more volatile North American heavy truck market. In 2010, Scania’s<br />
operating margin was 16.3%, compared with Volvo’s 6.8%.<br />
Two truck brands under one roof?<br />
Following the merger between Porsche and Volkswagen, to be completed in 2011, the<br />
focus will be on Volkswagen’s strategy related to its 71% stake in Scania and 30%<br />
stake in MAN. A future collaboration or merger between Scania and MAN has already<br />
been announced. Currently, S&P operates under a framework where Scania is effectively<br />
a subsidiary of Volkswagen, thus having its rating capped at the level of Volkswagen.<br />
S&P also incorporates a one-notch uplift to Scania’s ‘BBB+’ stand-alone rating<br />
due to the Volkswagen ownership stake, after having made an implicit downgrade its<br />
stand-alone credit rating in March 2010.<br />
SELL<br />
Sector: Industrials; Machinery<br />
Corporate ticker: SCANIA<br />
Equity ticker: SCVB SS<br />
Market cap: SEK115.2bn<br />
Ratings:<br />
S&P rating: A- /NO<br />
Moodys rating: NR<br />
Fitch rating: NR<br />
Analyst:<br />
Asbjørn Purup Andersen<br />
apu@danskebank.com<br />
+45 45148886<br />
Kristian Myrup Pedersen<br />
kripe@danskebank.com<br />
+45 45128519<br />
Key credit issues<br />
Strengths:<br />
• Leading market positions in<br />
Europe and Latin America.<br />
• Leading component commonality<br />
supports high profitability.<br />
• Sound geographical diversification<br />
of end-markets.<br />
• Solid proportion of stable aftermarket<br />
service business.<br />
Challenges:<br />
• High degree of cyclicality makes<br />
sales and earnings volatile.<br />
• High operational leverage and<br />
capital-intensive production.<br />
• Competitive bus markets with<br />
resulting price pressure.<br />
• Heavy exposure to subdued European<br />
market with overcapacity.<br />
Source: <strong>Danske</strong> Markets<br />
100 | 13 April 2011<br />
www.danskeresearch.com
<strong>Scandi</strong> Handbook<br />
Liquidity<br />
We see Scania’s liquidity as adequate. After 2010, the company had cash and equivalents<br />
of SEK9.6bn in its industrial operations. However, S&P estimates that a substantial<br />
SEK6.6bn is reserved to maintain operations. Scania also has two committed revolving<br />
credit facilities of EUR1bn each, maturing in 2012 and 2013, and two committed<br />
credit facilities in the domestic Swedish market of SEK9.0bn. At the end of 2010,<br />
Scania had access to a total of SEK26.9bn in unutilised committed credit facilities.<br />
According to S&P, the bank lines are not subject to financial covenants or rating triggers,<br />
although the revolving credit facilities contain a material adverse change clause.<br />
This compares with current interest-bearing liabilities of SEK12.4bn. However, the<br />
vast part of the current liabilities relate to the captive finance division (more than<br />
100% of total net debt is attributable to the Financial Services division, as the Vehicles<br />
and Services division holds a net cash position). The captive financing portfolio<br />
amortises in accordance with debt maturities and the portfolio only includes customer<br />
credit risk, while currency, interest rate and liquidity risk are fully matched. Hence,<br />
financial services only needs to obtain new financing related to new truck sales.<br />
Current performance drivers<br />
Profitability boosted by adjustments of production<br />
In response to the downturn, Scania focused on selling off inventories that had accumulated<br />
due to order cancellations during H2 09. Since then, capacity utilisation has improved<br />
as Scania has supplied the roaring Brazilian market with components from its<br />
European production unit with idle capacity. This helped to boost profit margins, in<br />
combination with cost reductions and other adjustments of production. In fact, the<br />
operating margin for the Vehicles and Services division ended up at a record 18.3% in<br />
Q3 10, while the EBITDA-margin for the quarter was 21.6%.<br />
Subdued demand in Europe remains a chink in Scanias armour...<br />
The majority of Scania’s operations (51% of 2010 sales) are in Europe. These markets<br />
remain relatively subdued and demand is expected to pick up later than in North America<br />
and Asia due to overcapacity among hauliers in the European transport sector, depressed<br />
freight prices and a young truck fleet with low replacement demand. This also<br />
resulted in price erosion on new trucks, which affected earnings negatively for Scania<br />
in H1 10. Demand has improved recently, albeit from low levels. Northern Europe is<br />
recovering while Southern Europe remains weak. Scania has noted that this recovery is<br />
occurring slowly and freight prices have remained at a low level.<br />
...while Brazilian demand has boomed, fuelled by government subsidies<br />
On other hand, Scania has benefited from its geographical diversification as emerging<br />
markets, led by Latin America, have seen a recovery, with roaring demand in<br />
Brazil. This has been fuelled by government tax breaks and interest rate subsidies to<br />
stimulate demand. Although the subsidised financing has been extended to expire in<br />
March 2011, Latin American truck orders already began to decline in Q4 10 (down<br />
11% q/q and down 10% y/y). We suspect that Brazilian demand might have peaked<br />
and expect Latin American demand to decline from its current apex.<br />
Credit metrics are strong as Scania turns net cash<br />
Due to strong cash flow, the Vehicles and Services division turned net cash in H1 10.<br />
However, Scania has significant unfunded pension liabilities and we estimate adjusted<br />
net debt-to-equity to be around 0% at the end of 2010. Adjusted net debt to LTM<br />
EBITDA has improved from 1.8x in 2009 to 0.0x in 2010. S&P targets this metric to be<br />
‘comfortably below 1.0x’ for the ‘A-’ rating. Hence, Scania has comfortable headroom<br />
for the current rating. However, rating upside is constrained by the ownership influence<br />
of Volkswagen in spite of solid credit metrics.<br />
Consolidated debt maturities<br />
(as of 31 December 2010)<br />
SEKbn<br />
16<br />
14<br />
12<br />
10<br />
8<br />
6<br />
4<br />
2<br />
0<br />
Source: Company data, <strong>Danske</strong> Markets<br />
Profitability<br />
SEKbn<br />
100<br />
90<br />
80<br />
70<br />
60<br />
50<br />
40<br />
30<br />
20<br />
10<br />
0<br />
'11 '12 '13 '14 '15 '16+<br />
Source: Company data, <strong>Danske</strong> Markets<br />
Sales by segments, 2010<br />
Source: Company data, <strong>Danske</strong> Markets<br />
Credit metrics<br />
SEKbn<br />
30<br />
25<br />
20<br />
15<br />
10<br />
5<br />
0<br />
-5<br />
2006 2007 2008 2009 2010<br />
Source: Company data, <strong>Danske</strong> Markets<br />
20%<br />
18%<br />
16%<br />
14%<br />
12%<br />
10%<br />
8%<br />
6%<br />
4%<br />
2%<br />
0%<br />
Net sales EBITDA EBITDA margin (rhs)<br />
Used vehicles<br />
6%<br />
Service<br />
21%<br />
Buses<br />
10%<br />
Engines<br />
2%<br />
2006 2007 2008 2009 2010<br />
Trucks<br />
61%<br />
2.0x<br />
1.6x<br />
1.2x<br />
0.8x<br />
0.4x<br />
0.0x<br />
-0.4x<br />
Adj net debt Equity Adj. net debt/EBITDA (rhs)<br />
101 | 13 April 2011<br />
www.danskeresearch.com
<strong>Scandi</strong> Handbook<br />
Scania as independent operation and brand may be at risk<br />
Volkswagen took over tendered shares from Porsche in February 2009 and now has<br />
effective control of Scania with 46% of the capital and 71% of the voting rights. At<br />
the same time, VW has a 30% stake in MAN, which led a failed attempt to buy<br />
Scania years ago and now controls 17% of the voting base in Scania.<br />
Ownership structure<br />
Volkswagen<br />
30% votes<br />
30% capital<br />
In July 2010, Scania and MAN announced that they are conducting feasibility studies<br />
for collaboration on component commonality and supply purchasing. While this<br />
could provide synergies, there are also associated downside execution and integration<br />
risks to this. The strategic decision appears to have been made by Volkswagen, with<br />
MAN seeming more in concurrence relative to Scania. Furthermore, we cannot rule<br />
out that the collaboration could later develop into a merger, as Volkswagen would<br />
bundle the two truck brands within Volkswagen into a single division. In fact, during<br />
MAN’s annual press conference, the CEO stated that a merger would result in more<br />
synergies and savings, compared to a loose cooperation between the two companies.<br />
71% votes<br />
46% capital<br />
Scania<br />
MAN<br />
17% votes<br />
13% capital<br />
Source: Company data, <strong>Danske</strong> Markets<br />
The truck operations have already been somewhat consolidated as MAN took over<br />
Volkswagen’s Brazilian truck and bus operations in December 2008. This makes sense<br />
as benefits of engine synchronisation and component commonality are significant.<br />
However, Volkswagen is likely to focus on the integration of Porsche, planned for<br />
2011, before turning its attention to a potential strategic merger between Scania and<br />
MAN.<br />
Credit rating is highly dependent on Volkswagen<br />
From S&P’s perspective, Scania has effectively become a subsidiary under Volkswagen’s<br />
control, because Volkswagen has enough voting power to influence both<br />
Scania’s business risk profile and financial risk profile. Scania’s autonomy is a major<br />
risk factor. Hence the ratings of the two companies are tightly linked and S&P has<br />
capped the rating of Scania at that of VW (‘A-’ negative outlook).<br />
The negative outlook on Scania is a direct reflection of Volkswagen’s situation and we<br />
continue to think it unlikely that the negative outlook will materialise in a downgrade.<br />
However, the capped rating also means that rating upside for Scania is limited unless<br />
the credit rating of Volkswagen is revised upwards. Furthermore, the Volkswagen<br />
ownership gives Scania a one-notch uplift from S&P from a ‘BBB+’ stand-alone rating.<br />
Recommendation<br />
We have an overall SELL recommendation on Scania, with focus on a tight CDS.<br />
For cash exposure within the sector, we prefer Volvo’s 2014 bond (Z-spread of<br />
+81bp). We do not rule out Scania as a new issue candidate, which could mark an<br />
opportunity to turn positive on cash.<br />
Although Scania’s credit metrics are superior to Volvo’s (BUY recommendation),<br />
Scania is highly reliant on the European market while Volvo has a much broader<br />
geographical diversification. The market for trucks in Europe is characterised by a<br />
relatively young fleet, with low replacement demand. We see markets such as the North<br />
American and Asian ones to gain momentum earlier than the European market, which<br />
will benefit Volvo more than Scania. Furthermore, we see risks to Scania’s financial<br />
and business risk profiles stemming from the influence of Volkswagen, and integration<br />
risk from collaboration and a possible merger with MAN.<br />
CDS levels on Scania are rather tight at 62/67bp and we recommend buying 5Y<br />
protection (see list of prices at the end of this book). Furthermore, with a 36bp spread<br />
gap in 5Y CDS between Scania and Volvo, we recommend at pair trade of selling 5Y<br />
protection on Volvo (103bp) and buying 5Y protection on Scania (67bp). Before<br />
December 2008, the respective CDS traded in line.<br />
102 | 13 April 2011<br />
www.danskeresearch.com
<strong>Scandi</strong> Handbook<br />
Financial data - Scania AB*<br />
Key figures (SEKm) 2006 2007 2008 2009 2010<br />
Net Sales 70,738 84,486 88,977 62,074 78,168<br />
EBITDA 11,628 14,757 15,333 5,420 15,140<br />
EBIT - Industrial Operations 8,605 11,636 12,098 2,648 12,575<br />
EBIT - consolidated 9,098 12,168 12,512 2,473 12,746<br />
Net interest expenses 187 214 375 722 193<br />
Net profit 5,939 8,554 8,890 1,129 9,103<br />
FFO (1) 9,267 12,317 12,362 4,092 13,593<br />
Capex (2) 3,810 4,545 5,386 3,149 2,809<br />
EBITDA-Capex 7,818 10,212 9,947 2,271 12,331<br />
OpFCF (3) 9,697 11,198 5,446 7,351 14,039<br />
FCF (4) 3,817 4,696 -2,627 4,215 10,684<br />
RCF 7,627 9,241 2,759 7,364 13,493<br />
Industrial net debt (5) -3,298 -1,777 6,993 3,104 -7,955<br />
Adj. Industrial net debt (6) 2,865 3,440 12,914 9,958 -969<br />
Equity (incl. minorities) 23,080 21,758 17,204 18,885 25,850<br />
Total capital 29,543 23,436 28,778 29,089 27,702<br />
Ratios 2006 2007 2008 2009 2010<br />
EBIT margin (%) 12.2% 13.8% 13.6% 4.3% 16.1%<br />
Capex/Net revenues (%) 5.4% 5.4% 6.1% 5.1% 3.6%<br />
EBITDA/Net int. expenses (x) 62.2x 69.0x 40.9x 7.5x 78.4x<br />
FFO/Adjusted net debt 323% 358% 96% 41% n.m.<br />
Adjusted net debt/EBITDA (x) 0.2x 0.2x 0.8x 1.8x -0.1x<br />
Net debt/Total capital (%) -11% -8% 24% 11% -29%<br />
*Note: Excluding Financial Services. (1) Net income from continuing operations plus depreciations, amortizations, deferred taxes, and other non-cash items. (2)<br />
Investments in tangible & intangible assets. (3) Cash flow from operating activities before net interest paid and taxes paid but less capex. (4) OpFCF less net interest<br />
paid, tax paid, and dividends. (5) Total interest-bearing debt less cash and marketable securities. (6) Net debt adjusted for operating leases, unfunded pension<br />
liabilities and contingent liabilities. Source: Company data, <strong>Danske</strong> Fixed Income Credit Research<br />
Quarterly review (SEKm)<br />
Q4 09 Q1 10 Q2 10 Q3 10 Q4 10<br />
Net sales 18,360 16,503 20,602 18,558 22,505<br />
EBIT 1,524 2,140 3,453 3,337 3,645<br />
EBIT margin 8.3% 13.0% 16.8% 18.0% 16.2%<br />
Net income (consolidated) 822 1,224 2,372 2,307 3,000<br />
Net debt 3,603 1,533 -1,308 -3,105 -6,580<br />
Net debt/LTM EBITDA 0.7x 0.2x -0.1x -0.2x -0.4x<br />
Source: Company data, <strong>Danske</strong> Fixed Income Credit Research<br />
Divisional quarterly overview<br />
Q4 09 Q1 10 Q2 10 Q3 10 Q4 10<br />
Europe Trucks Ordered 5,436 6,452 7,197 6,095 9,432<br />
Trucks Delivered 5,197 4,285 5,679 5,375 7,976<br />
Eurasia Trucks Ordered 444 450 393 1,126 1,892<br />
Trucks Delivered 456 392 312 398 1,267<br />
Latin America Trucks Ordered 4,324 4,439 6,194 4,356 3,879<br />
Trucks Delivered 3,649 3,750 4,685 4,478 5,143<br />
Asia Trucks Ordered 1,415 2,651 3,968 1,810 3,866<br />
Trucks Delivered 1,720 1,311 2,966 2,760 3,142<br />
Africa & Oceania Trucks Ordered 693 633 1,193 674 636<br />
Trucks Delivered 606 534 787 757 840<br />
Source: Company data, <strong>Danske</strong> Fixed Income Credit Research<br />
103 | 13 April 2011<br />
www.danskeresearch.com
<strong>Scandi</strong> Handbook<br />
Securitas<br />
Company overview<br />
Based in Sweden, the security services company Securitas has expanded rapidly over<br />
the past 20 years with sales rising from SEK1.3bn in 1988 to SEK61bn in 2010.<br />
After moving into Europe during the 1990s, it acquired Pinkertons in the US in 1999.<br />
Despite its gradual consolidation, the industry is highly fragmented. Securitas is the<br />
market leader in the mature European and North American markets but holds only<br />
11% of the global market. In 2006 Securitas spun off Security Systems and Direct<br />
(home alarms), while Loomis (cash-handling) was listed in 2008, after several postponements.<br />
The remaining operations of Securitas focus on security services, benefiting<br />
from a widespread client base. The largest shareholders are Gustaf Douglas and<br />
Melker Schörling, long-term shareholders with combined control of 41.8% of the<br />
votes and 17.2% of the capital.<br />
Key credit considerations<br />
Market leader in attractive industry<br />
Securitas is a market leader in the mature European and North American markets, while<br />
holding only 11% of the world market, having very low exposure to emerging markets.<br />
In recent years, emerging markets have enjoyed significantly higher growth rates than<br />
Europe and North America. Guarding markets in Europe and North America have<br />
reported historical growth of 4-6% annually and are relatively resilient to the sharp<br />
deterioration in the global economy. These markets are supported by a continuing<br />
outsourcing trend, a perception of rising crime rates and a focus on corporate crime and<br />
terrorism. The industry is characterised by price pressure, low entry barriers and strong<br />
competition. A well-diversified customer base, high client retention rates and long-term<br />
relationships support earnings visibility, while low and flexible capital expenditure<br />
encourage strong cash-flow generation. In our view, Securitas is a late-cyclical company.<br />
Spin-offs change business and financial risk profiles<br />
The announcement of a demerger in 2006 took the market by surprise, with a decision<br />
to spin off three divisions (security systems, alarms and cash-handling), with the proceeds<br />
payable to shareholders as dividends. The cash-handling division, Loomis, was<br />
listed in 2008. Although cash-handling operations carry a higher risk than the rest of the<br />
group’s services, what remains of Securitas after the three divestments has a weaker<br />
business risk profile, as diversification across business segments is reduced. The financial<br />
profile and credit metrics have strengthened following the divestment of Loomis, as<br />
it accounted for a relatively large proportion of operating leases and unfunded pension<br />
liabilities, while the loss of cash flow is limited. Furthermore, SEK2.4bn in group debt<br />
was transferred to Loomis at separation.<br />
Following the divestment, the group consists of Security Services North America,<br />
Security Services Europe and Mobile & Monitoring. Given ongoing price pressure<br />
and modest but stable profitability, Securitas targets increased specialisation and is<br />
attempting to climb the value chain by providing more technology, specialised guarding<br />
and customised solutions.<br />
Long record of opportunistic debt-funded acquisitions<br />
The fragmented nature of the security services market drives acquisitions in order to<br />
maintain and build positions. Securitas has a long history of debt-funded acquisitions,<br />
stretching its balance sheet. We expect this behaviour to remain a major part of Securitas’<br />
growth strategy. In the longer term, we believe that improved credit metrics<br />
following the Loomis divestment will be diluted by acquisition activity in emerging<br />
markets, aimed at catching up with G4S, with its strong presence and globallyintegrated<br />
facility service companies (e.g. ISS) in those regions.<br />
BUY<br />
Sector: Industrials;<br />
Commercial Services<br />
Corporate ticker: SECURI<br />
Equity ticker: SECUB SS<br />
Market cap: SEK27.9bn<br />
Ratings:<br />
S&P rating: BBB+ /S<br />
Moodys rating: NR<br />
Fitch rating: NR<br />
Analyst:<br />
Asbjørn Purup Andersen<br />
apu@danskebank.com<br />
+45 45148886<br />
Kristian Myrup Pedersen<br />
kripe@danskebank.com<br />
+45 45128519<br />
Key credit issues<br />
Strengths:<br />
• Leading global position in<br />
security services market.<br />
• Operates in market that is relatively<br />
recession-resilient.<br />
• Low operational leverage and flexible<br />
cost base.<br />
• Diverse customer base and geographical<br />
exposure.<br />
Challenges:<br />
• Competitive markets with low entry<br />
barriers and price pressure.<br />
• Fragmented markets drive<br />
growth acquisitions.<br />
• Limited rating upside from relatively<br />
strained financials.<br />
Source: <strong>Danske</strong> Markets<br />
104 | 13 April 2011<br />
www.danskeresearch.com
<strong>Scandi</strong> Handbook<br />
Liquidity<br />
We consider Securitas to have adequate liquidity. At the end of 2010, Securitas had<br />
SEK2.6bn in cash and equivalents. This compares with SEK2.3bn of debt maturing in<br />
2011 and no material maturities in 2012. Securitas also has SEK4.6bn available in<br />
unused committed credit lines.<br />
In January 2011, Securitas cancelled 91% of commitments under its USD1.1bn revolving<br />
credit facility (maturing in June 2012). This was instead replaced by a new multicurrency<br />
revolving credit facility of USD550m and EUR420m with maturity in January<br />
2016. According to S&P, the credit facilities do not include financial covenants or a<br />
material adverse change clause, although the interest margin moves in line with<br />
changes in the credit rating.<br />
In April 2009, Securitas raised EUR0.5bn in a 4y bond issue as part of its Euro Medium-Term<br />
Note programme, which was used to refinance existing drawing credit<br />
facilities. In September 2010 Securitas also issued two 4y Swedish krona floating rate<br />
bonds. This has lengthened Securitas’ previously from-end loaded debt maturity profile<br />
and diversified its funding, lowing the amount drawn under short-term facilities substantially.<br />
We consider the current maturity profile as benign with no material debt<br />
maturing before the 2013 Eurobond is to be redeemed.<br />
Current performance drivers<br />
Late cyclicality leaves recovery upside<br />
Due to the flexible business model with low operational leverage, Securitas managed<br />
to maintain stable EBIT during the crisis despite lower sales. Since then, Securitas<br />
has seen a slow recovery with the Security Services North American division dragging<br />
somewhat behind. Due to the late-cyclical nature of Securitas’ end-markets, we<br />
expect the numbers to improve, going forward. This is underlined by recent improvements<br />
in the contract portfolio.<br />
New dividend policy with limited effect on discretionary cash flow<br />
At the end of 2010, Securitas announced a change in its dividend payout policy.<br />
Previously, Securitas forecast a free cash flow averaging 75-80% of income with a<br />
dividend payout corresponding to between 40% and 50% of free cash flow. This will<br />
be changed, going forward, to free cash flow averaging 80-85% of income with a<br />
dividend payout of about 50% of free cash flow. While this increases dividend payments,<br />
the increase in the free cash flow also implies lower capital expenditure<br />
and/or improved working capital, which should offset the dividend increase and<br />
support discretionary cash flow.<br />
Credit metrics are adequate but with limited headroom<br />
Overall, Securitas benefits from solid and stable cash-flow generation, but has a<br />
stretched balance sheet following a history of debt-funded acquisitions. The adjusted<br />
net debt to EBITDA ratio is currently 2.8x at the end of 2010. For the ‘BBB+’ rating,<br />
S&P expects a FOCF to adjusted net debt ratio exceeding 15% on average and FFO<br />
to adjusted net debt of about 30%. Following the divestment of Loomis, FOCF to<br />
adjusted net debt improved to about 17% in Q1 09 but weakened slightly since to a<br />
level of 16% in 2010. FFO to adjusted net debt was 30% in 2010.<br />
We expect headroom to remain stretched<br />
The fragmented nature of the security services market drives acquisitions in order to<br />
maintain and build positions. With a heavy bias toward North America and Europe,<br />
Securitas aims to increase its global presence. In the longer term, we expect improved<br />
credit metrics following the Loomis divestment to be diluted by acquisition<br />
activity in emerging markets in order for Securitas to catch up with G4S, with its<br />
strong presence, and globally integrated facility service companies (e.g. ISS) in those<br />
regions.<br />
Debt maturity profile<br />
(as of 31 December 2010)<br />
SEKbn<br />
8.0<br />
7.0<br />
6.0<br />
5.0<br />
4.0<br />
3.0<br />
2.0<br />
1.0<br />
0.0<br />
Source: Company data and <strong>Danske</strong> Markets<br />
Profitability<br />
SEKbn<br />
70<br />
60<br />
50<br />
40<br />
30<br />
20<br />
10<br />
0<br />
Source: Company data and <strong>Danske</strong> Markets<br />
Sales by segments, 2010<br />
SS Europe<br />
51%<br />
Source: Company data and <strong>Danske</strong> Markets<br />
Credit metrics<br />
SEKbn<br />
20<br />
15<br />
10<br />
5<br />
0<br />
< 1y >1y<br />
2006 2007 2008 2009 2010<br />
Source: Company data and <strong>Danske</strong> Markets<br />
14%<br />
12%<br />
10%<br />
8%<br />
6%<br />
4%<br />
2%<br />
0%<br />
Net sales EBITDA EBITDA margin (rhs)<br />
Mobile &<br />
Monitoring<br />
10%<br />
SS North<br />
America<br />
39%<br />
2006 2007 2008 2009 2010<br />
8.0x<br />
6.0x<br />
4.0x<br />
2.0x<br />
0.0x<br />
Adj. net debt Equity Adj. net debt/EBITDA (rhs)<br />
105 | 13 April 2011<br />
www.danskeresearch.com
<strong>Scandi</strong> Handbook<br />
Although Securitas has a strong track record in successfully integrating acquisitions,<br />
acquisitions outside its home territory in Europe and North America have a higher<br />
integration risk. We therefore expect the company’s financial policy and appetite for<br />
expansionary investments to continue to weigh on credit in the long-term.<br />
Strategy launched in 2007<br />
Securitas’ current strategy was launched in August 2007 with the following three key<br />
elements: a higher degree of specialisation in the service offering; expansion of the<br />
Mobile & Monitoring division; and an increased global presence. In addition, Securitas’<br />
financial objectives include an annual increase in EPS of 10% and a free cash flow<br />
to net debt ratio of at least 0.2x, compared with 0.24x in 2010 and 0.25x in 2009.<br />
Geographical expansion continues<br />
Securitas is currently present in 45 countries, but intends to continue to expand with a<br />
target of presence in 60 countries within three years. We expect focus to be on<br />
emerging markets in order to catch up with the presence of peers in these regions.<br />
Although this implies more acquisitions, we expect these to be bolt-on in nature.<br />
While current credit metrics are commensurate for the current ‘BBB+’ credit rating,<br />
headroom to pursue larger debt-funded acquisitions remains limited.<br />
Recommendation<br />
We have an overall BUY recommendation on Securitas. The SECURI 2013 bond is<br />
trading at a wide level relative to the ‘BBB+’ credit rating, currently offered around<br />
ASW +60bp (see list of instrument prices at the end of this book). Securitas is a lowbeta<br />
company with solid cash flow and in our view the major spread driver is largescale<br />
M&A in both mature and new markets, which in turn restricts rating upside<br />
potential. In January 2011, Securitas refinanced its 2012 RCF with a new 2016 facility<br />
(equal to about EUR825m). This should support the SECURI 2013 bond price<br />
(EUR500m outstanding) as Securitas has virtually no debt maturing before this.<br />
Although Securitas underperformed relative to other <strong>Scandi</strong>navian corporates during<br />
H2 10, after the LBO of Tomkins in July 2010, the levels have now normalised. We<br />
continue to believe that LBO risk is fairly remote and note that SECURI 2013 bondholders<br />
have partial downside protection through a Change of Control provision. We<br />
have a neutral stance on the 5y CDS (trading around 80/90bp).<br />
106 | 13 April 2011<br />
www.danskeresearch.com
<strong>Scandi</strong> Handbook<br />
Financial data Securitas<br />
Key figures (SEKm) 2006 2007 2008 2009 2010<br />
Net Sales 60,523 62,905 55,248 62,667 61,340<br />
EBITDA 5,069 4,630 4,111 4,684 4,625<br />
EBITA 3,591 3,182 3,271 3,757 3,724<br />
EBIT (excl non-recurring items) 3,498 2,685 3,087 3,612 3,470<br />
Net interest expenses 471 540 472 589 502<br />
Net profit 514 526 2,322 2,118 2,081<br />
FFO (1) 4,217 2,865 3,134 3,428 3,240<br />
Capex 1,512 1,575 977 951 902<br />
EBITDA-Capex 3,557 3,056 3,134 3,733 3,723<br />
OpFCF (3) 3,065 3,575 3,249 3,375 3,267<br />
FCF (4) 502 1,280 880 998 935<br />
RCF 2,014 2,855 1,857 1,949 1,837<br />
Net debt (5) 11,234 11,613 9,606 8,630 8,483<br />
Adjusted net debt (6) 15,224 15,522 12,812 13,099 12,952<br />
Total capital 22,505 24,778 22,064 19,949 20,008<br />
Ratios 2006 2007 2008 2009 2010<br />
EBITA margin (%) 5.9% 5.1% 5.9% 6.0% 6.1%<br />
Capex/Net revenues (%) 2.5% 2.5% 1.8% 1.5% 1.5%<br />
EBITDA/Net interest expenses (x) 10.8x 8.6x 8.7x 7.9x 9.2x<br />
Net debt/EBITDA (x) 2.2x 2.5x 2.3x 1.8x 1.8x<br />
Adjusted net debt/EBITDA (x) 3.0x 3.4x 3.1x 2.8x 2.8x<br />
FFO/Adjusted net debt (%) 27.7% 18.5% 24.5% 26.2% 25.0%<br />
Net debt/Total capital (%) 50% 47% 44% 43% 42%<br />
(1) Net income from continuing operations plus depreciation, amortization, deferred taxes and other non-cash items. (2) Investments in tangible & intangible assets.<br />
(3) Cash flow from operating activities before net interest paid and taxes paid but less capex. (4) OpFCF less net interest paid, tax paid and dividends. (5) Total<br />
interest-bearing debt less cash and marketable securities. (6) Net debt adjusted for operating leases, unfunded pension liabilities, other off-balance sheet items and<br />
securitisations.<br />
Source: Company data, <strong>Danske</strong> Fixed Income Credit Research.<br />
Quarterly review (SEKm)<br />
Q4 09 Q1 10 Q2 10 Q3 10 Q4 10<br />
Net sales 15,233 14,871 15,424 15,327 15,718<br />
EBITA margin 7.0% 5.5% 5.6% 6.5% 6.7%<br />
Net income 610 450 470 575 585<br />
Net debt 8,630 8,042 9,939 9,005 8,483<br />
Net debt/LTM EBITDA 1.8x 1.7x 2.2x 1.9x 1.8x<br />
Net debt/Equity 97% 97% 98% 96% 97%<br />
Source: Company data, <strong>Danske</strong> Fixed Income Credit Research<br />
Divisional quarterly review (SEKm)<br />
Q4 09 Q1 10 Q2 10 Q3 10 Q4 10<br />
SS North Net sales 5,397 5,362 5,855 5,769 5,745<br />
America EBITA 361 289 350 357 384<br />
EBITA margin 6.7% 5.4% 6.0% 6.2% 6.7%<br />
SS Europe Net sales 7,862 7,530 7,515 7,443 7,796<br />
EBITA 548 394 381 431 498<br />
EBITA margin 7.0% 5.2% 5.1% 5.8% 6.4%<br />
Mobile and Net sales 1,541 1,488 1,486 1,505 1,530<br />
Monitoring EBITA 197 168 157 217 201<br />
EBITA margin 12.8% 11.3% 10.6% 14.4% 13.1%<br />
Source: Company data, <strong>Danske</strong> Fixed Income Credit Research<br />
107 | 13 April 2011<br />
www.danskeresearch.com
<strong>Scandi</strong> Handbook<br />
SKF<br />
Company overview<br />
SKF is the world’s leading bearing company. It ranks #1 in Europe, #2 in North America<br />
and #1 in Asia (excluding Japan). It was founded in 1907 and has led the bearing<br />
industry in innovation since then. The company has expanded into the service business<br />
and has refocused its offering to become a friction and motion control solutions provider.<br />
This has reduced earnings volatility and improved margins in an otherwise cyclical<br />
and competitive industry. SKF’s technical knowledge and capabilities are distributed<br />
across five technological platforms: Bearings & Units, Seals, Mechatronics, Services<br />
and Lubrication Systems. In all of these it has ambitions to become the preferred<br />
supplier. SKF has three divisions: Automotive, Industrial and Service, and has 40,200<br />
employees. Through Foundation Asset Management, the Wallenberg family controls<br />
29% of the votes and 12% of the capital.<br />
Key credit considerations<br />
Leading position in tough market<br />
The bearing industry is mature and competitive and SKF is the world market leader<br />
with an approximate share of 18%. The industry is cyclical, capital-intensive and characterised<br />
by customers’ high bargaining power. SKF has added to its product portfolio<br />
to reduce its cyclical exposure, which is also somewhat mitigated by strong geographical<br />
diversification and a broad customer base. Almost a third of sales go to the automotive<br />
industry, with the remainder spread among a large number of industries. SKF’s<br />
competitive advantages stem from a widespread distribution network and technological<br />
leadership through continued investments in R&D. Furthermore, SKF leads the industry<br />
in rationalisations and over the past decade it has implemented a number of large<br />
efficiency and cost-saving programmes. While the company has increased its product<br />
portfolio, bearings and related services remain core with 85-90% of revenue and EBIT.<br />
Over recent years, SKF has expanded higher-margin aftermarket services to account for<br />
more than a third of sales in 2010. Given its relatively resilient nature, this is positive<br />
from a credit perspective.<br />
New long-term financial targets set in 2010<br />
A new set of long-term financial targets was announced in H2 10 after SKF was operating<br />
in line with all of its main financial targets from 2007. The EBIT margin target was<br />
increased to 15% (previously 12%), sales growth to 8% in local currencies (previously<br />
6-8%) and ROCE to 27% (previously 24%). The ordinary dividend should amount to<br />
around half of SKF’s average net profit over the business cycle. SKF’s strategy focuses<br />
on expanding its high value-added products and solutions and reducing its exposure to<br />
commodity-like operations through outsourcing and disposals.<br />
Credit metrics improving, but headroom limited<br />
Large shareholder distributions and increased debt levels during past years have<br />
absorbed material rating headroom and left credit metrics more sensitive to deteriorating<br />
market conditions, in our view. Within the current ‘A-’ rating, S&P expects<br />
that the gearing ratio will not significantly exceed 50%, which does not leave much<br />
headroom from the current level of 49%. Furthermore, S&P expects FFO to adjusted<br />
net debt and FOCF to adjusted net debt to be above 40% and 20%, respectively, over<br />
the cycle. At the end of 2010, these metrics were 39% and 22%. Adjusted net debtto-EBITDA<br />
was 1.5x after 2010 versus the S&P requirement of below 2.0x. Following<br />
the decision to resume the previously suspended share repurchase programme (up<br />
to 5% of the outstanding shares) in 2009, the dividend per share for 2010 was increased<br />
by 43% from last year.<br />
HOLD<br />
Sector: Industrials; Machinery<br />
Corporate ticker: SKF<br />
Equity ticker: SKFB SS<br />
Market cap: SEK83.5bn<br />
Ratings:<br />
S&P rating: A- /S<br />
Moodys rating: A3 /S<br />
Fitch rating: NR<br />
Analyst:<br />
Asbjørn Purup Andersen<br />
apu@danskebank.com<br />
+45 45148886<br />
Kristian Myrup Pedersen<br />
kripe@danskebank.com<br />
+45 45128519<br />
Key credit issues<br />
Strengths:<br />
• Leading global position in<br />
bearings industry.<br />
• Broad customer base and geographical<br />
diversification.<br />
• Substantial higher-margin and<br />
stable aftermarket sales.<br />
Challenges:<br />
• Exposure to cyclical and competitive,<br />
mature markets.<br />
• Weak credit metrics for<br />
current A- credit rating.<br />
• Customers bargaining power.<br />
Source: <strong>Danske</strong> Markets<br />
108 | 13 April 2011<br />
www.danskeresearch.com
<strong>Scandi</strong> Handbook<br />
Liquidity<br />
We view SKF’s liquidity position as solid. At the end of 2010, SKF had SEK2.4bn in<br />
cash and cash equivalents, although some of the cash is held by subsidiaries and is<br />
not easily accessible. S&P estimates a requirement of SEK1.0bn to maintain ongoing<br />
operations. In addition, SKF has committed credit facilities maturing in 2014 and<br />
2017 of EUR500m (SEK 4.5bn) and SEK3.0bn, respectively. The 2014 facility is<br />
now 80% utilised after the acquisition of Lincoln, while the 2017 facility remains<br />
unused. According to S&P, there are no financial covenants or material adverse<br />
change clauses in the facility.<br />
This compares with SEK1.0bn in short-term debt. During 2009 and 2010, SKF has<br />
redeemed much of its debt without new issuance. Although a new 2015 EUR100m<br />
bond was issued in Q2 10, we consider it likely that SKF will issue new bonds in<br />
order to rebalance and diversify its funding sources.<br />
Current performance drivers<br />
Major acquisition is likely to trigger new bond issuance<br />
SKF acquired 100% of Lincoln Industrial (a leading lubrication systems company)<br />
on 28 December 2010 with a cash flow payment of SEK6.8bn and one-off charges of<br />
SEK100m during Q4 10. The acquisition was financed using existing cash (around<br />
46%) and credit facilities (around 54%). Hence the acquired business has been included<br />
in the year-end balance of SKF, while the income statement will not be affected<br />
before Q1 11.<br />
The Lincoln acquisition improves SKF’s business risk profile due to improved geographical<br />
sales and manufacturing diversification in North America and Asia within<br />
Lubrication Systems. Furthermore, SKF will gain increased exposure to the more<br />
stable lubrication tools and equipment aftermarket services. Since SKF used its 2014<br />
credit facility to finance a big part of the acquisition, we believe that SKF is likely to<br />
issue new bonds in order to refinance this funding. Furthermore, SKF has to finance<br />
DMTN bonds of SEK556m in April 2011, as well as dividend payments, working<br />
capital, etc.<br />
Operating profit reaches record high levels<br />
During 2010, SKF presented very strong profit as strong demand leads to increased<br />
manufacturing levels. In combination with cost reductions, this helped SKF to beat<br />
its record of profit and profit margins in both Q2 10 and Q3 10. SKF managed to<br />
maintain the record 14.9% operating margin in Q4 10 when adjusting for one-off<br />
charges of SEK100m. This also sparked SKF to declare a new set of financial targets.<br />
Credit metrics leave limited headroom under current rating<br />
While SKF has a history of strong cash flow, this also comes with large shareholder<br />
distributions and increased debt levels. Although Moody’s removed its negative<br />
outlook in October 2010, limited rating headroom leaves the company sensitive to<br />
event risk.<br />
During 2009, net debt increased with net debt-to-equity rising above the company’s<br />
target of 50%. Since then, leverage has come down below the target level, although<br />
headroom remains limited. Currently, the ratio is 49%. S&P also targets a net debtto-equity<br />
ratio of not significantly above 50% over the cycle for the current ‘A-’<br />
rating. After 2010, FFO to adjusted net debt was 39%, which is just below the S&P<br />
requirement of 40% over the cycle. FOCF to adjusted net debt dropped to 22%, as<br />
working capital releases started to run down during 2010.<br />
Debt maturity profile<br />
(as of 31 December 2010)<br />
SEKbn<br />
6.0<br />
5.0<br />
4.0<br />
3.0<br />
2.0<br />
1.0<br />
0.0<br />
Source: Company data and <strong>Danske</strong> Markets<br />
Sales growth decomposition (y/y)<br />
35%<br />
25%<br />
15%<br />
5%<br />
-5%<br />
-15%<br />
-25%<br />
-35%<br />
2011 2012 2013 2014 2015 2016+<br />
Q4<br />
Q3<br />
Q2<br />
Q1<br />
Q4<br />
Q3<br />
Q2<br />
Q1<br />
Q4<br />
Q3<br />
Q2<br />
Q1<br />
Q4<br />
Q3<br />
Q2<br />
Q1<br />
Q4<br />
Q3<br />
Q2<br />
Q1<br />
Q4<br />
Q3<br />
Q2<br />
Q1<br />
Q4<br />
Q3<br />
Q2<br />
Q1<br />
Q4<br />
Q3<br />
Q2<br />
Q1<br />
2003 2004 2005 2006 2007 2008 2009 2010<br />
Source: Company data, <strong>Danske</strong> Markets<br />
Sales by segments, 2010<br />
Automotive<br />
30%<br />
Source: Company data, <strong>Danske</strong> Markets<br />
Credit metrics<br />
SEKbn<br />
25<br />
20<br />
15<br />
10<br />
5<br />
0<br />
Service<br />
36%<br />
Other<br />
2%<br />
Source: Company data, <strong>Danske</strong> Markets<br />
Industrial<br />
32%<br />
2006 2007 2008 2009 2010<br />
Volume<br />
Currency<br />
Price/mix<br />
Structure<br />
Net sales<br />
5.0x<br />
4.0x<br />
3.0x<br />
2.0x<br />
1.0x<br />
0.0x<br />
Adj. net debt Equity Adj. net debt/EBITDA (rhs)<br />
109 | 13 April 2011<br />
www.danskeresearch.com
<strong>Scandi</strong> Handbook<br />
Broad industry exposure<br />
While SKF operates in a market characterised by several negative credit factors (i.e.<br />
cyclical, mature and competitive end-markets with strong bargaining power of customers<br />
and a high degree of capital intensity), these factors are mitigated by SKF’s<br />
position as a market leader and by diversification of sales.<br />
The diversification comes from both different end-markets (see chart below) and<br />
from different geographic regions. In 2010, 46% of net sales were generated in<br />
Europe, 27% in Asia/Pacific, 18% in North America, 6% in Latin America and 3% in<br />
Middle East/Africa. Although demand for SKF’s products and services largely follows<br />
general economic activity, demand is not perfectly correlated across endmarkets.<br />
This, combined with the large service business, creates an important cushion<br />
against extremely adverse demand scenarios and stabilises profitability at group<br />
level to some extent.<br />
Profitability<br />
SEKbn<br />
60<br />
18%<br />
50<br />
15%<br />
40<br />
12%<br />
30<br />
9%<br />
20<br />
6%<br />
10<br />
3%<br />
0<br />
0%<br />
2006 2007 2008 2009 2010<br />
Net sales EBITDA EBITDA margin (rhs)<br />
Source: Company data and <strong>Danske</strong> Markets<br />
Net sales by end-market customer segment, 2010<br />
Cars & light trucks, 14%<br />
Industrial distribution,<br />
25%<br />
General industry, 13%<br />
Two wheelers & electrical,<br />
Off-highway, 3%<br />
3%<br />
Railway, 4%<br />
Aerospace, 5%<br />
Heavy industry, 7%<br />
Trucks, 4%<br />
Energy, 5%<br />
Special equipment, 5%<br />
Vehicle service, 12%<br />
Source: Company data and <strong>Danske</strong> Markets<br />
Recommendation<br />
We have an overall HOLD recommendation on SKF. Existing bonds are fairly illiquid<br />
and well placed among buy-and-hold investors. We advise new investors to wait<br />
for potential new bond issuance in relation to a refinancing after the Lincoln Industrial<br />
acquisition.<br />
The 2013 bond is currently offered at an ASW level of around 28 basis points (see<br />
list of prices at the end of this book). This valuation seems in line with the current<br />
‘A-’ rating. SKF has also issued a new 2015 bond but due to the small size it is very<br />
illiquid. Hence, we have a neutral stance on the cash bonds.<br />
The 5y CDS is trading around 30bp tighter than iTraxx Europe. In our view, this<br />
level is too tight. Given limited headroom under the current rating and the potential<br />
for refinancing with new bond issuance, we recommend buying 5y protection on<br />
SKF (65bp) against iTraxx Europe (94bp).<br />
110 | 13 April 2011<br />
www.danskeresearch.com
<strong>Scandi</strong> Handbook<br />
Financial data SKF<br />
Key figures (SEKm) 2006 2007 2008 2009 2010<br />
Net Sales 53,101 58,559 63,361 56,227 61,029<br />
EBITDA (1) 8,153 9,315 9,659 5,374 10,444<br />
EBIT (1) 6,319 7,539 7,710 3,203 8,452<br />
Net interest expenses 290 220 504 220 197<br />
Net profit 4,432 4,767 4,741 1,705 5,296<br />
FFO (2) 5,598 6,752 5,895 4,925 6,767<br />
Capex 2,011 1,907 2,531 1,975 1,651<br />
EBITDA-Capex 6,142 7,408 7,128 3,399 8,793<br />
OpFCF (3) 5,291 6,106 4,800 7,770 5,979<br />
FCF (4) 1,148 -3,638 -3,459 4,397 2,278<br />
RCF 3,159 -1,731 -928 6,372 3,929<br />
Net debt (5) 3,854 8,808 9,078 5,265 9,029<br />
Adjusted net debt (6) 5,155 9,909 15,935 13,704 17,605<br />
Total capital 32,391 31,438 34,306 29,285 32,069<br />
Ratios 2006 2007 2008 2009 2010<br />
EBIT margin 11.9% 12.9% 12.2% 5.7% 13.8%<br />
Capex/net revenues 3.8% 3.3% 4.0% 3.5% 2.7%<br />
EBITDA/Net interest expenses 28.1x 42.3x 19.2x 24.4x 53.0x<br />
Net debt/EBITDA 0.5x 0.9x 0.9x 1.0x 0.9x<br />
Adjusted net debt/EBITDA 0.6x 1.1x 1.6x 2.6x 1.7x<br />
Net debt/Total capital 12% 28% 26% 18% 28%<br />
(1) Adjusted for non-recurring items. (2) Net income after tax plus depreciation and amortization, deferred tax and other non cash items. (3) CFO plus interest and<br />
taxes paid less capex. (4) OpFCF less interest paid, tax paid, and dividends. (5) Total interest-bearing debt (incl. pension provision) less cash and marketable<br />
securities. (6) Net debt adjusted for operating leases and contingent liabilities. Source: Company data, <strong>Danske</strong> Fixed Income Credit Research.<br />
Quarterly review (SEKm)<br />
Quarterly review (SEKm) Q4 09 Q1 10 Q2 10 Q3 10 Q4 10<br />
Net sales 13,887 14,446 15,709 15,465 15,409<br />
EBIT 1,004 1,702 2,239 2,309 2,202<br />
EBIT margin 7.2% 11.8% 14.3% 14.9% 14.3%<br />
Net income 505 1,070 1,451 1,425 1,350<br />
Adjusted net debt 13,374 13,571 14,685 12,285 17,233<br />
Adj. net debt/LTM EBITDA 2.0x 1.8x 1.7x 1.3x 1.5x<br />
Source: Company data, <strong>Danske</strong> Fixed Income Credit Research<br />
Divisional quarterly overview (SEKm)<br />
Q4 09 Q1 10 Q2 10 Q3 10 Q4 10<br />
Industrial Sales 4,448 4,695 4,873 4,952 4,904<br />
EBIT 238 713 909 974 902<br />
EBIT margin 5.4% 15.2% 18.7% 19.7% 18.4%<br />
Service Sales 5,069 5,093 5,635 5,637 5,664<br />
EBIT 739 647 745 803 841<br />
EBIT margin 14.6% 12.7% 13.2% 14.2% 14.8%<br />
Automotive Sales 4,110 5,230 4,850 4,528 4,491<br />
EBIT 83 374 570 470 445<br />
EBIT margin 2.0% 7.2% 11.8% 10.4% 9.9%<br />
Source: Company data, <strong>Danske</strong> Fixed Income Credit Research<br />
111 | 13 April 2011<br />
www.danskeresearch.com
<strong>Scandi</strong> Handbook<br />
Stena AB<br />
Company overview<br />
Stena AB is a Swedish holding company with diversified operations, mainly within<br />
industrial sectors (passenger and freight ferry services, shipping, offshore drilling, real<br />
estate investments, venture capital investments and financial investments). The group is<br />
organised in five divisions: Ferry operations, Drilling, Shipping, Property and Adactum<br />
(investments). The group has offices and operations in Europe, North America,<br />
South America, Asia, Australia and Africa, and employs a total of 10,236 staff (of<br />
which 45% are based in Sweden and 55% are based at international subsidiaries). The<br />
Stena AB group is privately owned by the Sten A. Olsson family, which has 100%<br />
ownership. We consider the family as long-term, stable owners with a history that dates<br />
back to 1939.<br />
Key credit considerations<br />
Favourable operational diversification<br />
Stena’s exposure to capital-intensive, cyclical industries is mitigated by its favourable<br />
operational diversification. Besides the company’s offshore drilling and diversified<br />
shipping operations (ferries, freight transportation, and crude oil transportation),<br />
Stena is exposed to low-risk real estate investments, which have stable and predictable<br />
cash flows. Through Adactum, Stena also invests in venture companies that<br />
have potential to become new business areas. Furthermore, Stena maintains a financial<br />
investment portfolio of equity and debt securities as well as other short-term<br />
investments.<br />
Stena is also well diversified geographically. In 2009, 42% of sales were derived from<br />
<strong>Scandi</strong>navia, 28% from the rest of Europe and 12% from the rest of the world. 11% of<br />
revenue is from shipping operations and is therefore non-geographic.<br />
Corporate structure and non-recourse debt<br />
Because of the holding structure, senior debt issued by Stena AB is structurally subordinated.<br />
Furthermore, most of the debt in the real estate division is secured debt. For the<br />
purpose of the indenture governing senior bonds, the real estate and investment subsidiaries<br />
are designed as unrestricted subsidiaries (with no debt limitations). As a result,<br />
any new debt taken on by unrestricted subsidiaries must be non-recourse to Stena AB<br />
and its restricted subsidiaries. Both the unrestricted divisions are financed through<br />
equity contributions with all current debt also being non-recourse.<br />
Stena AB - Corporate structure<br />
Restricted Group<br />
Ferry operations (Stena Line)<br />
Stena AB<br />
Unrestricted Group<br />
Investments (Stena Adactum)<br />
BUY<br />
Sector: General industrials;<br />
Diversified conglomerates<br />
Corporate ticker: STENA<br />
Equity ticker: 1081Z SS<br />
Market cap: N/A<br />
Ratings:<br />
S&P rating: BB+ /S<br />
Moodys rating: Ba2 /S<br />
Fitch rating: NR<br />
Analyst:<br />
Asbjørn Purup Andersen<br />
apu@danskebank.com<br />
+45 45148886<br />
Kristian Myrup Pedersen<br />
kripe@danskebank.com<br />
+45 45128519<br />
Key credit issues<br />
Strengths:<br />
• Diversified conglomerate with<br />
stable ownership.<br />
• Market leader in the majority of<br />
operational segments.<br />
• Exposure to stable and highly profitable<br />
real estate portfolio.<br />
• Good contract coverage in<br />
Drilling and RoRo segments.<br />
Challenges:<br />
• Aggressive growth strategy and<br />
investment policies.<br />
• High financial leverage and negative<br />
free operating cash flow.<br />
• Exposure to capital-intensive industrial<br />
segments.<br />
• Weak industry fundamentals in<br />
shipping and ferry operations.<br />
Source: <strong>Danske</strong> Markets<br />
Offshore drilling (Stena Drilling)<br />
Shipping (Stena Bulk, Stena<br />
RoRo, Stena Rederi, Stena<br />
Teknik and Northern Marine<br />
Management)<br />
Property/real estate (Stena<br />
Fastigheter and Stena Realty)<br />
Source: Company data and <strong>Danske</strong> Markets<br />
112 | 13 April 2011<br />
www.danskeresearch.com
<strong>Scandi</strong> Handbook<br />
Liquidity<br />
We view Stena as having adequate liquidity. After Q3 10, the company had<br />
SEK1.9bn in cash and cash equivalents, short-term investments of SEK4.0bn and<br />
SEK3.0bn in marketable securities. S&P estimates that about SEK1bn in cash is<br />
needed for ongoing operations and working capital fluctuations. Stena also has two<br />
committed credit facilities (a USD1.00bn revolving credit facility maturing in 2013<br />
and a USD0.2bn revolving credit facility maturing in 2012) with combined headroom<br />
of SEK0.4bn. Furthermore, in September 2010 Stena entered into a seven-year revolving<br />
credit facility of SEK6.6bn with a guarantee provided by the Swedish Export<br />
Association (which was unutilised as of 30 September 2010).<br />
This compares with short-term debt of SEK2.0bn and a very strong debt maturity profile.<br />
Stena also has committed capital expenditure of approximately SEK5.5bn for fleet<br />
under construction for the next 12 months and a dividend payment that we expect to be<br />
somewhat above SEK0.2bn. While Stena is also likely to carry out investments in real<br />
estate and venture companies (with a focus on oil, offshore and renewable energy<br />
sources), we note that the group divested properties for a gain of SEK10.0bn in the first<br />
nine months of 2010 and sees limited growth in the real estate segments.<br />
In March 2010, Stena issued a new 10-year bond of EUR200m and redeemed the<br />
outstanding 2013 bonds. In general, Stena has good access to capital markets and<br />
benefits from a good funding diversification of bank debt and capital market debt.<br />
Current performance drivers<br />
Diversification mitigates earnings volatility<br />
Although Stena has leading market positions in Europe, it is affected by the weak<br />
industry conditions and high competition in its ferry and shipping operations. That<br />
said, Stena was able to maintain relatively strong earnings during the economic<br />
downturn, despite cyclical exposure, and stable profit margins, despite being exposed<br />
to high operational and financial leverage.<br />
However, Stena is not out of the woods yet. During the first nine months of 2010,<br />
revenue from the Shipping division declined by 17% y/y (mainly due to lower spot<br />
freight rates and adverse currency fluctuations) and revenue from the Ferry operations<br />
declined 6% y/y (mainly due to lower freight volumes, passengers and cars).<br />
This was mitigated by the Drilling division, whose revenue increased 12% y/y in Q3<br />
10, and the Property division, whose revenue increased 8% y/y in the same period. The<br />
Drilling division benefits from strong utilisation rates (98% over the past five years)<br />
and good contract coverage. The Property division benefits from a good tenant base<br />
(with good contract coverage) and strong asset quality (reflected by 99% occupancy<br />
for residential properties and 90% for commercial properties).<br />
Financial flexibility - but no deleveraging ahead<br />
Stena has an ambitious growth strategy and, as a consequence, high capital expenditure<br />
(30-40% of sales) in capital-intensive segments has resulted in negative FOCF. Hence,<br />
on 26 October 2010, Moody’s downgraded Stena’s corporate family rating from ‘Ba1’<br />
to ‘Ba2’, but changed the outlook from negative to stable (Moody’s rates senior unsecured<br />
bonds one notch below this rating).<br />
However, this is mitigated by the company’s ability to divest assets (real estate properties,<br />
company ownership and financial investments) and the very modest dividend<br />
distributions, as most earnings are reinvested in the company. Nonetheless, we believe<br />
that rating upside is limited from the current ‘BB+’/‘Ba2’ levels as Stena is not likely to<br />
cut back on capital expenditure in order to deleverage its balance sheet.<br />
Debt maturity profile<br />
(as of 31 December 2009)<br />
SEKbn<br />
25<br />
20<br />
15<br />
10<br />
5<br />
0<br />
Source: Company data and <strong>Danske</strong> Markets<br />
Profitability<br />
SEKbn<br />
30<br />
25<br />
20<br />
15<br />
10<br />
5<br />
0<br />
2010 2011 2012-2015 2016+<br />
Source: Company data and <strong>Danske</strong> Markets<br />
Sales by segments, LTM Q3 10<br />
Source: Company data and <strong>Danske</strong> Markets<br />
Credit metrics<br />
SEKbn<br />
60<br />
50<br />
40<br />
30<br />
20<br />
10<br />
0<br />
2005 2006 2007 2008 2009<br />
Source: Company data and <strong>Danske</strong> Markets<br />
35%<br />
30%<br />
25%<br />
20%<br />
15%<br />
10%<br />
5%<br />
0%<br />
Sales EBITDA EBITDA-margin (rhs)<br />
Property<br />
9%<br />
Shipping<br />
10%<br />
Adactum<br />
18%<br />
Ferry operations<br />
34%<br />
Drilling<br />
29%<br />
2005 2006 2007 2008 2009<br />
8.0x<br />
7.0x<br />
6.0x<br />
5.0x<br />
4.0x<br />
3.0x<br />
2.0x<br />
1.0x<br />
0.0x<br />
Adj. net debt Equity Adj. net debt/EBITDA (rhs)<br />
113 | 13 April 2011<br />
www.danskeresearch.com
<strong>Scandi</strong> Handbook<br />
Recommendation<br />
We initiate coverage of Stena AB with a BUY recommendation as we see Stena as a<br />
quality high-yield name with attractive valuation relative to the credit ratings. S&P<br />
assigns the senior unsecured debt a ‘BB+’ credit rating, in line with the corporate<br />
rating, while Moody assigns a ‘Ba3’ senior unsecured rating (ie, one notch below the<br />
Moody’s corporate family rating). Although the Stena group is highly leveraged with<br />
large capital expenditure, we believe the positive diversification mitigates the financial<br />
risk to a certain extent.<br />
The cash curve is rather flat, and we prefer the 2017 bond (offered at Z-spread<br />
+357bp) relative to the 2019 and 2020 bonds (offered at Z-spread +382bp and<br />
+415bp, respectively). The 2017 bond is also trading with a positive basis of 137bp,<br />
whereas the 2019 and 2020 bonds are trading at a slightly lower positive basis of<br />
137bp and 113bp, respectively.<br />
The indentures governing all senior bonds require Stena AB to make an offer to<br />
purchase all notes outstanding at 101% of par plus accrued interest if shareholders<br />
ultimately controlled by the Olsson family do not directly or indirectly beneficially<br />
own or control at least 50% of the voting equity in Stena AB (Change of control). All<br />
of the Eurobonds are trading below this strike price. Furthermore, all of the bonds<br />
have a make-whole provision, callable at any time.<br />
The Stena AB 5y CDS is trading at a wide level (455/485bp) and we recommend<br />
selling protection against iTraxx main (see list of prices at the end of this book).<br />
114 | 13 April 2011<br />
www.danskeresearch.com
<strong>Scandi</strong> Handbook<br />
Financial data Stena AB<br />
Key figures (SEKm) 2005 2006 2007 2008 2009<br />
Net sales 19,619 22,895 21,655 26,394 27,934<br />
EBITDA 5,127 7,221 6,140 6,873 7,417<br />
EBIT 2,393 4,587 4,460 4,372 4,002<br />
Net interest expenses -69 -143 -1 2,994 1,658<br />
Net profit 2,289 4,362 3,829 1,745 2,364<br />
FFO 2,742 3,311 3,529 5,788 5,962<br />
EBITDA - Capex -25 -927 -2,175 -2,769 -1,752<br />
FOCF -2,410 -4,837 -4,786 -3,854 -3,207<br />
RCF 2,547 3,096 2,979 5,398 5,772<br />
Net debt (incl. pensions) 24,124 16,568 18,983 42,370 39,467<br />
Adjusted net debt 34,114 33,977 41,716 52,708 47,104<br />
Equity (incl. minorities) 15,263 18,749 26,386 27,454 29,183<br />
Total capital 47,417 50,441 66,152 80,895 77,727<br />
Ratios 2005 2006 2007 2008 2009<br />
EBIT margin 12% 20% 21% 17% 14%<br />
Capex/sales 26% 36% 38% 37% 33%<br />
EBITDA/net interest expenses -74.3x -50.5x -6140.0x 2.3x 4.5x<br />
Net debt/EBITDA 4.7x 2.3x 3.1x 6.2x 5.3x<br />
Adjusted net debt/EBITDA 6.7x 4.7x 6.8x 7.7x 6.4x<br />
Adjusted net debt/total capital 72% 67% 63% 65% 61%<br />
Source: Company data and <strong>Danske</strong> Fixed Income Credit Research<br />
Quarterly overview (SEKm)<br />
Q3 09 Q4 09 Q1 10 Q2 10 Q3 10<br />
Sales 7,450 6,462 5,739 7,102 7,367<br />
EBIT 1,555 735 390 1,325 1,437<br />
EBIT margin 21% 11% 7% 19% 20%<br />
Net income 1,198 194 40 676 1,151<br />
Net debt/LTM EBITDA 6.0x 6.3x 6.7x 6.7x 6.8x<br />
Source: Company data and <strong>Danske</strong> Fixed Income Credit Research<br />
Divisional quarterly overview (SEKm)<br />
Q3 09 Q4 09 Q1 10 Q2 10 Q3 10<br />
Ferry operations Sales 3,307 1,942 1,651 2,462 3,061<br />
EBIT 830 -248 -303 142 544<br />
EBIT-margin 25% -13% -18% 6% 18%<br />
Drilling Sales 1,851 1,965 1,838 1,938 2,070<br />
EBIT 747 777 564 671 632<br />
EBIT-margin 40% 40% 31% 35% 31%<br />
Shipping Sales 703 699 627 733 619<br />
EBIT -286 -203 -66 -37 -147<br />
EBIT-margin -41% -29% -11% -5% -24%<br />
Property Sales 555 640 598 594 600<br />
EBIT 318 415 308 506 514<br />
EBIT-margin 57% 65% 52% 85% 86%<br />
Adactum Sales 1,034 1,215 1,025 1,370 1,016<br />
EBIT 29 55 -29 121 33<br />
EBIT-margin 3% 5% -3% 9% 3%<br />
Source: Company data and <strong>Danske</strong> Fixed Income Credit Research<br />
115 | 13 April 2011<br />
www.danskeresearch.com
<strong>Scandi</strong> Handbook<br />
Swedish Match<br />
Company overview<br />
Swedish Match is a global leader in smokefree tobacco products and one of the largest<br />
cigar companies in the world. The company operates in three main product areas:<br />
Snus and Snuff (smokefree tobacco), Other tobacco products (mass market cigars<br />
and chewing tobacco) and Lights (matches and lighters). Swedish Match sells its<br />
products across the globe and has production in Brazil, Bulgaria, the Dominican<br />
Republic, the Netherlands, the Philippines, Sweden and the United States. The company<br />
employs a total of approximately 3,900 people (excluding 6,500 people transferred<br />
to the new subsidiary <strong>Scandi</strong>navian Tobacco Group). The ownership structure<br />
is quite fragmented with the largest shareholders being Parvus Asset Management<br />
(6.6% of votes) and Morgan Stanley Investment management (6.1% of votes).<br />
Key credit considerations<br />
Highly profitable and growing snus and snuff market<br />
Swedish Match benefits from a strong and stable cash flow. All of its divisions are<br />
very profitable, led by the Snus and snuff division (40% of 2010 sales). Besides<br />
being highly profitable, the snus market is also growing – unlike the declining cigarette<br />
market. The growth is primarily attributable to cigarette smokers looking for a<br />
healthier substitute through smokefree products. Swedish Match also enjoys considerable<br />
market shares in the two largest markets for snus and moist snuff with approximately<br />
86% of the Swedish market (leading position) and 12% of the US market<br />
(top 3 position).<br />
Regulatory setting increases geographical concentration<br />
Tobacco for oral use (except tobacco for smoking or chewing) has been banned<br />
within the European Union since 1992. This means that sales of snus is prohibited.<br />
However, Sweden was granted a permanent exemption from the ban, when the country<br />
joined the European Union in 1995. As a result, Sweden and Norway (which is<br />
not part of the European Union) are two of the largest markets for Swedish Match,<br />
besides the US. This increases concentration and limits geographical diversification.<br />
The Swedish government and the Swedish parliament oppose the ban on grounds that<br />
the ban is disproportionate and discriminatory. Furthermore, a new Tobacco Products<br />
Directive is expected at the end of 2011 as the Commission is currently reviewing it.<br />
Geographical expansion strategy with joint venture<br />
In 2009, Swedish Match established a 50/50 joint venture with Philip Morris International,<br />
named SMPM International. This joint venture seeks to explore global growth<br />
opportunities in smokeless products and snus outside <strong>Scandi</strong>navia and the US. Since its<br />
inception, the joint venture has begun tests and small launches of snus products in both<br />
Taiwan and Canada. From a credit perspective, this could improve geographical diversification<br />
of sales and hence the business risk profile of Swedish Match.<br />
Shareholder friendly financial policies<br />
Swedish Match has historically been very shareholder friendly with shareholder<br />
distributions through dividend payments and share buybacks. The company has a<br />
financial policy of paying 40-60% of earnings in dividends (subject to adjustments<br />
for larger one-off items). Furthermore, the company has a mandate of performing<br />
share repurchases for up to 10% of own shares. In addition, Swedish Match has a<br />
policy that the reported net debt/EBITA (clean) should not exceed 3x. This figure<br />
was at 2.2x for 2010. While the aggressive financial policy limits any upside rating<br />
potential, Swedish Match does have a policy of maintaining an investment grade<br />
rating and is able to scale back on share buybacks if needed.<br />
SELL<br />
Sector: Consumer staples;<br />
Tobacco<br />
Corporate ticker: SWEMAT<br />
Equity ticker: SWMA SS<br />
Market cap: SEK48.7bn<br />
Ratings:<br />
S&P rating: BBB /S<br />
Moodys rating: Baa2 /S<br />
Fitch rating: NR<br />
Analyst:<br />
Asbjørn Purup Andersen<br />
apu@danskebank.com<br />
+45 45148886<br />
Kristian Myrup Pedersen<br />
kripe@danskebank.com<br />
+45 45128519<br />
Key credit issues<br />
Strengths:<br />
• Highly profitable operations in<br />
smokefree tobacco and cigars.<br />
• Stable and strong cash generation<br />
with low capital expenditures.<br />
• Solid market positions in <strong>Scandi</strong>navia<br />
and the US.<br />
• Strong liquidity with limited<br />
debt maturities.<br />
Challenges:<br />
• Limited geographical diversification<br />
of sales.<br />
• Shareholder friendly financial policies<br />
and track-record.<br />
• Regulated markets with<br />
risks of rising taxation.<br />
• LBO risk from fragmented ownership<br />
profile.<br />
Source: <strong>Danske</strong> Markets<br />
116 | 13 April 2011<br />
www.danskeresearch.com
<strong>Scandi</strong> Handbook<br />
Liquidity<br />
We view Swedish Match as having a strong liquidity profile. On top of a stable and<br />
strong cash flow, the company had liquid funds of SEK3.3bn at the end of 2010.<br />
Although liquidity is held de-centrally, it is readily available for debt reductions.<br />
Swedish Match also has an unused EUR160m (SEK1.4bn) committed revolving<br />
credit facility that will mature in January 2013. According to S&P, the company’s<br />
debt facilities have no financial covenants.<br />
This compares with very modest debt maturities in 2011 of SEK0.5bn and a strong<br />
back-end loaded debt maturity profile. During Q3 10, the company extended its debt<br />
maturities by issuing new bonds and repaying old bonds. However, in spite of low<br />
capital expenditure levels, Swedish Match has a track record of constrained discretionary<br />
cash flow as the total debt servicing (dividends and share buybacks) tends to<br />
be in the range of SEK3.0bn to 4.0bn.<br />
Current performance drivers<br />
Majority of cigar and pipe tobacco operations seceded<br />
In October 2010 Swedish Match effectively completed its transaction with <strong>Scandi</strong>navian<br />
Tobacco Group, thereby creating a new <strong>Scandi</strong>navian Tobacco Group (STG). The<br />
new combined company is the largest manufacturer of cigars in the world and the leading<br />
pipe tobacco company.<br />
In the transaction, Swedish Match transferred all of its cigar and pipe tobacco business<br />
(except for US mass market cigars and the minority stake in the German cigar company,<br />
Arnold André). <strong>Scandi</strong>navian Tobacco Group transferred all of its tobacco business<br />
(cigars, pipe tobacco, and fine cut tobacco) into the new company. The new <strong>Scandi</strong>navian<br />
Tobacco Group has sales in 16 countries and production in eight.<br />
Swedish Match AB holds 49% of the shares and Skandinavisk Holding A/S holds the<br />
remaining 51%. Swedish Match has been compensated EUR30m to account for the<br />
shareholder disparity and relative differences in enterprise values.<br />
Credit metrics boosted by one-offs, may come under pressure in 2011<br />
During Q4 10, earnings were positively affected by a number of larger one-off items.<br />
This includes a gain from pension settlements of SEK59m due to transfer of pension<br />
obligations, a capital gain of SEK585m (with no cash effect) due to revaluation of the<br />
Swedish Match assets transferred to the new <strong>Scandi</strong>navian Tobacco Group. Swedish<br />
Match also received SEK1,560m of loan repayments from STG (including the<br />
EUR30m compensation for ownership differences).<br />
These one-off items helped to boost earnings and credit metrics. However, we expect<br />
metrics to come under more under pressure going forward, while the restructuring<br />
process is in effect until STG starts to pay dividends to its owners. Swedish Match’s<br />
share of the Q4 10 net loss (mainly stemming from restructuring charges and transactions<br />
costs of EUR175m) in <strong>Scandi</strong>navian Tobacco Group amounted to EUR60m.<br />
Synergy effects are expected to be above EUR25m and should become visible in H1<br />
11. Final purchase price adjustments are also expected to be settled in H1 11.<br />
Outlook for 2011<br />
Swedish Match continues its growth strategy in 2011 and will increase investments<br />
in Swedish snus in new markets (the US and other markets via SWPM International).<br />
Swedish Match expects the snus and snuff markets to continue to grow in both <strong>Scandi</strong>navia<br />
and the US. On the other hand, the company expects the declining trend of<br />
chewing tobacco to continue, while US mass market cigars are expected to continue<br />
positive momentum. Furthermore, Swedish Match intends to continue to distribute<br />
excess cash to shareholders in 2011.<br />
Debt maturity profile<br />
(as of 31 December 2010)<br />
SEKbn<br />
3.5<br />
3.0<br />
2.5<br />
2.0<br />
1.5<br />
1.0<br />
0.5<br />
0.0<br />
Source: Company data and <strong>Danske</strong> Markets<br />
Profitability<br />
SEKbn<br />
20<br />
15<br />
10<br />
5<br />
0<br />
2011 2012 2013 2014 2015 2016+<br />
2006 2007 2008 2009 2010<br />
Source: Company data and <strong>Danske</strong> Markets<br />
Sales by segments, 2010<br />
Source: Company data and <strong>Danske</strong> Markets<br />
Credit metrics<br />
Source: Company data and <strong>Danske</strong> Markets<br />
40%<br />
30%<br />
20%<br />
10%<br />
0%<br />
Sales EBITDA EBITDA-margin (rhs)<br />
Other operations, 25%<br />
SEKbn<br />
10.0<br />
8.0<br />
6.0<br />
4.0<br />
2.0<br />
0.0<br />
-2.0<br />
Lights, 13%<br />
Other tobacco products, 22%<br />
2006 2007 2008 2009 2010<br />
Snus and snuff, 40%<br />
5.0x<br />
4.0x<br />
3.0x<br />
2.0x<br />
1.0x<br />
0.0x<br />
-1.0x<br />
Adj. net debt Equity Adj. net debt/EBITDA (rhs)<br />
117 | 13 April 2011<br />
www.danskeresearch.com
<strong>Scandi</strong> Handbook<br />
Recommendation<br />
We initiate coverage of Swedish Match with a SELL recommendation. Although the<br />
company benefits from stable and very strong cash flow with high margins, this is<br />
mitigated by generous shareholder remuneration which constrains discretionary cash<br />
flow. Swedish Match has also benefitted from one-off earnings (i.e. disposal proceeds)<br />
which has boosted credit metrics. Going forward, metrics could come under<br />
pressure as Swedish Match has somewhat less cash flow and will be more dependent<br />
on upstream dividends from <strong>Scandi</strong>navian Tobacco Group. Prior to the transaction,<br />
Swedish Match had a direct claim on cash flow with no dilution of control or subordination.<br />
However, we note that legal risks are limited.<br />
Cash bonds are trading at very tight levels, which price in 1-2 notch rating upgrades.<br />
The SWEMAT 2013 bonds (offered around ASW +47bp) are rather illiquid following<br />
the tender offer in Q3 10. The SWEMAT 2017 bonds (offered at ASW +84bp)<br />
are more liquid. We believe that rating upside is fairly limited and see limited potential<br />
for spread compression, going forward. Although Swedish Match is subject to<br />
LBO risk from its fragmented ownership structure, we do not expect bonds to be<br />
significantly affected by this. Both SWEMAT 2013 and SWEMAT 2017 have<br />
Change of Control clauses that give investors the right to put the bonds at par in the<br />
event of an LBO (the bonds are trading at cash prices of 103.4 and 97.2, respectively).<br />
The CDS on the other hand could come under pressure in such a scenario.<br />
With a very tight 5y CDS (65/70bp), we recommend buying protection on Swedish<br />
Match against iTraxx Europe (see list of instrument prices at the end of this book).<br />
118 | 13 April 2011<br />
www.danskeresearch.com
<strong>Scandi</strong> Handbook<br />
Financial data - Swedish Match<br />
Key figures (SEKm) 2006 2007 2008 2009 2010<br />
Net sales 12,274 11,970 12,611 14,204 13,606<br />
EBITDA 3,491 3,234 3,294 3,887 4,458<br />
EBIT 3,046 2,799 2,874 3,419 4,170<br />
Net interest expenses 108 338 441 443 563<br />
Net profit 2,336 2,054 2,261 3,148 2,958<br />
FFO 1,551 2,372 2,158 2,978 2,576<br />
EBITDA - Capex 3,187 2,693 2,975 3,416 4,147<br />
FOCF 1,247 1,831 1,839 2,507 2,265<br />
RCF -2,750 -867 276 -644 -1,527<br />
Net debt (incl. pensions) 6,318 7,887 8,787 8,015 7,508<br />
Adjusted net debt 5,303 7,225 8,884 8,123 7,666<br />
Equity (incl. minorities) 2,040 724 1,381 903 -482<br />
Total capital 11,456 12,055 13,380 11,458 10,302<br />
Ratios 2006 2007 2008 2009 2010<br />
EBIT margin 25% 23% 23% 24% 31%<br />
Capex/sales 2% 5% 3% 3% 2%<br />
EBITDA/net interest expenses 32x 10x 7x 9x 8x<br />
Net debt/EBITDA 1.8x 2.4x 2.7x 2.1x 1.7x<br />
Adjusted net debt/EBITDA 1.5x 2.2x 2.7x 2.1x 1.7x<br />
Adjusted net debt/total capital 46% 60% 66% 71% 74%<br />
Source: Company data and <strong>Danske</strong> Fixed Income Credit Research<br />
Quarterly overview (SEKm)<br />
Q4 09 Q1 10 Q2 10 Q3 10 Q4 10<br />
Sales 3,545 3,282 3,701 3,823 2,801<br />
EBIT 850 755 945 1,049 1,421<br />
EBIT margin 24% 23% 26% 27% 51%<br />
Net income 596 518 636 729 1,074<br />
Net debt/LTM EBITDA 2.1x 2.1x 2.2x 2.2x 1.7x<br />
Source: Company data and <strong>Danske</strong> Fixed Income Credit Reseach<br />
Divisional quarterly overview (SEKm)<br />
Q4 09 Q1 10 Q2 10 Q3 10 Q4 10<br />
Snus and snuff Sales 1,101 1,054 1,116 1,174 1,178<br />
EBIT 523 434 487 592 567<br />
EBIT-margin 48% 41% 44% 50% 48%<br />
Other tobacco Sales 456 588 664 631 557<br />
products EBIT 136 204 270 259 208<br />
EBIT-margin 30% 35% 41% 41% 37%<br />
Lights Sales 373 351 347 352 379<br />
EBIT 100 66 68 58 87<br />
EBIT-margin 27% 19% 20% 16% 23%<br />
Other operations Sales 690 615 722 806 687<br />
EBIT -18 -48 -32 -35 -26<br />
EBIT-margin -3% -8% -4% -4% -4%<br />
Source: Comany data and <strong>Danske</strong> Fixed Income Credit Research<br />
119 | 13 April 2011<br />
www.danskeresearch.com
<strong>Scandi</strong> Handbook<br />
Vasakronan<br />
Company overview<br />
Vasakronan is the largest property company in Sweden with a property portfolio<br />
consisting of 222 properties (2.8m square meters) worth about SEK78bn at the end of<br />
2010. The portfolio is concentrated in Sweden’s larger cities with Stockholm accounting<br />
for 69% of rental income, Göteborg 16% and the Öresund region 9%. At<br />
the end of 2010 offices accounted for 81% of rental income and retail 14%, whereas<br />
residential property accounted for a very modest 1% of rental income.<br />
The current structure of the company was formed after AP Fastigheter (controlled by<br />
the state-owned AP funds), on 3 July 2008, bought all the shares of Vasakronan from<br />
the Swedish government. The merged corporation changed its name to Vasakronan<br />
and became one of the largest property management companies in Europe. Vasakronan<br />
currently employs 364 people. It is the strategy of the company to focus on<br />
growth markets in Sweden (Stockholm, Gothenburg and the Malmö/Öresund region)<br />
and own properties that provide a stable return over time.<br />
Key credit considerations<br />
Strong ownership<br />
The old Vasakronan was owned by the Swedish government, but in 2008 it was sold<br />
off to the state-owned pension funds AP1, AP2, AP3 and AP4. Thus, the state ownership<br />
is now indirect and the company does not benefit from explicit state guarantees,<br />
although all loan agreements have ‘change of control’ covenants. The AP funds<br />
are long-term investors and we therefore consider it likely that they will stand behind<br />
Vasakronan in difficult times and, for example, provide more capital in case the need<br />
should arise. Each of the funds owns 25% of Vasakronan through the holding company,<br />
Vasakronan Holding AB.<br />
Heavy commercial real estate exposure, but diversified client base<br />
Commercial real estate currently makes up for the large majority of Vasakronan’s<br />
rental income, with residential real estate now accounting for a modest 1%. We therefore<br />
view the property portfolio as quite concentrated in a market that is rather cyclical.<br />
In 2010, Vasakronan divested 8,000 residential apartments situated in Stockholm,<br />
Uppsala and Göteborg to the AP4 fund. This increased the proportion of commercial<br />
rental income from 92% to 97%. However, stemming from its high-quality urban<br />
portfolio, Vasakronan has a rather low vacancy rate which has even been improving<br />
during the economic downturn. Vasakronan’s client base is quite diverse and 26% of<br />
the tenants are from the public sector, which adds stability. In 2010, the 10 largest<br />
tenants accounted for 19% of the rental income. The single-largest tenant is Swedish<br />
bank SEB, which accounts for 3% of the rental income.<br />
Contract maturities provide good earnings visibility<br />
The commercial real estate portfolio of Vasakronan has an average contract period of<br />
4.6 years and 17% of the commercial real estate contracts are up for renegotiation<br />
before the end of 2011. Between 10-15% of the contract portfolio is renegotiated<br />
annually, so concentration risk is rather low. Furthermore, 49% of the commercial<br />
contracts have terms beyond 2013. Short-term visibility is therefore relatively good<br />
with stable revenues.<br />
Indicative credit rating of ‘BBB+’<br />
As Vasakronan can be classified as a GRE, we apply Standard & Poor’s ‘Enhanced<br />
Methodology And Assumptions For Rating Government Related Entities’. We view<br />
Vasakronan’s senior unsecured rating as a ‘BBB+’, based on a standalone rating of<br />
‘BBB’ and the Swedish government’s local currency rating of ‘AAA’. Thus the strong<br />
ownership justifies a one-notch uplift.<br />
HOLD<br />
Sector: Real estate; Property<br />
management<br />
Corporate ticker: FASTIG<br />
Equity ticker: 1276Z SS<br />
Market cap: Not listed<br />
Ratings:<br />
S&P rating: NR<br />
Moodys rating: NR<br />
Fitch rating: NR<br />
Analyst:<br />
Louis Landeman<br />
louis.landeman@danskebank.se<br />
+46 8 5688 0524<br />
Asbjørn Purup Andersen<br />
asbjorn.andersen@danskebank.com<br />
+45 45148886<br />
Key credit issues<br />
Strengths:<br />
• High-quality urban property portfolio<br />
with low vacancy rates.<br />
• Strong ownership from government<br />
pension funds.<br />
• Diversified client base with large<br />
proportion of public sector.<br />
Challenges:<br />
• Late cyclical and volatile real estate<br />
market exposure.<br />
• Very high concentration in commercial<br />
properties.<br />
• High interest rate sensitivity from<br />
short-term funding strategy.<br />
Source: <strong>Danske</strong> Markets<br />
120 | 13 April 2011<br />
www.danskeresearch.com
<strong>Scandi</strong> Handbook<br />
Liquidity<br />
Vasakronan aims to have a diverse funding base and the company relies both on bank<br />
loans as well as the capital markets (bonds and certificates). The bank loans as well<br />
as the MTN programme contain a ‘change of control’ clause that will be triggered if<br />
at least 51% of the shares are not owned directly or indirectly by the AP1-AP4 funds.<br />
Vasakronan has recently increased its use of secured bank loans, which increases<br />
structural subordination risk, but we note that the company has a financial policy of<br />
funding a maximum of 20% of assets with secured loans (currently constituting 15%<br />
of assets and 27% of funding).<br />
We consider Vasakronan’s liquidity as adequate but somewhat tight as the company<br />
has a high share of short-term financing, and as a large share of the back-up facilities<br />
are renegotiated annually. Partly due to a high amount of commercial paper funding<br />
(SEK5.5bn, corresponding to 12% of total debt), Vasakronan’s debt maturity profile<br />
has a relatively high mix of short-term funding. Short-term debt constituted 31% of<br />
funding at the end of 2010, compared to a policy of a maximum of 40%. Vasakronan<br />
had committed credit facilities of SEK15.0bn as a backstop at the end of 2010, with<br />
credit facilities and liquid funds combined totalling 120% of short-term debt. However,<br />
the vast majority (93%) of the credit facilities are renegotiated annually. At the<br />
end of 2010, the average loan maturity was 2.4 years. Vasakronan has a policy of<br />
maintaining an average minimum loan tenor of 2 years.<br />
Current performance drivers<br />
Property market values indicate a recovering real estate market<br />
Following five consecutive quarters of unrealised losses in the property portfolio,<br />
valuations have increased throughout 2010. This trend continued in Q4 10 with an<br />
increase of SEK832m. This was mainly attributable to a lower required rate of return<br />
but higher rents also contributed. While the largest increase in property value was in<br />
Gothenburg with 10.0% y/y, Stockholm had the greatest contribution to the rise in the<br />
total portfolio due to the large concentration of properties located in Stockholm in the<br />
overall portfolio. Although Vasakronan has already proved quite resilient to the economic<br />
downturn, the current strong macro-economic improvement in Sweden is a<br />
positive signal, going forward. The more favourable economic climate has also meant<br />
that the occupancy rate in Vasakronan’s property portfolio has gradually increased. At<br />
the end of 2010, the occupancy rate was 92.8% (end 2009: 91.9%). In terms of sensitivity<br />
to changing rent levels, Vasakronan calculates (as of end 2010) that a 1% change in<br />
rental income will cause an income change of SEK55m, whereas a 1% change in the<br />
vacancy rate will change income by SEK66m.<br />
Funding costs are currently low but risk of higher rates going forward<br />
Vasakronan has taken advantage of the low interest rates and favourable funding conditions<br />
to raise financing on attractive terms, both in the bank market and the bond market.<br />
As a result, Vasakronan’s average funding rate at the end of 2010 was a low 3.3%<br />
with a refinancing rate for the corresponding loan portfolio of 2.6%. Vasakronan’s<br />
relatively high proportion of short-term debt has lowered the company’s funding cost<br />
and thereby supported funds from operations. At the same time, this means that the<br />
company’s earnings have a certain interest rate sensitivity. The average fixed interest<br />
period was 1.7 years at the end of 2010 and some 64% of Vasakronan’s debt had interest<br />
rate fixings under 1 year. This relatively high interest rate sensitivity is mitigated by<br />
Vasakronan’s policy of maintaining a conservative balance sheet structure with a strong<br />
interest rate coverage. In Q4 2010 the company’s reported interest coverage ratio improved<br />
to 2.9x (2009: 2.8x). This can be compared to Vasakronan’s own financial<br />
policy of maintaining an interest coverage ratio of at least 1.9x. Since Vasakronan also<br />
has good access to diverse funding sources and as short-term debt is covered by liquid<br />
funds and committed facilities, we view the company’s financial profile as satisfactory.<br />
Debt maturity profile<br />
(as of 31 December 2010)<br />
SEK m<br />
16 000<br />
14 000<br />
12 000<br />
10 000<br />
8 000<br />
6 000<br />
4 000<br />
2 000<br />
-<br />
Source: Company data and <strong>Danske</strong> Markets<br />
Profitability<br />
SEKbn<br />
6,0<br />
5,0<br />
4,0<br />
3,0<br />
2,0<br />
1,0<br />
0,0<br />
Source: Company data and <strong>Danske</strong> Markets<br />
Rental income by segments, 2010<br />
Source: Company data and <strong>Danske</strong> Markets<br />
Credit metrics<br />
0-1 1-2 2-3 3-4 4-5 5+<br />
2007 2008 2009 2010<br />
Source: Company data and <strong>Danske</strong> Markets<br />
90%<br />
75%<br />
60%<br />
45%<br />
30%<br />
15%<br />
0%<br />
year<br />
Rent income EBITDA EBITDA margin (rhs)<br />
Residential<br />
property<br />
1%<br />
Retailers<br />
14%<br />
SEKbn<br />
50<br />
40<br />
30<br />
20<br />
10<br />
0<br />
Other<br />
4%<br />
Offices<br />
81%<br />
2007 2008 2009 2010<br />
20x<br />
16x<br />
12x<br />
8x<br />
4x<br />
0x<br />
Net debt Equity Net debt/EBITDA (rhs)<br />
121 | 13 April 2011<br />
www.danskeresearch.com
<strong>Scandi</strong> Handbook<br />
<strong>Danske</strong> Markets expects the Riksbank to continue to hike rates briskly throughout<br />
2011. While Vasakronan currently has headroom for interest rate hikes from the current<br />
low levels, signs of an uptake in Swedish short-term interest rates – e.g. on the back of<br />
higher inflation expectations, and the risk of swifter hikes than expected – would be<br />
negative for the company (and other property companies).<br />
Ownership structure and GRE link<br />
Before the divestment and merger with AP Fastigheter on 3 July 2008, Vasakronan<br />
was a state-owned company with direct ownership by the Swedish government. After<br />
the merger, ownership of the new Vasakronan became equally shared by the first,<br />
second, third, and fourth Swedish National Pension (AP) funds via the Vasakronan<br />
Holding company. The four AP funds are government entities and are reviewed by<br />
the Swedish Ministry of Finance. Hence, Vasakronan can be classified as a government-related<br />
entity (GRE) as the Swedish government still yields some indirect influence<br />
on the company in spite of its autonomy.<br />
The ownership structure between Vasakronan and the AP funds is linked by the<br />
holding company, Vasakronan Holding AB. In our view, this link principally serves<br />
to utilise corporate taxation accounting rules. This is also underlined by the fact that<br />
Vasakronan AB and Vasakronan Holding AB share the same board of directors.<br />
Although Vasakronan does not benefit from an explicit state guarantee, the fact that<br />
the company is essentially a wholly owned subsidiary of the state-owned AP funds is<br />
significant for credit investors. Given that the AP funds are long-term investors<br />
(since the original company was founded in 1988), we consider it likely that they<br />
would stand behind Vasakronan in difficult times and, for instance, participate in a<br />
capital increase if the need arises.<br />
Ownership structure and GRE link<br />
Swedish government<br />
AP1 AP2 AP3 AP4<br />
25% 25% 25% 25%<br />
Vasakronan Holding AB<br />
100%<br />
Vasakronan AB<br />
Source: Company data and <strong>Danske</strong> Markets<br />
The ownership commitment is further strengthened by the ‘change of control’<br />
clauses of its bank loans and the MTN programme (while this is positive for bondholders,<br />
such covenants do not influence the company’s senior unsecured rating).<br />
These covenants will be triggered if at least 51% of the shares are not owned directly<br />
or indirectly by the AP1-AP4 funds and will give the investor the right (but not the<br />
obligation) to sell the bonds back to Vasakronan at par plus accrued interest.<br />
Recommendation<br />
We have an overall HOLD recommendation on Vasakronan. The company currently<br />
has no outstanding Eurobonds. However, management has shown interest in diversifying<br />
bond issuance away from the concentration in Swedish kronor (SEK) into other<br />
currencies. This was underlined as Vasakronan initiated an MTN programme denominated<br />
in Norwegian kroner (NOK) during H1 10. With a high funding requirement,<br />
we consider that Vasakronan could be an interesting potential candidate for<br />
issuing Eurobonds.<br />
The signs of increasing rental levels and improving property valuations are positive<br />
signals, going forward. This should also be supported by the current strong macroeconomic<br />
situation in Sweden. At the same time, the improving macroeconomic conditions<br />
also mean that Vasakronan faces the risk of rising interest rates. Considering<br />
Vasakronan’s strong balance sheet and solid ownership situation, we see this risk as<br />
clearly manageable for the company.<br />
122 | 13 April 2011<br />
www.danskeresearch.com
<strong>Scandi</strong> Handbook<br />
Financial data - Vasakronan<br />
P&L (SEKm) 2008 2009 2010<br />
Rental income 3937 5865 5508<br />
Operating costs -1339 -2058 -1802<br />
Operating income 2598 3807 3706<br />
Other income 31 -71 -11<br />
Administration expenses -160 -171 -108<br />
EBITDA 2469 3565 3587<br />
Realised value changes in property portfolio -19 192<br />
Unrealised value changes in property portfolio -2560 -4369 4029<br />
EBIT -110 -612 7,616<br />
Net interest expenses & derivatives -1426 -1257 -1171<br />
Pre-tax profit -1,536 -1,869 6,445<br />
Tax 1,133 520 -1,644<br />
Net profit -433 -1,354 5,303<br />
Balance sheet 2008 2009 2010<br />
Tangible assets 74,301 71,842 77,633<br />
Financial assets 807 975 726<br />
Total non-current assets 78,578 75,251 80,778<br />
Cash and cash equivalents 2,238 290 2,445<br />
Other current assets 776 1,119 943<br />
Total current assets 3,014 1,409 3,388<br />
Total assets 81,592 76,660 84,166<br />
Long term interest bearing debt 31,356 31,625 31,992<br />
Other long term liabilities 8,910 7,385 7,261<br />
Long-term liabilities 40,266 39,010 39,253<br />
Short term interest bearing debt 10,387 8,814 14,498<br />
Other short term liabilities 3,651 4,073 3,718<br />
Short term liabilities 14,038 12,887 18,216<br />
Total liabilities 54,304 51,897 57,469<br />
Shareholders equity 27,288 24,763 26,697<br />
Total liabilities and shareholders equity 81,592 76,660 84,166<br />
Cash flow 2008 2009 2010<br />
FFO 1373 2101 2339<br />
Changes in working capital 269 -99 203<br />
Operating cash flow 1642 2002 2542<br />
Capex -1,815 -3,069 -2,066<br />
Acquisitions & disposals -19,658 1,649 -216<br />
Cash flow after investments -19,831 582 260<br />
Dividends paid -5,000 -1,073 -4,156<br />
Debt financing 13,034 -1,457 6,051<br />
Shareholder contribution 14,000<br />
Cash flow from financing activities 22,034 -2,530 1,895<br />
Cash flow during the period 2,203 -1,948 2,155<br />
Key ratios 2008 2009 2010<br />
Total interest bearing debt 41,743 40,439 46,490<br />
Net debt 39,505 40,149 44,045<br />
Total capital 69,031 65,202 73,187<br />
EBITDA-margin 62.7% 60.8% 65.1%<br />
Solidity 33.4% 32.3% 31.7%<br />
ROAE -1.9% -5.2% 20.6%<br />
Gearing 145% 162% 165%<br />
EBITDA/net interest exp 2.2 2.7 2.7<br />
LTM FFO/net debt 3% 5% 5%<br />
Net debt/LTM EBITDA 16.0 11.3 12.3<br />
Vacancy rate, % 8% 9% 7%<br />
Source: Company data and <strong>Danske</strong> Fixed Income Credit Research<br />
123 | 13 April 2011<br />
www.danskeresearch.com
<strong>Scandi</strong> Handbook<br />
Volvo AB<br />
Company overview<br />
Established in 1927, Volvo is the largest industrial group in the Nordic region and has<br />
more than 90,000 employees worldwide. The company has a leading market position<br />
worldwide in heavy trucks (accounting for 65% of sales in 2010), construction equipment<br />
(21%), buses (8%) as well as marine, aircraft and industrial power equipment.<br />
Volvo also provides significant aftermarket and financial services. The sectors in which<br />
it operates are capital intensive, competitive and highly cyclical. In 1999, it sold its carmaking<br />
operations to Ford for USD6.45bn. It acquired Renault V.I. and Mack Trucks<br />
from Renault in 2001 in exchange for a stake in Volvo. Following the large acquisitions<br />
of Nissan Diesel, Lingong and Ingersoll Rand’s road development division in 2007, as<br />
well as a joint venture with Eicher Motors in 2008, Volvo has established a significant<br />
presence in Asia. The largest shareholder is Renault with 6.8% of the capital and 17.5%<br />
of the votes, followed by Industrivärden with 4.6% of the capital and 11.1% of the<br />
votes.<br />
Key credit considerations<br />
Market-leading positions in highly cyclical industries<br />
Volvo’s strong position as the world’s second-largest truck manufacturer (behind<br />
Daimler AG) is complemented by highly volatile operations in construction equipment,<br />
as well as relatively smaller activities in buses, marine, aircraft and industrial power<br />
equipment. The demand for heavy trucks is strongly correlated with the level of overall<br />
economic and industrial activity and the introduction of new emission standards. Volvo<br />
operates in highly cyclical, capital-intensive and competitive industries. This is mitigated<br />
by strong geographical diversification, critical mass that creates economics of<br />
scale, market-leading innovations and an up-to-date product line. Furthermore, an<br />
increasing proportion of aftermarket and financial services is credit-positive as the<br />
former is characterised by lower risk and higher margins while the latter has rating<br />
dependency. Hence, Volvo has an incentive to preserve a conservative capital structure<br />
to facilitate attractive financing conditions for customers.<br />
Large acquisitions increase geographical diversification<br />
Following the large acquisitions of Nissan Diesel, Lingong and Ingersoll Rand’s road<br />
development division in 2007, as well as an Indian joint venture with Eicher Motors<br />
in 2008, Volvo has established a significant presence in Asia. This strong geographical<br />
diversification is credit-positive, as it reduces specific risks related to volatile<br />
demand and new regulation (e.g. new emission standards) across different regions. In<br />
2010, Europe accounted for 39% of net sales, followed by Asia, North America and<br />
South America with 25%, 18% and 11%, respectively.<br />
Lags Scania on profitability and operating efficiency<br />
Volvo lags its peer Scania on profitability. This is partly due to Scania’s market-leading<br />
operational efficiency, component commonality and synchronisation of engine platforms.<br />
In 2010 Volvo’s operating margin was 6.8%, compared with Scania’s 16.3%.<br />
Significant operating headwinds triggered rating action in 2009-2010<br />
Despite new financial targets in 2006 and large debt-financed acquisitions and shareholder<br />
distributions in 2006-07, Volvo entered the current brutal downturn with a<br />
somewhat conservative capital structure and significant financial flexibility.<br />
BUY<br />
Sector: Industrials; Machinery<br />
Corporate ticker: VLVY<br />
Equity ticker: VOLVB SS<br />
Market cap: SEK232.3bn<br />
Ratings:<br />
S&P rating: BBB- /S<br />
Moodys rating: Baa2 /S<br />
Fitch rating: BBB- /PO<br />
Analyst:<br />
Asbjørn Purup Andersen<br />
apu@danskebank.com<br />
+45 45148886<br />
Kristian Myrup Pedersen<br />
kripe@danskebank.com<br />
+45 45128519<br />
Key credit issues<br />
Strengths:<br />
• Leading global positions in trucks,<br />
buses, construction equipment.<br />
• Very favourable geographical diversification<br />
of revenue.<br />
• Solid liquidity position and longdated<br />
debt maturities.<br />
Challenges:<br />
• High degree of cyclicality makes<br />
sales and earnings volatile.<br />
• High operational leverage and<br />
capital-intensive production.<br />
• Exposure to mature and competitive<br />
end markets.<br />
Source: <strong>Danske</strong> Markets<br />
However, Moody’s downgraded Volvo to ‘Baa1’ in February 2009 and to ‘Baa2’ in<br />
July 2009. Both S&P and Fitch downgraded the company from ‘A-’ to ‘BBB+’ in<br />
April 2009 and to ‘BBB’ around August 2009 and ‘BBB-’ in February 2010. However,<br />
we think that rating upgrades are likely following a very strong recovery in<br />
2010.<br />
124 | 13 April 2011<br />
www.danskeresearch.com
<strong>Scandi</strong> Handbook<br />
Liquidity<br />
Volvo’s main credit facilities include a USD1.8bn committed credit line due in 2013<br />
and a EUR1.45bn credit line committed until December 2011. According to S&P, the<br />
facilities (equivalent to a total of SEK35.3bn) are not subject to financial covenants<br />
or rating triggers. After 2010, the company had cash and marketable securities<br />
amounting to SEK37.4bn in the industrial operations. This compares with around<br />
SEK12.8bn of industrial debt maturing during the next 12 months. During the first<br />
part of 2009, Volvo raised a significant amount of capital, both through bonds (EUR,<br />
USD and SEK-denominated) and various transactions with banks. This demonstrates<br />
resilient and stable access to the public markets, even during turbulent times. We<br />
view the industrial operations as largely self-funding in the next few years.<br />
Of the group interest-bearing liabilities amounting to SEK124bn in 2010, around<br />
SEK64.3bn relates to the Customer Finance division. The customer financing portfolio<br />
amortises in accordance with debt maturities and the portfolio only includes customer<br />
credit risk while currency, interest rate and liquidity risk are fully matched.<br />
Hence, the Customer Finance division only needs to obtain new financing related to<br />
new truck sales. The write-off ratio was 1.65% in 2010.<br />
Current performance drivers<br />
Extraordinary recovery after deep downturn<br />
During 2009, markets remained difficult for Volvo with continuing sluggish demand.<br />
Net sales plunged and operating margins turned negative. However, this dramatic<br />
decline was followed by an equally spectacular recovery and Volvo reported a record-high<br />
operating margin of 7.7% for a third quarter. In fact, during Q4 10 Volvo<br />
and subcontractors experienced bottlenecks due to large increases in production.<br />
Volvo expects this to gradually improve, and we believe that operational leverage<br />
should continue to support profits.<br />
North America expected to see very strong demand in 2011<br />
While the turnaround was particularly fuelled by growth in emerging markets (which<br />
now account for around half of group sales), North America demand is starting to<br />
pick up, with strong order intake. In March 2011, Volvo stated that it would ramp up<br />
production in North America due to rising demand. Volvo forecasts the North<br />
American heavy truck market to expand by 55% in 2011. The European and Japanese<br />
markets are expected to grow 23% and 10%, respectively, in 2011.<br />
The pick-up in North American growth, driven by replacement demand of an ageing<br />
truck fleet (associated with higher maintenance and repair costs), is positive for<br />
Volvo. The European market, on the other hand, has a relatively young fleet with low<br />
replacement demand and overcapacity in the transport sector. Relative to competitors<br />
more reliant on the European truck markets (e.g. Scania), this will benefit Volvo.<br />
Credit metrics are starting to look strong for rating<br />
In Q4 10, Volvo reduced leverage at an unprecedented rate due to strong cash flow.<br />
Hence, the company became compliant with its 40% leverage target at 37.4% of<br />
equity (industrial operations financial debt, including pension liabilities). When adding<br />
operating leases and contingent liabilities, the total adjusted leverage is 56.5%.<br />
FFO/adjusted net debt is now around 65% and FOCF/adjusted net debt 49%. One of<br />
S&P’s requirements for a credit rating upgrade is a sustained FFO/adjusted net debt<br />
ratio of above 35% and we believe a credit rating change should be on the cards.<br />
We expect Volvo to remain focused on its credit rating, since this is a competitive<br />
factor for its captive financing and Volvo’s credit rating is below peers such as<br />
Scania (‘A-’/NR), Paccar (‘A+’/‘A1’) and MAN (‘BBB+’/‘A3’).<br />
Debt maturity profile*<br />
(as of 31 December 2010)<br />
SEKbn<br />
16<br />
14<br />
12<br />
10<br />
8<br />
6<br />
4<br />
2<br />
0<br />
Source: Company data, <strong>Danske</strong> Markets<br />
*Industrial operations, excl. pensions<br />
Profitability<br />
SEKbn<br />
300<br />
250<br />
200<br />
150<br />
100<br />
50<br />
0<br />
'11 '12 '13 '14 '15 '16 '17<br />
Source: Company data, <strong>Danske</strong> Markets<br />
Sales by segments, 2010<br />
Source: Company data, <strong>Danske</strong> Markets<br />
Credit metrics<br />
SEKbn<br />
100<br />
2006 2007 2008 2009 2010<br />
Source: Company data, <strong>Danske</strong> Markets<br />
15%<br />
12%<br />
9%<br />
6%<br />
3%<br />
0%<br />
-3%<br />
Net sales EBITDA EBITDA margin (rhs)<br />
Volvo Penta<br />
3% Volvo Aero<br />
3%<br />
Construction<br />
Equipment<br />
21%<br />
75<br />
50<br />
25<br />
0<br />
-25<br />
Buses<br />
8%<br />
2006 2007 2008 2009 2010<br />
Trucks<br />
65%<br />
4.0x<br />
3.0x<br />
2.0x<br />
1.0x<br />
0.0x<br />
-1.0x<br />
Adj. net debt Equity Adj. net debt/EBITDA<br />
125 | 13 April 2011<br />
www.danskeresearch.com
<strong>Scandi</strong> Handbook<br />
Renault has divested majority of stake in Volvo<br />
In October 2010, Renault announced that it had divested the lion’s share of its Volvo<br />
shares in a private placement to institutional investors. This brings its share of the<br />
capital down from 21.8% to 6.8%. However, since Renault decided to keep its A-<br />
series shares, which have 10 times the voting rights of the B-series shares, the car<br />
manufacturer stills controls 17.5% of the votes. Renault’s ownership stake in Volvo<br />
has no strategic importance as it was received as payment for selling the Renault<br />
truck division to Volvo. Hence, the change in ownership is neutral for Volvo, given<br />
the amount of public information currently available.<br />
Monthly truck deliveries<br />
30,000<br />
28,000<br />
26,000<br />
24,000<br />
22,000<br />
20,000<br />
18,000<br />
16,000<br />
14,000<br />
12,000<br />
10,000<br />
8,000<br />
6,000<br />
4,000<br />
2,000<br />
Seasonal adj<br />
Actual<br />
Recommendation<br />
We have an overall BUY recommendation on Volvo. We prefer the VLVY 2014 and<br />
2017 bonds, which are offered at Z-spreads of +81bp and +105bp, respectively (see<br />
list of prices at end of this book).<br />
0<br />
2000 2001 2002 2003 2004 2005 2006 2007 2008 2009 2010 2011 2012<br />
Source: Company data, <strong>Danske</strong> Markets<br />
We would not be surprised to see S&P and Fitch upgrading Volvo’s credit ratings. The<br />
current ‘BBB-’/‘Baa2’ ratings are still significantly below those of competitors. Since<br />
captive finance is a competitive factor, as funding costs influence truck sales, Volvo has<br />
an incentive to preserve and rebuild a solid capital structure. Before the economic<br />
downturn in 2009, Volvo was rated ‘A-’/‘A3’. Furthermore, credit metrics look strong<br />
for the current credit ratings.<br />
Furthermore, recovery prospects for Volvo look good relative to sector peers, due to<br />
broader geographical diversification. As the US economy improves, replacement<br />
demand for ageing trucks should drive a recovery in volumes as the US fleet is relatively<br />
old, with associated higher maintenance and repair costs. The European market,<br />
on the other hand, has a relatively young fleet with low replacement demand and<br />
overcapacity in the transport sector, which has resulted in price erosion on new vehicles.<br />
We therefore see markets such as North America and Asia to have higher<br />
growth compared to Europe. Relative to competitors more reliant on the European<br />
truck market (e.g. Scania), this will benefit Volvo. Volvo expects an increase in<br />
demand of 55% in North America and 23% in Europe in 2011.<br />
With a 36bp spread in 5Y CDS between Volvo and Scania, we recommend a pair<br />
trade, selling 5Y protection on Volvo (103bp) and buying 5Y protection on Scania<br />
(67bp). Before December 2008, they traded in line.<br />
Quarterly review (SEKm)<br />
Q4 09 Q1 10 Q2 10 Q3 10 Q4 10<br />
Net sales 59,798 58,617 68,765 63,969 73,398<br />
EBIT -2,316 2,799 4,770 4,913 5,518<br />
EBIT margin -3.9% 4.8% 6.9% 7.7% 7.5%<br />
Net income -1,985 1,720 3,226 2,851 3,415<br />
Net debt 41,478 45,689 43,069 42,553 28,366<br />
Net debt/EBITDA (annualised) 18.2x 2.1x 1.4x 1.4x 0.9x<br />
Source: Company data, <strong>Danske</strong> Fixed Income Credit Research<br />
126 | 13 April 2011<br />
www.danskeresearch.com
<strong>Scandi</strong> Handbook<br />
Financial data - Volvo AB*<br />
Key figures (SEKm) 2006 2007 2008 2009 2010<br />
Net Sales 249,020 276,795 294,932 208,487 257,375<br />
EBITDA (1) 30,539 29,702 27,978 -3,951 29,171<br />
EBIT (1) 20,869 19,916 14,454 -16,333 17,834<br />
Net interest expenses -81 170 764 3,169 2,700<br />
Net profit 17,203 15,028 10,016 -14,685 11,212<br />
FFO (2) 29,873 25,514 23,158 2,527 18,012<br />
Capex (3) 10,200 10,100 12,600 10,464 10,643<br />
EBITDA-Capex 20,339 19,602 15,378 -14,415 18,528<br />
OpFCF (4) 23,439 19,702 26,278 -19,115 13,928<br />
FCF (5) 18,363 5,482 21,506 -18,661 19,218<br />
RCF 28,563 15,582 34,106 -8,197 29,861<br />
Net debt (6) -19,853 8,260 24,174 41,486 28,366<br />
Adjusted net debt (7) -8,252 26,601 45,232 60,144 48,099<br />
Equity (incl. minorities) 79,047 75,129 75,046 58,485 66,101<br />
Total capital (8) 89,106 113,415 121,795 137,375 125,958<br />
Ratios 2006 2007 2008 2009 2010<br />
EBIT margin 8.4% 7.2% 4.9% -7.8% 6.9%<br />
Capex/revenue 4.1% 3.6% 4.3% 5.0% 4.1%<br />
EBITDA/Net interest exp. n.m. 174.7x 36.6x n.m. 10.8x<br />
Net debt/EBITDA n.m. 0.3x 0.9x n.m. 1.0x<br />
Adjusted net debt/EBITDA n.m. 0.9x 1.6x n.m. 1.6x<br />
Adj. net debt/total capital n.m. 23% 37% 44% 38%<br />
*Numbers excluding Financial Services. (1) Adjusted for non-recurring items. (2) Net income from continuing operations plus depreciations, amortizations, deferred<br />
taxes, and other non-cash items. (3) Investments in tangible & intangible assets. (4) Cash flow from operating activities before net interest paid and taxes paid but<br />
less capex. (5) OpFCF less net interest paid, tax paid, and dividends. (6) Total interest-bearing debt less cash and marketable securities. (7) Net debt adjusted for<br />
operating leases, and contingent liabilities.<br />
Source: Company data, <strong>Danske</strong> Fixed Income Credit Research.<br />
Divisional quarterly review (SEKm)<br />
Q4 09 Q1 10 Q2 10 Q3 10 Q4 10<br />
Trucks Sales 37,678 36,488 41,589 41,187 48,041<br />
EBIT -1,316 1,444 2,478 2,700 3,490<br />
EBIT margin -3.5% 4.0% 6.0% 6.6% 7.3%<br />
Buses Sales 5,793 5,067 5,253 4,594 5,602<br />
EBIT -46 145 259 155 221<br />
EBIT margin -0.8% 2.9% 4.9% 3.4% 3.9%<br />
Construction Sales 10,159 11,148 15,295 12,710 14,657<br />
Equipment EBIT -564 1,006 2,086 1,330 1,758<br />
EBIT margin -5.6% 9.0% 13.6% 10.5% 12.0%<br />
Volvo Penta Sales 1,939 1,977 2,631 2,077 2,031<br />
EBIT 7 121 312 72 73<br />
EBIT margin 0.4% 6.1% 11.9% 3.5% 3.6%<br />
Volvo Aero Sales 1,978 1,910 2,133 1,815 1,850<br />
EBIT -169 152 -372 224 282<br />
EBIT margin -8.5% 8.0% -17.4% 12.3% 15.2%<br />
Customer Finance Sales 2,815 2,508 2,426 2,146 1,951<br />
EBIT 15 14 7 48 98<br />
EBIT margin 1% 1% 0% 2% 5%<br />
Source: Company data, <strong>Danske</strong> Fixed Income Credit Research<br />
127 | 13 April 2011<br />
www.danskeresearch.com
<strong>Scandi</strong> Handbook<br />
128 | 13 April 2011<br />
www.danskeresearch.com
<strong>Scandi</strong> Handbook<br />
Pulp & Paper<br />
129 | 13 April 2011<br />
www.danskeresearch.com
<strong>Scandi</strong> Handbook<br />
M-real<br />
Company overview<br />
Finnish-based M-real has undergone significant restructuring in recent years with<br />
material asset divestments to meet debt maturities. As a result, the short-term liquidity<br />
position has improved from a very vulnerable level. M-real has limited product<br />
diversification with activities in uncoated fine paper and consumer packaging. Within<br />
the consumer packaging segment, M-real has a leading European market position<br />
while the company is the sixth-largest European uncoated fine paper producer. The<br />
geographical diversification is limited as Europe generated roughly 80% of sales in<br />
2010. M-real has a below-average operating efficiency but credit metrics are currently<br />
improving, albeit from exceptionally weak levels. As of end-2010, M-real had<br />
4,500 employees. Metsäliitto, a Finnish forestry owners’ co-operative, holds 38.8%<br />
of the shares and 60.6% of the votes.<br />
Key credit considerations<br />
Operational efficiency and diversification behind larger competitors<br />
M-real has a below-average cost efficiency and lacks the important scale of its larger<br />
competitors (e.g. Stora Enso and UPM). It benefits from full pulp integration through<br />
its own pulp operations and a stake in Metsä-Botnia. While its self-sufficiency in<br />
wood is limited, M-real has long-term wood purchase contracts with Metsäliitto’s<br />
members but must pay Finnish market prices. M-real’s energy self-sufficiency is<br />
roughly 60%.<br />
Supportive majority owner<br />
Metsäliitto holds 38.8% of the shares and 60.6% of the votes in M-real. Controlled<br />
by 131,000 private forest owners in Finland, it has historically provided support to<br />
M-real, including proportional participation in the EUR448m rights issue in 2004 and<br />
participation in the restructuring of joint ownership over Uruguayan assets in late<br />
2009.<br />
Significant asset divestments and debt reductions in 2008 and 2009<br />
In late 2008, M-real made an exit from magazine and coated fine paper as it divested<br />
its large graphics paper operations to Sappi. M-real’s net debt decreased by<br />
EUR630m due to the divestment and totalled EUR1.3bn at end-2008 compared with<br />
1.9bn at end-2007. Net debt decreased further to EUR777m at end-2009 (EUR827m<br />
end-2010) as M-real was compensated through a cash payment and debt transfer<br />
following the divestment of assets at Metsä-Botnia (subsequently owned 30% by M-<br />
real, 53% by Metsäliitto and 17% by UPM) to UPM. As demand patterns across<br />
different forest product categories are only partially correlated, an improved shortterm<br />
liquidity profile comes at the expense of lost diversification benefits following<br />
the divestments. Furthermore, M-real’s remaining Finnish pulp assets are less cost<br />
efficient than the eucalyptus-based assets divested through Metsä-Botnia.<br />
Increased focus on consumer packaging is credit positive<br />
M-real has a long-term strategy of growing the consumer packaging segment, where<br />
it holds a leading European position within cartonboard. In addition, the company is<br />
the sixth-largest European uncoated fine paper producer. Demand conditions in the<br />
consumer packaging market are relatively stable compared with other forest product<br />
categories. Furthermore, the market is less fragmented, supporting some pricing<br />
power. While an increased proportion of cash flow generated from consumer packaging<br />
is credit positive, M-real remains exposed to cyclical and challenging market<br />
conditions, particularly through its activities in uncoated fine paper.<br />
SELL<br />
Sector: Paper & Forest Products<br />
Corporate ticker: MESSA<br />
Equity ticker: MRLBV FH<br />
Market cap: EUR1.0bn<br />
Ratings:<br />
Moodys rating: B3 /PO<br />
S&P rating: B- / PO<br />
Fitch rating: NR<br />
Analysts:<br />
Kristian Myrup Pedersen<br />
kripe@danskebank.dk<br />
+45 45128519<br />
Asbjørn Purup Andersen<br />
apu@danskebank.dk<br />
+45 45148886<br />
Key credit issues<br />
Strengths:<br />
• Leading position in the relatively<br />
attractive consumer packaging<br />
segment<br />
• Significant restructurings and<br />
debt reductions<br />
• High integration into pulp and energy<br />
• Improved liquidity profile coming<br />
from a very stressed level<br />
Challenges:<br />
• Below-average cost efficiency<br />
• Limited diversification across<br />
product categories and geographical<br />
regions<br />
• Exposure to challenging market<br />
conditions in uncoated fine paper<br />
market and volatile input costs<br />
• Very weak credit metrics although<br />
improving<br />
Source: <strong>Danske</strong> Markets<br />
130 | 13 April 2011<br />
www.danskeresearch.com
<strong>Scandi</strong> Handbook<br />
Liquidity<br />
Following the divestment of assets to Sappi at end-2008 and to UPM through Metsä-<br />
Botnia at end-2009, M-real has reduced debt and improved its liquidity position from<br />
an exceptionally weak level, albeit net debt increased EUR50m in 2010. Still, the<br />
liquidity position is a major rating factor and spread driver for the company. FFO<br />
generation was modest at best but positive at EUR17m in FY 2010 compared with a<br />
EUR59m burn in FY 2009. Following a EUR86m increase in working capital during<br />
2010 (EUR140m decrease in 2009), the FOCF outflow was EUR133m compared<br />
with a EUR11m FOCF inflow in 2009. S&P and Moody’s expect the cash generation<br />
to increase to positive territory in 2011 due to improved operating profitability.<br />
M-real extended the debt maturity profile in 2010, as in June 2010 the company drew<br />
EUR135m of pension loans maturing in 2020. Moreover, it raised additional pension<br />
loans for EUR31m in December 2010. The pension facilities are related to the special<br />
Finnish pension system where companies are entitled to borrow back a portion of<br />
their pension funds from pension insurance companies.<br />
At end-2010, M-real had cash and equivalents amounting to EUR408m. This compares<br />
with EUR111m of debt falling due in 2011. Debt maturities in 2012 amount to<br />
EUR158m. We view the medium-term debt maturity profile as challenging, as<br />
EUR605m matures in 2013, including the EUR500m MESSA’13. While cash is<br />
expedited to recover, the cash burn could easily return in the medium term, in our<br />
view, given the inherent volatility in M-real’s markets.<br />
M-real no longer has a significant committed bank facility after the EUR500m facility<br />
maturing in December 2009 expired. M-real has previously stated its desire to<br />
replace it with a smaller facility, but so far nothing has materialised. We believe it is<br />
uncertain whether banks will provide a new facility on an unsecured basis. A secured<br />
facility is, however, not in compliance with the negative pledge clause in M-real’s<br />
bond documentations. If a waiver fee is accepted by the bondholders, the bonds will<br />
effectively be subordinated. Alternatively, the bonds could be called.<br />
Covenant headroom<br />
M-real’s loans contain customary cross default and negative pledge provisions and<br />
require it to maintain covenant ratios. In particular, some of M-real’s loan agreements<br />
set a 120% limit on net gearing and a 30% limit on the equity ratio. If calculated<br />
as defined in the loan agreements, net gearing at end-2010 was 64% (63% end-<br />
2009) and the equity ratio was 38% (35% end-2009). We view current covenant<br />
headroom as adequate but lower headroom could result from renewed pressure on<br />
operations and impairments.<br />
Current performance drivers<br />
Improved operating performance and upgrade by Moodys and S&P<br />
2010 was a strong year for M-real in terms of earnings, as the operating environment<br />
improved significantly, and both volumes and prices were up. For the full year, M-<br />
real achieved a positive net profit (EUR27m) for the first time in years (EUR354m<br />
loss in 2009). However, from a cash flow perspective, 2010 was a weak year, as the<br />
FOCF outflow was EUR133m compared with a EUR11m FOCF inflow in 2009.<br />
M-real reported Q4 10 sales in line with consensus expectations while a net loss of<br />
EUR22m was worse than expected. Comparable sales increased 0.5% q/q and 9.7%<br />
y/y to EUR665m. Clean EBIT declined sequentially but materially increased compared<br />
with Q4 09. The clean EBIT margin improved to 5.6% from 1.2% in Q4 09<br />
due to improved demand, implemented price increases in paper and board, cost savings<br />
and a sharp tailwind from higher pulp prices. The clean EBIT margin declined<br />
sequentially from 8.2% in Q3 10 due to a strengthening in SEK and an increase in<br />
costs. M-real expects accelerated cost inflation in 2011 to be “mostly offset” by a recently<br />
announced EUR70m profit improvement programme. The company expects<br />
Debt maturity profile (end-10)<br />
EURm<br />
Source: Company data and <strong>Danske</strong> Markets<br />
Profitability<br />
EURm<br />
Source: Company data and <strong>Danske</strong> Markets<br />
Sales by segments 2010<br />
Source: Company data and <strong>Danske</strong> Markets<br />
Credit metrics<br />
EURm<br />
700<br />
600<br />
500<br />
400<br />
300<br />
200<br />
100<br />
0<br />
6.000<br />
5.000<br />
4.000<br />
3.000<br />
2.000<br />
1.000<br />
0<br />
3.000<br />
2.500<br />
2.000<br />
1.500<br />
1.000<br />
500<br />
0<br />
2011 2012 2013 2014 2015 2016+<br />
2006 2007 2008 2009 2010<br />
Net sales EBITDA EBITDA margin<br />
Market<br />
Pulp and<br />
Energy<br />
17%<br />
Paper<br />
37%<br />
Source: Company data and <strong>Danske</strong> Markets<br />
14%<br />
12%<br />
10%<br />
8%<br />
6%<br />
4%<br />
2%<br />
0%<br />
Consumer<br />
Packaging<br />
46%<br />
2006 2007 2008 2009 2010<br />
Net debt Equity Net debt/EBITDA<br />
20<br />
18<br />
16<br />
14<br />
12<br />
10<br />
8<br />
6<br />
4<br />
2<br />
0<br />
131 | 13 April 2011<br />
www.danskeresearch.com
<strong>Scandi</strong> Handbook<br />
the average pulp price to be slightly lower in Q1 11. It expects demand for board to<br />
remain good, while demand for uncoated fine paper is expected to remain stable.<br />
Overall, M-real expects Q1 11 clean EBIT to improve sequentially on the EUR37m<br />
realised in Q4 10.<br />
Short-term liquidity and covenant headroom remain adequate. While working capital<br />
was unchanged during Q4 10 (but up EUR86m in 2010), FFO was surprisingly weak<br />
and negative at EUR18m and M-real generated a FOCF burn of EUR36m during the<br />
quarter. With increased capex ahead related to announced capacity expansions, we<br />
see risks to S&P’s expectation of positive medium-term FOCF generation. Credit<br />
metrics gradually improved during 2010 but remain weak and volatile.<br />
Unsurprisingly, after the Q2 10 statement, both Moody’s and S&P upgraded the<br />
rating one notch to B3 and B-, respectively, while Moody’s even kept the outlook on<br />
positive. On 4 March 2011, S&P also placed the rating on positive outlook. We<br />
would not be surprised to see rating upside over the next 6-12 months if the strong<br />
demand recovery continues and the operating environment in general remains favourable.<br />
Significant asset divestments in 2009<br />
In July 2009, Metsä-Botnia and its owners (M-real 30%, Metsäliitto 23% and UPM<br />
47%) signed a letter of intent regarding an asset restructuring. In December 2009, the<br />
transaction closed. Metsä-Botnia and Metsäliitto’s shares of the Uruguayan Fray<br />
Bentos pulp mill and Forestal Oriental plantation forestry company were acquired by<br />
UPM. In addition, UPM acquired 1.2% of the energy company PVO from Metsä-<br />
Botnia. After the transaction, Metsä-Botnia is owned 30% by M-real, 53% by<br />
Metsäliitto and 17% by UPM. M-real’s net debt declined materially to EUR777m at<br />
end-2009 from EUR1.3bn after Q3 09. The net debt reduction consisted of a<br />
EUR300m cash consideration, a EUR50m three-year receivable from Metsäliitto and<br />
a change in how M-real accounts for its stake in Metsä-Botnia. In our view, the business<br />
logic behind a divestment of the eucalyptus-based assets at Metsä-Botnia level<br />
makes sense for M-real, as the company is less reliant on this raw material post the<br />
divestment of its graphics paper business to Sappi in 2008. However, M-real’s remaining<br />
Finnish pulp assets are less cost efficient than the eucalyptus-based assets.<br />
Recommendation<br />
We are positive on M-real’s long-term strategy of growing the consumer packaging<br />
segment. However, M-real remains exposed to cyclical and challenging market conditions,<br />
particularly through its activities in uncoated fine paper, and it has recently<br />
been riding very favourable conditions in the pulp market. We expect cash generation<br />
and credit metrics to improve gradually. However, the cash burn could easily return<br />
in the medium term. We view the medium-term debt maturity profile as challenging<br />
with EUR605m maturing in 2013, including the EUR500m MESSA’13. While several<br />
things indicate that the tailwind from a sharply rising pulp price is currently<br />
losing momentum, we do not expect a hard landing for the pulp price.<br />
We have a negative stance towards both MESSA’13 (around ASW +235/209bp) and<br />
the 5y CDS trading around +355/365bp, i.e. flat to iTraxx Crossover. Both instruments<br />
are too tight, in our view, and do not adequately capture the volatility in cash<br />
flow generation, refinancing risk and risks inherent in M-real’s industry.<br />
132 | 13 April 2011<br />
www.danskeresearch.com
<strong>Scandi</strong> Handbook<br />
Financial data M-real<br />
Key figures (EURm) 2006 2007 2008 2009 2010<br />
Net Sales 5,624 4,440 3,236 2,432 2,605<br />
Clean EBITDA 411 366 192 44 305<br />
Clean EBIT 45 49 -35 -150 173<br />
Net interest expenses 137 150 155 105 77<br />
Net profit -349 -195 -508 -354 27<br />
FFO (1) 166 85 -90 -59 17<br />
Capex 428 259 128 70 64<br />
EBITDA-Capex -17 107 64 -26 241<br />
RCF (2) 127 65 -110 -59 15<br />
FCF (3) -244 -152 -245 11 -135<br />
Net debt (4) 2,403 1,867 1,254 777 827<br />
Adjusted net debt (5) 2,646 2,050 1,368 872 917<br />
Equity (incl. minorities) 1,906 1,670 1,386 924 999<br />
Total debt 2,781 2,336 2,106 1,411 1,350<br />
Total capital (6) 4,687 4,006 3,492 2,335 2,349<br />
Ratios<br />
EBITDA margin (%) 7% 8% 6% 2% 12%<br />
Capex/Net revenues (%) 8% 6% 4% 3% 2%<br />
EBITDA/Net interest expenses (x) 3.0x 2.4x 1.2x 0.4x 4.0x<br />
Adj. net debt/EBITDA (x) 6.4x 5.6x 7.1x 19.8x 3.0x<br />
Net debt/EBITDA (x) 5.8x 5.1x 6.5x 17.7x 2.7x<br />
FFO/Adjusted net debt 6% 4% -7% -7% 2%<br />
RCF/Adjusted net debt 5% 3% -8% -7% 2%<br />
Net debt/Equity (%) 126% 112% 90% 84% 83%<br />
Net debt/Total capital (%) 51% 47% 36% 33% 35%<br />
Adjusted net debt/Total capital (%) 56% 51% 39% 37% 39%<br />
(1) Funds from operations. (2) FFO less dividends. (3) RCF less capex and changes in working capital (4) Total interest-bearing debt less cash and marketable<br />
securities. (5) Net debt adjusted contingent liabilities (6) Equity and unadjusted total debt. Source: Company data and <strong>Danske</strong> Markets<br />
Quarterly review (EURm)<br />
Q4 09 Q1 10 Q2 10 Q3 10 Q4 10<br />
Net sales 606 602 676 662 665<br />
EBITDA 51 72 77 85 71<br />
EBITDA margin (%) 8% 12% 11% 13% 11%<br />
Net income -68 19 -8 38 -22<br />
Adjusted net debt 872 916 940 916 922<br />
Adj. net debt/LTM EBITDA (x) 19.8 7.1 4.2 3.2 3.0<br />
Source: Company data and <strong>Danske</strong> Markets<br />
Divisional quarterly overview (EURm)<br />
Q4 09 Q1 10 Q2 10 Q3 10 Q4 10<br />
Consumer Packaging Net sales 255 257 310 305 303<br />
Clean EBIT margin 13% 15% 12% 11% 8%<br />
Officer Papers Net sales 132 160 153 164 181<br />
Clean EBIT margin -41% 0% -3% 5% 5%<br />
Specialty Papers Net sales 73 82 80 75 66<br />
Clean EBIT margin -107% -7% -26% 5% -47%<br />
Market Pulp & Energy Net sales 126 95 126 107 106<br />
Clean EBIT margin -31% 9% 13% 11% -1%<br />
Other Net sales 59 46 44 53 55<br />
Clean EBIT margin 146% 15% 14% 13% -9%<br />
Source: Company data and <strong>Danske</strong> Markets<br />
133 | 13 April 2011<br />
www.danskeresearch.com
<strong>Scandi</strong> Handbook<br />
Norske Skog<br />
Company overview<br />
Norway’s Norske Skog is among the world’s largest producers of newsprint paper,<br />
and based on overall European market shares for publication paper it ranks third after<br />
UPM and Stora Enso. Narrow product diversification is only partially mitigated by<br />
meaningful geographical diversification. Material asset divestments in recent years<br />
have significantly lowered debt levels, but the liquidity profile remains weak. The<br />
company operates in industries characterised by high cyclicality, high capital intensity<br />
and weak pricing power. Norske Skog has a highly diverse ownership base.<br />
Key credit considerations<br />
Market-leading position with narrow product focus<br />
Norske Skog has leading market positions and a focus on newsprint (52% of 2010<br />
sales) and magazine paper (28% of 2010 sales). It has around 10% of the global<br />
newsprint market and around 5% of the global magazine paper market. As demand<br />
patterns across different forest product categories overlap but are only partially correlated,<br />
Norske Skog’s narrow product mix results in lost diversification benefits compared<br />
with UPM, Stora Enso, etc. This is only somewhat mitigated by meaningful<br />
geographical diversification, with the following 2010 sales split: Europe 63%, Australasia<br />
20%, North and South America 11%, Asia 5%, Africa 1%.<br />
Cyclical and structural demand decline<br />
Demand for newsprint and magazine paper is highly cyclical and correlated with<br />
advertisement spending. Furthermore, the segments (particularly in mature markets)<br />
suffer from structurally declining demand due to conversion to digital media. Other<br />
structural challenges facing Norske Skog are overcapacity and poor supply discipline.<br />
The long-term structural challenges resulted in a generally weak point of departure<br />
heading into the significant economic downturn.<br />
2010 stuck in the middle<br />
While operating efficiency is highly important in the competitive and commoditised<br />
forest products industry, Norske Skog has a moderately to relatively strong cost<br />
position, reflecting its size and efficiency in most of its machinery and several profitability<br />
improvement programmes. Norske Skog has weak pricing power in its endmarkets<br />
and an exposure to input cost volatility owning to limited integration of<br />
wood operations. Following surging pulp and recovered paper prices over the last 12<br />
months and plunging newsprint prices in the annual 2010 contracts, Norske Skog was<br />
stuck in the middle, with very weak earnings and cash generation as a result. However,<br />
2011 looks more positive due to considerable price increases, both within<br />
newsprint and magazine paper. The European newsprint market has been characterised<br />
by a time-delayed correlation between capacity utilisation and pricing, as contract<br />
prices are fixed. Recently, though, the industry has to some extent been adopting<br />
quarterly instead of annual contracts, so the time-delay should be less pronounced<br />
going forward. NOK accounts for a small proportion of Norske Skog’s sales, while a<br />
relatively large proportion of the cost base is located in Norway. This creates a longterm<br />
currency mismatch, affecting competitiveness and margins.<br />
Divestments have lowered debt and now a rights issue could be ahead<br />
Material asset divestments in recent years (Korean assets in 2008, Chinese assets in<br />
2009, various properties in 2008 and 2009) have significantly lowered debt levels.<br />
However, cash flow has contracted significantly and Norske Skog was downgraded<br />
to B- (Negative Outlook) in August 2010 by S&P, primarily due to refinancing risk,<br />
tightening covenant headroom and poor operating performance. However, as part of<br />
the agenda for its AGM on 14 April 2011, the board proposes a rights issue (max<br />
10% of share capital), together with convertible bond issues (max NOK800m and<br />
10% of share capital if converted). This is part of a strengthening for potential consolidation.<br />
HOLD<br />
Sector: Paper & Forest Products<br />
Corporate ticker: NSINO<br />
Equity ticker: NSG NO<br />
Market cap: NOK3.1bn<br />
Ratings:<br />
Moodys rating: B2 / NO<br />
S&P rating: B- / NO<br />
Fitch rating: NR<br />
Analyst:<br />
Kristian Myrup Pedersen<br />
kripe@danskebank.dk<br />
+45 45128519<br />
Asbjørn Purup Andersen<br />
apu@danskebank.dk<br />
+45 45148886<br />
Key credit issues<br />
Strengths:<br />
• Market-leading positions<br />
• Moderate geographical diversification<br />
• Moderate to relatively strong cost<br />
efficiency<br />
• Material debt reductions in recent<br />
years<br />
Challenges:<br />
• Narrow product mix<br />
• Structurally declining and cyclical<br />
demand<br />
• Volatile input costs and weak pricing<br />
power<br />
• Weak credit metrics and liquidity<br />
profile<br />
Source: <strong>Danske</strong> Markets<br />
134 | 13 April 2011<br />
www.danskeresearch.com
<strong>Scandi</strong> Handbook<br />
Liquidity<br />
While substantial asset disposals in recent years have provided a cash reserve to meet<br />
short-term debt maturities, significant refinancing risk looms, especially in 2012.<br />
Cash and equivalents amounted to NOK4.4bn as of end-2010, while LTM FOCF was<br />
neutral in 2010. Although uncertain, Moody’s expects FOCF to improve in 2011.<br />
This compares with debt maturities totalling NOK2bn in 2011 and NOK3.8bn in<br />
2012.<br />
Norske Skog plans to continue debt reduction through further asset divestments. We<br />
still emphasise latent value in Norske Skog’s long-term in-the-money electricity<br />
supply contracts (valued at around NOK3bn as of end-2010). However, this asset<br />
should not be seen as fully liquid. While we expect debt maturities in 2011 to be<br />
covered with available cash resources, refinancing risk relates to a EUR400m fullydrawn<br />
credit facility maturing Feb 2012. Full repayment could be contingent on<br />
uncertain asset divestments and positive free cash flow. According to its 2010 report,<br />
Norske Skog is in dialogue with the lenders regarding refinancing of debt maturing in<br />
2011 and 2012.<br />
Covenant headroom<br />
The EUR400m credit facility maturing 2012 contains financial covenants. If no<br />
waiver is obtained, a breach of covenants could cause early redemption and crossdefault<br />
on virtually all the company’s debt. At end-2010, the gearing ratio was 0.87x<br />
against a permitted maximum of 140%. This compared with 0.8x at end-2009. Tangible<br />
net worth, defined as total book value of equity less intangible fixed assets, was<br />
about NOK10bn, against a minimum of NOK9bn. This compared with NOK11.7bn<br />
at end-2009. S&P views the covenant headroom as tight, owing to poor profitability,<br />
impairment charges and volatility in the value of long-term energy contracts.<br />
Current performance drivers<br />
2010 was a tough year<br />
The operating environment for Norske Skog was tough in 2010, as low paper prices<br />
in Europe in combination with higher input costs, especially related to recovered<br />
paper and market pulp, weighed on performance. Sales went down by 7% to<br />
NOK19bn, despite slightly higher delivered volumes. The 2010 cash flow from operating<br />
activities declined to NOK397m, from NOK1.7bn in 2009, due to weak operating<br />
earnings, redundancy expenses related to 2009 being paid for in 2010, and the<br />
change in NWC.<br />
Debt maturity profile (end-2010)<br />
NOKm<br />
6000<br />
5000<br />
4000<br />
3000<br />
2000<br />
1000<br />
Source: Company data, <strong>Danske</strong> Markets<br />
Profitability<br />
NOKm<br />
0<br />
35.000<br />
30.000<br />
25.000<br />
20.000<br />
15.000<br />
10.000<br />
5.000<br />
2011 2012 2013 2014 2015 2016+<br />
0<br />
2006 2007 2008 2009 2010<br />
Net sales EBITDA EBITDA margin<br />
Source: Company data, <strong>Danske</strong> Markets<br />
Sales by category, 2010<br />
Energy<br />
10%<br />
Magazine<br />
Paper<br />
28%<br />
Other<br />
10%<br />
20%<br />
15%<br />
10%<br />
5%<br />
0%<br />
Newsprint<br />
52%<br />
Norske Skog reported weak Q4 10 numbers – as expected – with revenue amounting<br />
to NOK5.2bn and clean EBITDA NOK479m, resulting in a margin of 9.3%. Clean<br />
EBITDA increased 18% q/q with volumes up 4-5% q/q, largely due to seasonality.<br />
The net loss in Q4 10 amounted to NOK198m, compared with a NOK244m loss in<br />
the previous quarter and a NOK667m profit in the same period last year. As in previous<br />
period, Newsprint Europe was very weak due to lower prices and surging input<br />
costs, resulting in a clean EBITDA loss. This was to some extent offset by better<br />
results in Newsprint outside Europe and Magazine paper.<br />
As the majority of interest payments fall due in the second and fourth quarters, cash<br />
flow was fairly weak in Q4 10. Net debt declined to NOK8.9bn, which was slightly<br />
lower sequentially and down from NOK9.6bn at end-2009.<br />
Credit metrics remain very weak with adjusted net debt/EBITDA of 6.8x, FFO/adj.<br />
net debt of 7% and neutral FOCF generation. We expect credit metrics to improve in<br />
2011 – but to remain weak – as higher European newsprint prices, an implementation<br />
of quarterly price agreements (lowering earnings volatility, all else equal), higher<br />
European magazine paper prices and stable prices in Australasia are likely to improve<br />
margins, despite some continued input cost inflation. While further negative<br />
rating action cannot be ruled out, we expect some volume increase and meaningful<br />
Source: Company data and <strong>Danske</strong> Markets<br />
Credit metrics<br />
NOKm<br />
20.000<br />
18.000<br />
16.000<br />
14.000<br />
12.000<br />
10.000<br />
8.000<br />
6.000<br />
4.000<br />
2.000<br />
0<br />
2006 2007 2008 2009 2010<br />
Net debt Equity Net debt/EBITDA<br />
Source: Company data, <strong>Danske</strong> Markets<br />
7<br />
6<br />
5<br />
4<br />
3<br />
2<br />
1<br />
0<br />
135 | 13 April 2011<br />
www.danskeresearch.com
<strong>Scandi</strong> Handbook<br />
price increases in 2011 contracts to support a recovery in operating performance this<br />
year.<br />
Consolidation finally?<br />
In early September 2010, Finnish media reported that Stora Enso, Holmen and Norske<br />
Skog (three of the top four European newsprint producers, accounting for 40% of<br />
the European market) are planning a joint venture in Europe to reduce capacity and<br />
facilitate pricing power. Holmen and Stora Enso denied such discussions, while<br />
Norske Skog repeated its willingness to participate in restructuring, without commenting<br />
on specific discussions. While consolidation has been a theme for years,<br />
access to financing and disagreements on valuation have created difficulties. Following<br />
years of weak newsprint prices development, rapidly increased input costs, strong<br />
competition from digital media and weak (albeit improving) demand, the sector is<br />
desperate for action, and a joint venture could be the a feasible way to consolidate the<br />
industry. In our view, consolidation could end up being strongly beneficial for Norske<br />
Skog.<br />
In addition to this, on 21 December 2010, UPM announced an agreement to acquire<br />
Myllykoski, including alliance partner Rhein Papier GmbH, for a total enterprise<br />
value of EUR900m. While a number of issues remain to be resolved, including approval<br />
from the regulatory authorities, a transaction would finally bring some industry-consolidation<br />
in the European publication paper sector. If the transaction goes<br />
through, this could have positive spill-over effects for Norske Skog due to capacity<br />
shut-down.<br />
Rights issue and convertible bonds on the horizon<br />
As mentioned earlier, the Board has proposed a rights issue (max. 10% of share<br />
capital) together with convertible bond issues (max. NOK800m and 10% of share<br />
capital if converted). The purpose is to bring Norske Skog into a better financial<br />
position to play an active role in the consolidation, as well as increasing its flexibility.<br />
While we very much welcome further industry consolidation, as it undoubtedly<br />
makes sense from a business perspective, the exact constellation and transaction<br />
structuring will be crucial from a credit perspective. As Norske Skog is now starting<br />
to prepare financially for consolidation, this theme is likely to attract a lot of attention<br />
in 2011. In our view, this preparation is key, as a prerequisite for Norske Skog to<br />
play an active role in refinancing debt maturing in 2011 and 2012. Right now, the<br />
momentum for consolidation is good: in addition to the potential financial strengthening,<br />
better sales prices, higher risk appetite in the high-yield market and the<br />
UPM/Myllykoski consolidation are all in favour of more industry consolidation. In<br />
our view, Norske Skog could potentially play the role of either both acquirer or target,<br />
but irrespective of its role, the transaction financing will be the key credit driver.<br />
Recommendation<br />
While we expect credit metrics to improve in 2011, we also expect internal cash<br />
generation to remain insufficient to meet the NOK3.8bn in 2012 debt maturities.<br />
While the CFO remains “confident” that the company will be able to roll its debt, we<br />
stress that refinancing risk is material and contingent on substantial investor risk<br />
appetite in the low end of the high yield segment. However, we by no means rule out<br />
that a smaller transaction may be possible, following a continued search for yield by<br />
investors and better short-term operating prospects. We also point to further asset<br />
divestments as a means to lower debt, although it could impair the business risk<br />
profile. Should the proposed rights and convertible bond mandate be accepted by<br />
shareholders, and subsequent be put into effect, this would most likely be a positive<br />
spread catalyst.<br />
With the 5Y CDS trading around 1.7x iTraxx Crossover (down from a peak of 2.7x<br />
in April 2010), we have a HOLD recommendation on the 5Y CDS. We also recommend<br />
to HOLD the highly illiquid NSINO 2017 (around ASW +588/579bp).<br />
136 | 13 April 2011<br />
www.danskeresearch.com
<strong>Scandi</strong> Handbook<br />
Financial data Norske Skog<br />
Key figures (NOKm) 2006 2007 2008 2009 2010<br />
Net Sales 28,812 27,118 26,468 20,362 18,986<br />
Clean EBITDA 4,702 3,939 2,723 2,185 1,413<br />
Clean EBIT 1,476 1,060 100 -280 -580<br />
Net interest expenses 975 1,026 1,285 914 753<br />
Net profit -2,809 -618 -2,765 -1,400 -2,469<br />
FFO (1) 3,329 2,557 1,535 1,104 642<br />
Capex 1,722 1,746 1,283 580 411<br />
EBITDA-Capex 2,980 2,193 1,440 1,605 1,002<br />
RCF (2) 2,283 1,508 1,535 1,104 642<br />
FCF (3) 1,930 1,945 1,782 1,117 -14<br />
Net debt (4) 17,320 16,408 14,047 9,595 8,889<br />
Adjusted net debt (5) 18,018 17,025 14,773 10,382 9,576<br />
Equity (incl. minorities) 18,550 15,592 13,632 12,015 10,183<br />
Total debt 17,825 18,435 21,159 14,247 13,671<br />
Total capital (5) 36,375 34,027 34,791 26,262 23,854<br />
Ratios<br />
EBITDA margin (%) 16% 15% 10% 11% 7%<br />
Capex/Net revenues (%) 6% 6% 5% 3% 2%<br />
EBITDA/Net interest exp. (x) 4.8x 3.8x 2.1x 2.4x 1.9x<br />
Adj net debt/EBITDA (x) 3.8x 4.3x 5.4x 4.8x 6.8x<br />
FFO/Adj. net debt 18% 15% 10% 11% 7%<br />
RCF/Adjusted net debt 13% 9% 10% 11% 7%<br />
Net debt/Total capital (%) 48% 48% 40% 37% 37%<br />
Adj. net debt/Total capital (%) 50% 50% 42% 40% 40%<br />
(1) Funds from operations. (2) FFO less dividends. (3) RCF less capex and changes in working capital (4) Total interest-bearing debt less cash and marketable<br />
securities. (5) Net debt adjusted contingent liabilities/contractual obligations as reported. (6) Equity and unadjusted total debt. Source: Company data, <strong>Danske</strong><br />
Markets<br />
Quarterly review (NOKm)<br />
Q4 09 Q1 10 Q2 10 Q3 10 Q4 10<br />
Net sales 4,909 4,455 4,577 4,795 5160<br />
Clean EBITDA 472 275 275 384 479<br />
EBITDA margin (%) 10% 6% 6% 8% 9%<br />
Net income 667 -1,153 -874 -244 -198<br />
Adj. Net debt 10,382 10,252 11,086 9,785 9,676<br />
Adj. net debt/LTM EBITDA (x) 4.7 5.2 6.7 7.0 6.8<br />
Source: Company data, <strong>Danske</strong> Markets<br />
Divisional quarterly overview (NOKm)<br />
Q4 09 Q1 10 Q2 10 Q3 10 Q4 10<br />
Newsprint Net sales 2,999 2,613 2,840 2,944 2,999<br />
EBITDA margin 13% 9% 8% 12% 13%<br />
Magazine Paper Net sales 1,674 1,503 1,488 1,606 1,674<br />
EBITDA margin 10% 4% 3% 3% 10%<br />
Energy Net sales 435 589 495 527 435<br />
EBITDA margin -7% 8% 4% 6% -7%<br />
Other Net sales 523 528 536 504 523<br />
EBITDA margin -8% -10% -4% -8% -8%<br />
Source: Company data, <strong>Danske</strong> Markets<br />
137 | 13 April 2011<br />
www.danskeresearch.com
<strong>Scandi</strong> Handbook<br />
SCA<br />
Company overview<br />
Sweden-based SCA is one of the world’s three leading hygiene product companies,<br />
with strong brands within tissue, baby nappies, incontinence products and feminine<br />
hygiene products. While 58% of sales were generated by the relatively stable personal<br />
care and tissue operations in 2010, the remainder is derived from more cyclical<br />
activities in packaging, publication paper and solid wood operations. SCA is also one<br />
of the largest private owners of European forest land. SCA has 45,000 employees in<br />
more than 100 countries, but the geographical diversification is somewhat limited<br />
with a bias towards Europe, accounting for 75% of sales in 2010. Industrivärden AB<br />
is the largest shareholder with 10% of the shares and 29% of the votes.<br />
Key credit considerations<br />
Large exposure to hygiene products and diverse earnings base<br />
SCA benefits from strong product diversity, with demand drivers across different<br />
divisions exhibiting a relatively low correlation. Compared with its ‘pure’ paper and<br />
forest industry peers, SCA has large exposure to the relatively stable hygiene product<br />
markets, accounting for 58% of sales in 2010. The hygiene sector is firmly consolidated,<br />
which further supports price and earnings stability. SCA’s geographical spread<br />
is fair, but with a strong reliance on Europe. SCA is the global leader in incontinence<br />
products, No.1 in Europe in tissue and No.3 in Europe in nappies and feminine care.<br />
In North America, SCA is the third-largest in away-from-home (AFH) tissue. In the<br />
cyclical and fragmented packaging sector, SCA is Europe’s second-largest supplier<br />
of containerboard and corrugated board.<br />
Operational efficiency and good level of vertical integration<br />
Pricing pressure from large retail chains and strong competition is somewhat offset<br />
by SCA’s strong brand portfolio (Libero, Libresse, Tena, Tork) and low-cost base.<br />
The company’s competitive cost position stems from efficient and modern machinery<br />
and a good geographical balance between production and sales. Furthermore, a good<br />
level of vertical integration reduces volatility in the cost base as SCA’s own forest<br />
resources provide 44% of its virgin fibre requirements. Its level of pulp self sufficiency<br />
is about 40% and about 75% of the company’s electricity needs are purchased<br />
externally, resulting in a relatively high exposure to energy and pulp price volatility.<br />
Focus on growing hygiene business relative to forest and packaging<br />
SCA pursues growing its hygiene business with focus on product innovation, higher<br />
value-added products and investments in greater emerging market presence. In the<br />
period from 2000-10, the hygiene business increased its share of sales to 58% from<br />
46%. We view the long-term demand prospects for hygiene products as attractive,<br />
although austerity measures are likely to result in pricing pressure or an adverse mix<br />
development from public accounts. Within packaging and forest, SCA focuses on<br />
improving cash flow and profitability through internal efficiency measures. The<br />
strategy of growing the hygiene business will increasingly position SCA as a consumer<br />
product company and less as a forest product company, which would reduce<br />
cyclicality.<br />
SELL<br />
Sector: Paper & Forest Products<br />
Corporate ticker: SCACAP<br />
Equity ticker: SCAB SS<br />
Market cap: SEK70bn<br />
Ratings:<br />
Moodys rating: Baa1 / S<br />
S&P rating: BBB+ / S<br />
Fitch rating: NR<br />
Analyst:<br />
Kristian Myrup Pedersen<br />
kripe@danskebank.dk<br />
+45 45128519<br />
Asbjørn Purup Andersen<br />
apu@danskebank.dk<br />
+45 45148886<br />
Key credit issues<br />
Strengths:<br />
• Strong market positions<br />
• Well-diversified operations with<br />
large exposure to relatively stable<br />
hygiene product market<br />
• Competitive cost position and<br />
good level of vertical integration<br />
• Relatively stable credit metrics<br />
over cycle<br />
Challenges:<br />
• Exposure to volatile costs including<br />
pulp and energy<br />
• Cyclical markets for publication<br />
paper and packaging<br />
• Risk of acquisitions to expand geographical<br />
scope of hygiene operations<br />
Source: <strong>Danske</strong> Markets<br />
Credit metrics closing gap to requirements under BBB+<br />
SCA is rated BBB+ and Baa1 by S&P and Moody’s, respectively. Moody’s revised<br />
the outlook to stable in October 2009. Credit metrics gradually reduced the gap to<br />
requirements for the BBB+ rating during 2010 and S&P stabilised the outlook in late<br />
September 2010. The rating headroom remains limited to pursue debt-financed<br />
M&A.<br />
138 | 13 April 2011<br />
www.danskeresearch.com
<strong>Scandi</strong> Handbook<br />
Liquidity<br />
SCA has a front-end loaded debt maturity profile with substantial exposure to shortterm<br />
commercial paper (CP) financing. However, this is balanced by large back-up<br />
facilities. As of end 2010, SCA had cash and cash equivalents amounting to<br />
SEK1.9bn, and in addition to this, it had undrawn credit facilities of SEK28.4bn. As<br />
of end 2010, the main long-term credit facilities were a EUR1.1bn syndicated facility<br />
maturing in 2012 and a EUR1bn syndicated facility maturing in 2014. By year-end,<br />
SCA signed a new 5Y EUR1bn credit facility, which entered into effect from January<br />
2011. This facility refinances the old EUR1.1bn facility that was set to mature in<br />
2012. Moreover, two bilateral credit facilities of SEK6bn were terminated in January<br />
2011. SCA owns large areas of forest land, valued at SEK26bn at end-2010, which<br />
could be used as an extra source of liquidity. We expect FOCF to decline going forward<br />
but to remain solid as the working capital inflow is ended. As of end-2010,<br />
SCA reported SEK13.2bn of debt to mature in 2011, primarily CPs and the Eurobond<br />
mentioned below.<br />
SCA had a EUR700m Eurobond that matured in March 2011 and no longer has any<br />
Eurobond outstanding. We view the liquidity profile as adequate but see SCA as a<br />
likely new issue candidate to refinance the matured Eurobond without putting the full<br />
weight on credit facilities.<br />
Current performance drivers<br />
Higher raw material costs but strong recovery in packaging<br />
2010 was characterised by higher raw material costs, which resulted in lower operating<br />
profitability in the hygiene business, despite favourable sales in personal care and<br />
AFH tissue. The packaging business, on the other hand, experienced significantly<br />
improved operating profit, despite a steep rise in raw material prices, as both volumes<br />
and prices were up. Moreover, savings from the restructuring programme started to<br />
kick in. Within the forest product business, the operating profit was broadly unchanged.<br />
In 2010, reported group sales were down SEK1.7bn to SEK109bn from SEK111bn in<br />
2009, but adjusted for exchange rate effects and divestments, however, they was<br />
actually up by 5%. Looking at the reported profitability, net profit was up SEK0.8bn<br />
to SEK5.6bn during the same period. From a credit perspective, the year 2010 clearly<br />
shows the diversification gains from being neither a pure hygiene business nor a pure<br />
pulp business, as internal company diversification reduced operating volatility. In<br />
2010, the operating margins changed to 12%, 8%, 5%, and 14% from 13%, 10%, 1%,<br />
and 15% in 2009, for Personal Care, Tissue, Packaging, and Forest Products, respectively.<br />
This compares to 2008 levels of 12%, 6%, 4%, and 13%. As the numbers<br />
show, the different business segments do not exhibit high positive correlation, which<br />
from a credit perspective is positive, as this in the longer term decreases cash flow<br />
volatility.<br />
Packaging also had a strong fourth quarter<br />
SCA reported Q4 10 numbers in line with consensus expectations. Both net sales and<br />
clean operating profit were flat y/y (but increased 8% and 5% y/y excluding FX) and<br />
amounted to SEK27.6bn and SEK2.6bn, respectively. The clean operating margin<br />
was unchanged at 9.3%. Net profit declined 3% y/y to SEK1.7bn. The large Personal<br />
Care and Tissue segments (22% and 36% of 2010 sales, respectively) again suffered<br />
from sharply higher raw material costs, which were only partially offset by higher<br />
volumes and prices. As a result, the operating profit declined 18% y/y in both segments<br />
to a combined SEK1.5bn. Meanwhile, Packaging (27% of sales) developed<br />
very favourably due to higher volume, higher prices and savings from the restructuring<br />
programme. As a result, operating profit almost tripled y/y to SEK567m.<br />
Debt maturity profile (end-10)<br />
SEKm<br />
14000<br />
12000<br />
10000<br />
8000<br />
6000<br />
4000<br />
2000<br />
0<br />
Source: Company data, <strong>Danske</strong> Markets<br />
Profitability<br />
SEKm<br />
120.000<br />
100.000<br />
80.000<br />
60.000<br />
40.000<br />
20.000<br />
0<br />
Source: Company data, <strong>Danske</strong> Markets<br />
Sales by segments 2010<br />
Source: Company data, <strong>Danske</strong> Markets<br />
Credit metrics<br />
SEKm<br />
80.000<br />
70.000<br />
60.000<br />
50.000<br />
40.000<br />
30.000<br />
20.000<br />
10.000<br />
0<br />
2011 2012 2013 2014 2015 2016+<br />
2006 2007 2008 2009 2010<br />
Net sales EBITDA EBITDA margin<br />
Packaging<br />
27%<br />
Forest<br />
Products<br />
15%<br />
Personal<br />
Care<br />
22%<br />
Tissue<br />
36%<br />
2006 2007 2008 2009 2010<br />
Net debt Equity Net debt/EBITDA<br />
Source: Company data, <strong>Danske</strong> Markets<br />
16%<br />
15%<br />
14%<br />
13%<br />
12%<br />
3,5<br />
3,0<br />
2,5<br />
2,0<br />
1,5<br />
1,0<br />
0,5<br />
0,0<br />
139 | 13 April 2011<br />
www.danskeresearch.com
<strong>Scandi</strong> Handbook<br />
Credit metrics commensurate with current ratings<br />
Despite some additional build-up of working capital, cash flow remained solid during<br />
Q4 10. Net debt amounted to SEK34.4bn at year end compared with SEK40.4bn end<br />
2009. An 8% increase in the dividend to SEK4.00 per share (SEK2.8bn) is acceptable<br />
from a credit perspective, in our view. The debt/equity ratio was 51% at year<br />
end compared with 60% end 2009 and a long-term target of 70%. Over the last quarters,<br />
SCA has gradually closed the gap to S&P’s expectation of FFO to adjusted net<br />
debt around 30-35% (34% end 2010) for the BBB+ rating.<br />
SCA expects the favourable demand conditions to continue and does not expect pulp<br />
prices to rise further (SCA is net short pulp). The company plans to raise newsprint<br />
paper prices more than 20% in 2011 (positive spill over to Norske Skog etc.) and<br />
aims to enter the Brazilian personal hygiene market through an acquisition or joint<br />
venture. We do not view larger debt-funded acquisitions as consistent with the current<br />
rating.<br />
Attractive long-term demand outlook<br />
In the longer term, the demographic development towards ageing populations in<br />
developed countries and growth in emerging markets support demand for personal<br />
care products. However, the product mix could change towards simpler grades, as<br />
SCA reports greater price sensitivity among customers and rising cost consciousness<br />
in the public healthcare sector. The strategy of growing the hygiene business will<br />
increasingly position SCA as a consumer product company and less as a forest product<br />
company, which reduces cyclical dependence. In April 2010, SCA closed the<br />
divestment of the Asian packaging operation to International Paper, for a cash consideration<br />
of USD200m.<br />
Recommendation<br />
We are positive on SCA’s large exposure to the relatively resilient and profitable<br />
hygiene operations, but carefully monitor the ability to offset surged pulp and input<br />
costs with higher selling prices, given the increased price consciousness in the public<br />
sector in particular. We expect credit metrics to remain commensurate with the<br />
BBB+ rating, despite our expectation of lower FOCF over the coming 12 months.<br />
The main risks for debt investors, in our view, are further increases in pulp prices<br />
(not our main scenario, although we do not expect a hard landing either) and large<br />
debt-financed acquisitions to capture growth opportunities and increase the geographical<br />
scope of the hygiene operations.<br />
The 5y CDS on SCA is very illiquid, which is partially explained by low hedging<br />
demand, as the only Eurobond matured in March 2011 and was by far covered by<br />
available facilities. The 5y CDS is too tight, in our view (although this is partially<br />
explained by few deliverable assets into the CDS), and we recommend buying protection<br />
on SCA around 63/68bp. If SCA were to print a new Eurobond, it could mark<br />
an opportunity to turn more positive on the name. We view the liquidity profile as<br />
adequate but see SCA as a likely new issue candidate to refinance the matured<br />
EUR700m Eurobond without putting the full weight on credit facilities.<br />
140 | 13 April 2011<br />
www.danskeresearch.com
<strong>Scandi</strong> Handbook<br />
Financial data SCA<br />
Key figures (SEKm) 2006 2007 2008 2009 2010<br />
Net Sales 101,439 105,913 110,449 110,857 109,142<br />
EBITDA 14,538 15,976 14,753 15,018 15,001<br />
EBIT 8,505 9,847 8,554 8,190 8,677<br />
Net interest expenses 1,708 1,910 2,317 1,644 1,116<br />
Net profit 5,432 7,167 5,598 4,830 5,592<br />
FFO (1) 9,251 11,034 9,347 11,974 12,057<br />
FFO (adj. for op. leases) 10,153 11,955 10,218 12,964 13,161<br />
Capex 7,081 6,991 8,635 7,215 6,370<br />
EBITDA-Capex 7,457 8,985 6,118 7,803 8,631<br />
RCF 7,568 9,016 7,090 10,466 10,504<br />
FCF (3) 264 -195 -2,435 5,568 1,988<br />
Net debt (4) 36,399 37,368 47,002 40,430 34,406<br />
Adjusted net debt (5) 41,339 41,713 51,576 44,980 38,917<br />
Equity (excl. minorities) 58,963 64,279 67,252 67,906 67,821<br />
Total debt 38,389 42,433 52,029 44,104 36,506<br />
Total capital (6) 97,352 106,712 119,281 112,010 104,327<br />
Ratios<br />
EBITDA margin (%) 14% 15% 13% 14% 14%<br />
Capex/Net revenues (%) 7% 7% 8% 7% 6%<br />
EBITDA/Net interest expenses (x) 8.5x 8.4x 6.4x 9.1x 13.4x<br />
Adj net debt/EBITDA (x) 2.8x 2.6x 3.5x 3.0x 2.6x<br />
Net debt/EBITDA (x) 2.5x 2.3x 3.2x 2.7x 2.3x<br />
FFO(adj)/Adjusted net debt 25% 29% 20% 29% 34%<br />
RCF/Adjusted net debt 18% 22% 14% 23% 27%<br />
Net debt/Equity (%) 62% 58% 70% 60% 51%<br />
Net debt/Total capital (%) 37% 35% 39% 36% 33%<br />
Adjusted net debt/Total capital (%) 42% 39% 43% 40% 37%<br />
(1) Funds from operations. (2) FFO less dividends. (3) RCF less capex and changes in working capital (4) Total interest-bearing debt less cash and marketable<br />
securities. (5) Net debt adjusted contingent liabilities/contractual obligations as reported. (6) Equity and unadjusted total debt. Source: <strong>Danske</strong> Markets<br />
Quarterly review (SEKm)<br />
Q4 09 Q1 10 Q2 10 Q3 10 Q4 10<br />
Net sales 27,507 26,722 27,652 27,204 27,564<br />
Clean-EBITDA 4,265 3,643 4,134 4,113 4,144<br />
Clean-.EBITDA margin (%) 16% 14% 15% 15% 15%<br />
Net income 1,727 1,083 1,601 1,741 1,680<br />
Net debt 40,430 37,713 40,846 38,014 34,406<br />
Adjusted net debt 44,980 42,263 45,396 42,564 38,917<br />
Adj net debt/LTM EBITDA (x) 3.0 2.6 2.7 2.6 2.6<br />
Source: Company data, <strong>Danske</strong> Markets<br />
Divisional quarterly overview (SEKm)<br />
Q4 09 Q1 10 Q2 10 Q3 10 Q4 10<br />
Personal Care Net sales 6,393 6,109 6,418 6,125 6,375<br />
EBIT margin 14% 12% 12% 11% 12%<br />
Tissue Net sales 10,338 9,728 10,064 9,924 10,154<br />
EBIT margin 9% 7% 8% 8% 8%<br />
Packaging Net sales 6,960 7,253 7,583 7,392 7,405<br />
EBIT margin 2% 3% 4% 7% 8%<br />
Forest Products Net sales 4,201 4,110 4,308 4,415 4,290<br />
EBIT margin 16% 12% 16% 16% 14%<br />
Source: Company data, <strong>Danske</strong> Markets<br />
141 | 13 April 2011<br />
www.danskeresearch.com
<strong>Scandi</strong> Handbook<br />
Stora Enso<br />
Company overview<br />
Stora Enso is one of the three largest diversified forest product companies globally<br />
with leading positions in newsprint, fine paper, magazine paper, consumer board,<br />
packaging and wood products. End-2010, Stora Enso had 26,400 employees and<br />
almost 90 production facilities in more than 35 countries, with sales mainly focused<br />
on Europe. The company enjoys a stronger-than-average cost position supported by<br />
relatively efficient machinery and a relatively high degree of vertical integration into<br />
the key inputs of fibre, energy and pulp. The largest owners are Foundation Asset<br />
Management (the Wallenberg family) with 10% of shares and 27% of votes and the<br />
Finnish state (Solidium Oy) with 12% of shares and 25% of votes.<br />
Key credit considerations<br />
Well-diversified operations only partially mitigate strong cyclicality<br />
Stora Enso has a well-diversified product mix and enjoys leading market positions in<br />
newsprint, magazine paper, fine paper and packaging. Demand patterns across different<br />
forest products overlap but are only partially correlated, offering some diversification<br />
benefits. The company has reasonably sound geographical diversification of<br />
sales with a bias toward Europe. This partially mitigates exposure to the highly competitive,<br />
capital-intensive, commoditised, fragmented and cyclical forest product<br />
industries. Pricing power is generally weak, increasing the exposure to input cost<br />
volatility.<br />
Relatively strong operational efficiency and vertical integration<br />
Stora Enso benefits from relatively low-cost production capabilities driven by significant<br />
economies of scale and relatively efficient machinery. Vertical integration<br />
into key inputs is relatively high with Stora Enso being self-sufficient in pulp, around<br />
60% self-sufficient in energy and about 10% in fibre. Stora Enso benefits from increased<br />
low-cost eucalyptus-based pulp sourcing from Latin American assets. We<br />
expect the company to further downsize high-cost Finnish capacity in the medium<br />
term, as Stora’s new large 1.3m t/a Uruguayan pulp mill is expected to be operational<br />
by the end of Q1 13. We view that the eucalyptus-based pulp mill will further<br />
diversify and strengthen Stora Enso’s raw material supply and access to low-cost<br />
pulp.<br />
Improving demand and pricing in 2010, but also increasing costs<br />
Years of structural supply and demand challenges created a weak point of departure<br />
heading into the financial crisis. Around 50% of Stora Enso’s sales in 2010 were<br />
derived from the graphic paper segments of newsprint, magazine and coated fine<br />
paper exhibiting strong cyclicality. However, Stora Enso also has a strong presence<br />
in the relatively more stable and profitable consumer and industrial packaging segments,<br />
representing around 30% of sales in 2010. Among the different forest product<br />
categories where Stora Enso is active, conditions in packaging are currently recovering<br />
the most while newsprint remains challenging despite increasing prices in the<br />
recent round of contract negotiations. Overall, demand recovered moderately in 2010<br />
from very weak levels and, where possible, producers are implementing price increases<br />
following increased input costs (notably pulp) and increased capacity utilisation.<br />
Credit metrics are strong for the current BB rating<br />
The company has made significant portfolio revisions in recent years, incl. the disposal<br />
of the North American operations for USD2.5bn in late-2007 and the merchant<br />
business operations Papyrus for EUR640m in April 2008. The lion’s share of the<br />
proceeds has been used for debt reduction. Recently, Stora has announced large<br />
investments in both Uruguay (50% of EUR1.4bn) and Poland (EUR285m). We view<br />
credit metrics as strong for the rating, but we do not expect this to improve much<br />
further.<br />
142 | 13 April 2011<br />
SELL<br />
Sector: Paper & Forest Products<br />
Corporate ticker: STORA<br />
Equity ticker: STERV FH<br />
Market cap: EUR7bn<br />
Ratings:<br />
Moodys rating: Ba2 / PO<br />
S&P rating: BB / PO<br />
Fitch rating: BB / S<br />
Analysts:<br />
Kristian Myrup Pedersen<br />
kripe@danskebank.dk<br />
+45 45 12 85 19<br />
Asbjørn Purup Andersen<br />
apu@danskebank.dk<br />
+45 45 14 88 86<br />
Key credit issues<br />
Strengths:<br />
• Leading market positions and<br />
benefits from economies of scale.<br />
• High diversification across forest<br />
product categories.<br />
• Relatively cost efficient machinery.<br />
• Increased integration with lowcost<br />
Latin American pulp sourcing.<br />
Challenges:<br />
• Exposed to highly competitive,<br />
commoditised and cyclical forest<br />
product industry.<br />
• Structural demand challenges and<br />
excess capacity in some segments<br />
• Exposure to input cost volatility<br />
and limited pricing power.<br />
• Weak and cyclical credit metrics.<br />
Source: <strong>Danske</strong> Markets<br />
www.danskeresearch.com
<strong>Scandi</strong> Handbook<br />
Liquidity<br />
As of end-2010, Cash and equivalents amounted to an impressive EUR1.1bn, up<br />
from EUR890m and EUR416m in 2009 and 2008. However, FOCF was down to<br />
EUR277m from EUR721m in 2009. Stora’s previous liquidity reserve, a EUR1.4bn<br />
committed credit facility maturing 2012, has been refinanced with a EUR700m<br />
committed credit facility agreement, effective from January 2011 and maturing in<br />
January 2014. The new facility is free of covenants. Stora also has access to various<br />
sources of funding of up to EUR700m. This compares with EUR750m and<br />
EUR260m of debt maturing in 2010 and 2011. We view the liquidity profile as<br />
strong.<br />
Stora Enso has successfully accessed debt capital markets on several occasions in<br />
2009 and 2010. In May 2009, Stora effectively reopened the European HY market, as<br />
it made a EUR232m tap of its existing 5.125% 2014 bond priced with a huge discount.<br />
Most recently, Stora Enso issued two five-year bonds totalling SEK2.3bn in<br />
August 2010 and in November 2010 it tapped them for an additional SEK1.5bn.<br />
Current performance drivers<br />
Continued improvement in market conditions<br />
2010 was a strong year for Stora Enso, primarily due to a significantly improved<br />
operating environment. Sales and earnings clearly tell the story, as net sales and net<br />
profit increased to EUR10.2bn and EUR 0.8bn, respectively, compared with<br />
EUR8.9bn and losses of EUR0.9bn the year before. From a cash flow perspective,<br />
the underlying cash generation improved too, as FFO increased to EUR1.1bn compared<br />
with EUR 0.7bn the year before. However, primarily due to increasing net<br />
working capital, FOCF decreased to EUR277m from EUR721m the year before,<br />
albeit still positive.<br />
Debt maturity profile (end-10)<br />
EURm<br />
1800<br />
1600<br />
1400<br />
1200<br />
1000<br />
800<br />
600<br />
400<br />
200<br />
0<br />
2011 2012 2013 2014 2015 2016+<br />
Source: Company data and <strong>Danske</strong> Markets<br />
Profitability<br />
EURm<br />
15.000<br />
20%<br />
13.000<br />
11.000<br />
15%<br />
9.000<br />
7.000<br />
10%<br />
5.000<br />
3.000<br />
5%<br />
1.000<br />
-1.000<br />
0%<br />
2006 2007 2008 2009 2010<br />
Net sales EBITDA EBITDA margin<br />
Source: Company data and <strong>Danske</strong> Markets<br />
In Q4 10, Stora Enso reported sales of EUR2.7bn (up 12% y/y and 2% q/q) in line<br />
with expectations and net profit of EUR313m (significantly up sequentially and<br />
compared with last year) somewhat ahead of expectations. However, net profit was<br />
significantly improved by a EUR238m net reversal of impairments. Clean EBITDA<br />
improved 27% y/y but declined 21% sequentially to EUR289m, resulting in a margin<br />
of 10.8%. Clean EBITDA sequentially declined as higher sales prices in local currencies<br />
did not fully compensate for higher costs, especially for maintenance and<br />
lower volumes. Maintenance costs were EUR34m higher sequentially and volume<br />
lost due to maintenance decreased operating profit by EUR20m.<br />
Sales by segment 2010<br />
Industrial<br />
Packaging<br />
9%<br />
Wood<br />
Products<br />
16%<br />
Newsprint<br />
and Book<br />
Paper<br />
13%<br />
Magazine<br />
19%<br />
Cash flow remained solid during the Q4 despite a modest build-up of net working<br />
capital. Net debt amounted to EUR2.4bn end-2010 and cash and cash equivalents<br />
remained strong at EUR1.1bn. Adjusted net debt/EBITDA improved to 2.6x, and<br />
adjusted FFO/net debt was 33% at end-2010. Demand for European newsprint is<br />
expected to be slightly weaker in 2011, while European prices are expected to return<br />
to the much higher 2009 levels. European magazine paper prices and demand are<br />
expected higher, while fine paper prices and demand are expected to be unchanged.<br />
Stora Enso expects to fully offset 3% 2011 input cost inflation. In its short-term<br />
outlook, Stora Enso expects Q1 11 clean operating profit to sequentially improve.<br />
Credit metrics are improving and are now strong for current ratings<br />
LTM FFO/adjusted net debt improved massively to 33% after Q4 10 (28% after Q2<br />
10 and 20% after Q4 09) while LTM FOCF/adjusted net debt fell to 13% (22% after<br />
Q2 10 and 26% after Q4 09). However, this FOCF phenomenon is actually not all<br />
that negative, as it is due to increased net working capital arising from the much<br />
higher activity level in 2010 compared with 2009. Capex is broadly unchanged at<br />
EUR377m in 2010 compared to EUR389 in 2009. Adjusted net debt to LTM<br />
EBITDA improved to 2.6x from 3.3x after Q2 10 and 4.2x after Q4 09.<br />
Consumer<br />
Board<br />
23%<br />
Source: Company data and <strong>Danske</strong> Markets<br />
Credit metrics<br />
EURm<br />
9.000<br />
8.000<br />
7.000<br />
6.000<br />
5.000<br />
4.000<br />
3.000<br />
2.000<br />
1.000<br />
0<br />
Fine Paper<br />
20%<br />
2006 2007 2008 2009 2010<br />
Net debt Equity Net debt/EBITDA<br />
Source: Company data and <strong>Danske</strong> Markets<br />
3,5<br />
3,0<br />
2,5<br />
2,0<br />
1,5<br />
1,0<br />
0,5<br />
0,0<br />
143 | 13 April 2011<br />
www.danskeresearch.com
<strong>Scandi</strong> Handbook<br />
We would not be surprised to see both Moody’s and S&P upgrade Stora Enso one<br />
notch to Ba1/BB+ during 2011, as current credit metrics are strong for the ratings,<br />
highlighted by the positive outlook from S&P on 15 December 2010. However, we<br />
do not expect credit metrics to further improve from current levels as Stora Enso<br />
expects 2011 capex to increase to EUR550m (from EUR400m in 2011). Furthermore,<br />
the company must inject about EUR280m in equity into the Uruguayan Montes<br />
del Plata joint venture to partially finance the new large 1.3m tonnes pulp mill<br />
expected to be operational in 2013 (see more below). While supportive of the longterm<br />
business risk profile, we see the pulp mill investment as moderately increasing<br />
Stora Enso’s medium-term financial risk profile.<br />
Latin American assets and the shutdown of Finnish capacity<br />
In October 2009, Stora Enso completed the acquisition of about 130,000 hectares of<br />
land and plantations in Uruguay. The acquisition was carried out on a 50:50 basis<br />
with Stora’s partner in Brazil, Arauco, and the enterprise value amounted to<br />
USD344m. On 4 February 2010, Stora Enso and Arauco’s joint venture company in<br />
Uruguay, Montes del Plata, initiated a feasibility study for an associated new pulp<br />
mill. Then, on 18 January 2011, Stora Enso announced that Montes del Plata will<br />
build a new large 1.3m tonnes per year Uruguayan pulp mill. The project, comprising<br />
a state-of-the-art pulp mill, a deepwater port and a power generation unit, is expected<br />
to be operational by the end of Q1 13 and will add an impressive 2% to Uruguay’s<br />
GDP. The total investment is estimated to be EUR1.4bn, and each joint venture<br />
owner will be entitled to half of the mill’s output. The investment is 60% debtfinanced<br />
through loans raised by Montes del Plata (guaranteed by parents) while the<br />
residual 40% is financed through equity (50:50 split between Stora Enso and<br />
Arauco). We view that the new eucalyptus-based pulp mill will further diversify and<br />
strengthen Stora Enso’s raw material supply and access to low-cost pulp. Stora Enso<br />
announced material reductions in its high-cost Finnish manufacturing base in August<br />
2009. About 450-1,100 employees in Finland would be affected by the plans and the<br />
targeted annual operating profit improvement is estimated in the range of EUR140-<br />
160m. We expect the company to further downsize high-cost Finnish capacity in the<br />
medium term.<br />
Recommendation<br />
We are positive on Stora Enso’s relatively low-cost production capabilities driven by<br />
significant economies of scale, relatively efficient machinery and fair integration into<br />
key inputs. Credit metrics are strong for the BB rating. While several things indicate<br />
that the tailwind from a sharply rising pulp price is currently losing momentum, we<br />
do not expect a hard landing for the pulp price.<br />
We maintain a SELL recommendation on Stora Enso (STERV’14 trading around<br />
ASW +134/115bp) and recommend buying the 5y CDS (around 210/215bp). We see<br />
current spreads as too tight relative to a curve of BB industrials (prices more like a<br />
BBB- general industrial) and do not believe that current pricing adequately reflects<br />
risk factors inherent in the paper and forest industry.<br />
144 | 13 April 2011<br />
www.danskeresearch.com
<strong>Scandi</strong> Handbook<br />
Financial data Stora Enso<br />
Key figures (EURm) 2006 2007 2008 2009 2010<br />
Net Sales 14,594 13,374 11,029 8,945 10,297<br />
EBITDA 1,848 1,455 1,027 823 1,217<br />
EBIT excl non-rec items 757 1,172 388 321 754<br />
Net interest expenses 225 169 167 279 101<br />
Net profit 589 -215 -675 -878 769<br />
FFO (1) 1,168 1,231 531 665 1,084<br />
Capex 583 784 706 389 377<br />
EBITDA-Capex 1,265 671 321 399 840<br />
RCF (2) 812 876 176 507 926<br />
FCF (3) 518 -239 -449 721 277<br />
Net debt (4) 4,234 2,955 3,124 2,594 2,410<br />
Adjusted net debt (5) 5,447 3,923 3,983 3,360 3,199<br />
Equity (incl. minorities) 7,903 7,548 5,651 5,183 6,255<br />
Total debt 5,247 4,441 4,076 3,937 4,004<br />
Total capital (6) 13,150 11,989 9,727 9,119 10,259<br />
Ratios<br />
EBITDA margin (%) 13% 11% 9% 9% 12%<br />
Capex/Net revenues (%) 4% 6% 6% 5% 4%<br />
EBITDA/Net interest expenses (x) 8.2x 8.6x 6.1x 2.9x 12.0x<br />
Adj. net debt/EBITDA (x) 2.9x 2.7x 3.9x 4.1x 2.6x<br />
Net debt/EBITDA (x) 2.3x 2.0x 3.0x 3.2x 2.0x<br />
FFO/Adjusted net debt (x) 21% 31% 13% 20% 34%<br />
RCF/Adjusted net debt (x) 15% 22% 4% 15% 29%<br />
Net debt/Equity (%) 54% 39% 55% 50% 39%<br />
Net debt/Total capital (%) 32% 25% 32% 28% 23%<br />
(1) Funds from operations. (2) FFO less dividends. (3) RCF less capex and changes in working capital (4) Total interest-bearing debt less cash and marketable<br />
securities. (5) Net debt adjusted contingent liabilities/contractual obligations as reported. (6) Equity and unadjusted total debt. Source: <strong>Danske</strong> Markets<br />
Overview (EURm)<br />
Q4 09 Q3 10 Q4 10 yr/yr qtr/qtr<br />
Net sales 2,399 2,624 2,685 12% 2%<br />
EBITDA 227 382 289 27% -24%<br />
EBIT 138 255 167 21% -35%<br />
Net financial expenses -25 -52 -22 -12% -58%<br />
Net income 46 194 313 582% 61%<br />
Capex 102 74 139 37% 89%<br />
EBITDA capex 125 308 150 20% -51%<br />
Total debt 3,937 4,058 4,011 2% -1%<br />
Net debt 2,594 2,445 2,410 -7% -1%<br />
Equity (incl. minorities) 5,183 5,782 6,255 21% 8%<br />
Adj. net debt/LTM EBITDA (x) 4.2x 2.8x 2.6x<br />
LTM FFO/Adj. net debt (%) 19.8% 34.6% 33.3%<br />
LTM FOCF/Adj. net debt (%) 26.2% 24.5% 12.6%<br />
Source: Company data and <strong>Danske</strong> Markets<br />
145 | 13 April 2011<br />
www.danskeresearch.com
<strong>Scandi</strong> Handbook<br />
UPM-Kymmene<br />
Company overview<br />
Finnish group UPM-Kymmene is among the top three diversified forest products<br />
companies in the world, with world-leading positions in magazine paper (roughly<br />
20% of global market), newsprint and fine paper. It also holds strong positions in<br />
label materials and wood products. UPM has market-leading operating efficiency and<br />
asset quality. In 2010, it had production facilities in 15 countries and employed<br />
22,000 people. While its products are sold worldwide, UPM’s most important market<br />
is Europe, accounting for 69% of sales in 2010. UPM has a very diversified and<br />
international shareholder structure with no majority owner.<br />
Key credit considerations<br />
Well-diversified operations only partially mitigate strong cyclicality<br />
UPM has a well-diversified product mix with global-leading positions in the magazine<br />
paper, newsprint and fine paper segments. It also has strong positions in the<br />
specialty segment of self-adhesive label materials, as well as in wood products (plywood<br />
and sawn timber). Sales have reasonably good geographical diversification<br />
with Europe, Asia, the US and Rest of the World accounting for 69%, 14%, 12% and<br />
5% of sales, respectively, in 2010. This partially mitigates exposure to the highly<br />
competitive, capital-intensive, commoditised, fragmented and cyclical nature of<br />
forest product industries. Demand patterns across different forest products overlap<br />
but are only partially correlated, offering some diversification benefits. Pricing power<br />
is generally weak, increasing the exposure to input cost volatility.<br />
Leading operational efficiency and vertical integration<br />
UPM benefits from substantial economies of scale, a low cost base, best-in-class<br />
asset quality and a high degree of vertical integration into key inputs. UPM is currently<br />
self-sufficient in pulp and 93% self-sufficient in energy, through ownership<br />
stakes in part-owned energy companies that entitle UPM to acquire power at generation<br />
cost. Its own wood resources are limited however, and UPM is only 25% selfsufficient<br />
in fibre. In December 2009, Metsä-Botnia and its owners (M-real 30%,<br />
Metsäliitto 53%, UPM 17%) closed a restructuring of asset ownership. The transaction<br />
further diversified and strengthened UPM’s raw material supply and access to<br />
low-cost eucalyptus pulp.<br />
Improving demand and pricing in 2010, but also increasing costs<br />
Years of structural supply and demand challenges created a weak point of departure<br />
heading into the financial crisis. Graphic paper (newsprint, magazine and coated fine<br />
paper) represented almost 70% of UPM’s 2010 sales. These segments are generally<br />
more cyclical and suffer from a greater structural decline in demand than most other<br />
forest product categories. Overall, demand recovered moderately from very weak<br />
levels throughout 2010, and where possible producers are implementing price increases<br />
following higher input costs (notably pulp) and increased capacity utilisation.<br />
HOLD<br />
Sector: Paper & Forest Products<br />
Corporate ticker: UPMKYM<br />
Equity ticker: UPM1V FH<br />
Market cap: EUR8bn<br />
Ratings:<br />
Moodys rating: Ba1 / S<br />
S&P rating: BB / S<br />
Fitch rating: BB / S<br />
Analyst:<br />
Kristian Myrup Pedersen<br />
kripe@danskebank.dk<br />
+45 45128519<br />
Asbjørn Purup Andersen<br />
apu@danskebank.dk<br />
+45 45148886<br />
Key credit issues<br />
Strengths:<br />
• Leading market positions, benefits<br />
from economies of scale<br />
• Leading cost efficiency<br />
• Wide diversification across forest<br />
product categories<br />
• High integration in energy and lowcost<br />
Latin American pulp sourcing<br />
Challenges:<br />
• Exposed to highly competitive,<br />
commoditised and cyclical forest<br />
products industry<br />
• Structural demand challenges and<br />
excess capacity in some segments<br />
• Exposure to input cost volatility<br />
and limited pricing power<br />
• Weak and cyclical credit metrics<br />
Source: <strong>Danske</strong> Markets<br />
Myllykoski acquisition<br />
On 21 December 2010, UPM announced an agreement to acquire Myllykoski, including<br />
alliance partner Rhein Papier GmbH, for a total enterprise value of<br />
EUR900m. While a number of issues remain to be resolved, including approval from<br />
regulatory authorities, a transaction would finally bring some much-needed consolidation<br />
in the European publication paper sector (more details below).<br />
146 | 13 April 2011<br />
www.danskeresearch.com
<strong>Scandi</strong> Handbook<br />
Liquidity<br />
As of end-2010, UPM had cash and cash equivalents amounting to EUR269m and<br />
two unused committed credit facilities of EUR1bn and EUR825m, respectively. The<br />
EUR1bn facility – with maturity in March 2012 – was refinanced with a new 5Y<br />
EUR0.5bn facility in March 2011. According to UPM, the facility is halved in size,<br />
as UPM does not need such large back-up facilities. S&P expects UPM to maintain<br />
considerable headroom in respect of a financial covenant (undisclosed) related to the<br />
EUR825m facility. LTM FOCF after 2010 was strong and amounted to EUR725m.<br />
This compares with around EUR600m of debt maturing in 2011, EUR850m in 2012<br />
and EUR250m in 2013. We view the liquidity profile as solid.<br />
Current performance drivers<br />
Strong operating performance in 2010<br />
As for most other pulp and paper companies, 2010 was a strong year for UPM, and<br />
net sales increased by 16% to EUR9bn, primarily driven by volumes. Clean EBIT<br />
and net profit improved by 171% to EUR731m and 232% to EUR561m, respectively.<br />
UPM reported Q4 10 sales and net profit marginally ahead of consensus expectations.<br />
Sales increased 12% y/y to EUR2.4bn, but clean EBITDA declined 12% y/y to<br />
EUR318m as higher variable and fixed costs combined with increased maintenance<br />
outweighed a 3% y/y increase in the average EUR paper price and increased volumes.<br />
As a result, the clean EBITDA margin decreased to 13.5%, from 16.6% in the<br />
previous quarter and 17.2% in the same period last year. A 3% increase in paper<br />
deliveries did not prevent a continued clean operating loss in the Paper segment due<br />
to higher raw material costs, manifesting the desperate need for additional price<br />
increases. This was only partially offset by improved performance in the Pulp segment.<br />
Cash flow remained solid during the quarter, resulting in a further reduction in net<br />
debt to EUR3.3bn. Credit metrics marginally improved sequentially, as reflected in<br />
adjusted net debt/EBITDA of 2.9x (3.0x after Q3 10, 4.0x at end-2009). The dividend<br />
for 2010 is increased to EUR0.55/share, from EUR0.45/share in 2009.<br />
UPM gave an optimistic H1 11 outlook in its annual report, as it expects sales prices<br />
to increase, especially in paper, while volumes across the group’s business areas are<br />
expected to either remain stable or increase. UPM sees variable cost inflation moderating<br />
from the pace in 2010. All in all, this leads UPM to expect clean EBIT to be<br />
clearly higher in H1 11 than in H1 10.<br />
Myllykoski acquisition more details<br />
After UPM confirmed in September 2010 that it was in discussions to acquire<br />
Myllykoski, on 21 December 2010 it announced an agreement to acquire Myllykoski<br />
including alliance partner Rhein Papier GmbH for a total enterprise value of<br />
EUR900m. This price tag is in line with our previous expectations. The transaction,<br />
which is subject to customary closing conditions and is expected to close during Q3<br />
11, consists of seven publication paper mills in Germany, Finland and the US, with a<br />
total annual capacity of 2.8m tonnes, and 0.8% of the Finnish energy company PVO.<br />
UPM expects EUR100-150m in restructuring costs and will recognise a EUR300m<br />
one-off gain from the transaction.<br />
Debt maturity profile (end-10)<br />
EURm<br />
Source: Company data, <strong>Danske</strong> Markets<br />
Profitability<br />
EURm<br />
Source: Company data, <strong>Danske</strong> Markets<br />
Sales by segments, 2010<br />
Source: Company data, <strong>Danske</strong> Markets<br />
Credit metrics<br />
EURm<br />
1800<br />
1600<br />
1400<br />
1200<br />
1000<br />
800<br />
600<br />
400<br />
200<br />
0<br />
12.000<br />
10.000<br />
8.000<br />
6.000<br />
4.000<br />
2.000<br />
0<br />
8.000<br />
7.000<br />
6.000<br />
5.000<br />
4.000<br />
3.000<br />
2.000<br />
1.000<br />
0<br />
2011 2012 2013 2014 2015 2016+<br />
2006 2007 2008 2009 2010<br />
Net sales EBITDA EBITDA margin<br />
Plywood<br />
4%<br />
Label<br />
12%<br />
Other<br />
1%<br />
Energy<br />
3% Pulp<br />
4%<br />
Forest and<br />
timber<br />
8%<br />
Paper<br />
68%<br />
2006 2007 2008 2009 2010<br />
Net debt Equity Net debt/EBITDA<br />
Source: Company data, <strong>Danske</strong> Markets<br />
20%<br />
15%<br />
10%<br />
5%<br />
0%<br />
4,0<br />
3,5<br />
3,0<br />
2,5<br />
2,0<br />
1,5<br />
1,0<br />
0,5<br />
0,0<br />
Myllykoski is a private, family-owned company operating in coated and uncoated<br />
magazine paper (European top three) and newsprint. Myllykoski is a medium-sized<br />
European non-integrated producer and as a result it has been severely impacted by<br />
weak pricing power and sharply increased input costs over the last 18 months. Credit<br />
metrics are extremely weak, and according to Fitch the company is operating under a<br />
12-month extension negotiated with creditors in March 2010. While creating some<br />
shorter-term risks to the business risk profile (execution and integration risks, etc.),<br />
147 | 13 April 2011<br />
www.danskeresearch.com
<strong>Scandi</strong> Handbook<br />
we believe that the rationale behind including target assets into UPM’s verticallyintegrated<br />
operations makes sense and strengthens its business risk profile. As<br />
Myllykoski is not self-sufficient in pulp, UPM is likely to end up being net short in<br />
pulp. UPM estimates annual synergies exceeding EUR100m from 2012. Furthermore,<br />
increased consolidation within the troubled European magazine paper and<br />
newsprint segments improves pricing power and supply discipline, with clear benefits<br />
for UPM and sector peers. It could also trigger further consolidation in the sector.<br />
Credit metrics in line with BB rating also after Myllykoski transaction<br />
S&P downgraded UPM from BB+ to BB in February 2010. For the current rating,<br />
S&P expects FFO to adjusted net debt of 20% and adjusted net debt to EBITDA of<br />
3.5x. After FY 10, LTM FFO to adjusted net debt improved to 29% (17% after FY<br />
09), while LTM FOCF to adjusted net debt softened to 19% (24% after FY 09). Adjusted<br />
net debt to LTM EBITDA improved to 2.9x (4.0x after FY 09).<br />
The Myllykoski transaction will be financed through approx. EUR60m equity (a<br />
directed share issued of 5m UPM shares) and EUR800m in new bank loans with an<br />
average maturity exceeding five years and no financial covenants. The gearing ratio<br />
is estimated by the UPM to increase by 8 percentage point (46% at end-2010 and<br />
56% at end-2009). We only expect adjusted net debt/EBITDA to soften by around<br />
0.1x as a consequence of this transaction (2.9x at end-2010), and we would therefore<br />
be surprised to see negative rating actions, also considering the gradual strengthening<br />
of credit metrics throughout 2010. This view is in line with the stable outlooks assigned<br />
by all three rating agencies.<br />
Asset ownership restructuring increases access to low-cost pulp<br />
In July 2009, Metsä-Botnia and its owners signed a letter of intent regarding an asset<br />
restructuring, and the transaction closed in December 2009. Broadly speaking,<br />
UPM’s net debt increased by around 10%, while the company gained relatively<br />
cheap full ownership of attractive low-cost eucalyptus-based assets. In particular,<br />
Metsä-Botnia’s and Metsäliitto’s shares of the Fray Bentos pulp mill and Forestal<br />
Oriental plantation forestry company were acquired by UPM. In addition, UPM<br />
acquired 1.2% of the energy company PVO from Metsä-Botnia. After the transaction,<br />
Metsa-Botnia is owned 30% by M-real, 53% by Metsäliitto and 17% by UPM,<br />
while M-real is compensated through a cash payment and debt transfer. The transaction<br />
further diversifies and strengthens UPM’s raw material supply and access to<br />
important low-cost eucalyptus pulp. It lowers UPM’s pulp capacity at Metsä-Botnia’s<br />
higher-cost Finnish mills by 700,000 tonnes, while increasing its low-cost eucalyptus<br />
pulp production by approximately 500,000 tonnes. The Uruguayan mill is UPM’s<br />
largest.<br />
Recommendation<br />
We are positive on UPM’s substantial economies of scale, low cost base, best-inclass<br />
asset quality and high degree of vertical integration into key inputs. Credit<br />
metrics have recently moved in line with expectations for the BB rating. While several<br />
things indicate that the tailwind from a sharply rising pulp price is currently<br />
losing momentum, we do not expect a hard landing for the pulp price.<br />
We keep a HOLD recommendation on UPMKYM ’12 (around ASW +74/10bp) and<br />
the 5Y CDS, trading around 215/220bp. While the Myllykoski-acquisition is mainly<br />
bank debt financed, we expect it to be managed within current ratings and not directly<br />
result in new debt capital market supply.<br />
148 | 13 April 2011<br />
www.danskeresearch.com
<strong>Scandi</strong> Handbook<br />
Financial data UPM-Kymmene<br />
Key figures (EURm) 2006 2007 2008 2009 2010<br />
Net Sales 10,022 10,035 9,461 7,719 8,924<br />
EBITDA 1,678 1,546 1,206 1,062 1,343<br />
EBIT (clean) 725 835 513 270 731<br />
Net interest expenses 176 191 202 -62 117<br />
Net profit 275 81 -180 169 561<br />
FFO (1) 1,194 1,071 760 727 1,121<br />
Capex 631 683 532 236 241<br />
EBITDA-Capex 1,047 863 674 826 1,102<br />
RCF (2) 802 679 376 519 887<br />
FCF (3) 192 -208 -288 815 507<br />
Net debt (4) 4,048 3,973 4,321 3,730 3,286<br />
Adjusted net debt (5) 4,746 4,580 4,866 4,299 3,881<br />
Equity (incl. minorities) 7,289 6,783 6,120 6,602 7,109<br />
Total debt 4,345 4,315 5,071 4,464 3,979<br />
Total capital (6) 11,634 11,098 11,191 11,066 11,088<br />
Ratios<br />
EBITDA margin (%) 17% 15% 13% 14% 15%<br />
Capex/Net revenues (%) 6% 7% 6% 3% 3%<br />
EBITDA/Net interest expenses (x) 9.6x 8.1x 6.0x nm 11.5x<br />
Adj. net debt/EBITDA (x) 2.8x 3.0x 4.0x 4.0x 2.9x<br />
Net debt/EBITDA (x) 2.4x 2.6x 3.6x 3.5x 2.4x<br />
FFO/Adjusted net debt 25% 23% 16% 17% 29%<br />
RCF/Adjusted net debt 17% 15% 8% 12% 23%<br />
Net debt/Equity (%) 56% 59% 71% 56% 46%<br />
Net debt/Total capital (%) 35% 36% 39% 34% 30%<br />
Adjusted net debt/Total capital (%) 41% 41% 43% 39% 35%<br />
(1) Funds from operations. (2) FFO less dividends. (3) RCF less capex and changes in working capital (4) Total interest-bearing debt less cash and marketable<br />
securities. (5) Net debt adjusted contingent liabilities/contractual obligations as reported. (6) Equity and unadjusted total debt. Source: Company data, <strong>Danske</strong><br />
Markets<br />
Divisional quarterly overview (EURm)<br />
Q4 09 Q1 10 Q2 10 Q3 10 Q4 10<br />
Energy Net sales 128 174 116 124 153<br />
EBITDA margin 45% 45% 34% 39% 46%<br />
Pulp Net sales 226 341 455 489 413<br />
EBITDA margin 23% 35% 44% 49% 40%<br />
Forest and timber Net sales 348 339 393 387 402<br />
EBITDA margin 9% 1% 7% 5% 1%<br />
Paper Net sales 1,558 1,401 1,540 1,672 1,656<br />
EBITDA margin 14% 5% 5% 4% 4%<br />
Label Net sales 252 260 280 284 276<br />
EBITDA margin 10% 12% 12% 12% 9%<br />
Plywood Net sales 81 76 97 83 91<br />
EBITDA margin 4% -3% 2% 2% -1%<br />
Other Net sales 35 40 51 45 42<br />
EBITDA margin -77% -45% -37% -51% -17%<br />
Source: Company data, <strong>Danske</strong> Markets<br />
149 | 13 April 2011<br />
www.danskeresearch.com
<strong>Scandi</strong> Handbook<br />
150 | 13 April 2011<br />
www.danskeresearch.com
<strong>Scandi</strong> Handbook<br />
Telecoms, Media & Technology<br />
151 | 13 April 2011<br />
www.danskeresearch.com
<strong>Scandi</strong> Handbook<br />
Elisa<br />
Company overview<br />
Elisa Corporation is the largest mobile and fixed-line operator in Finland and also holds<br />
a number two position in the Finnish broadband market. Importantly, Elisa is the dominant<br />
operator in the Helsinki area, where 25% of the Finnish population live and the<br />
large majority of the country’s largest companies are based. Elisa also has some<br />
250,000 cable TV customers and provides mobile services in Estonia. The company is<br />
organised into two main business units: the Consumer Customer business and the Corporate<br />
Customer business. The operations in Estonia and some other independent companies<br />
are separately organised. The largest shareholder in Elisa is the Finnish state,<br />
which, via its investment vehicle Solidium Oy, holds a 10.10% stake in the company.<br />
Since 2003 Elisa has held BBB/Baa2 ratings from S&P and Moody’s, respectively.<br />
Neither S&P nor Moody’s account for any government support in their ratings of Elisa.<br />
Key credit considerations<br />
Strong position in the competitive Finnish telecoms market<br />
Through the Elisa and Saunalahti brands, Elisa currently holds a leading market position<br />
in the Finnish mobile, fixed-line and broadband markets. In the mobile market,<br />
Elisa’s largest competitors are the two other facility-based mobile operators, TeliaSonera<br />
and DNA. Competition in the Finnish mobile market is intense and mobile termination<br />
fees in Finland are among the lowest in Europe. Elisa has tried to position itself as<br />
a high-quality provider of mobile services. The company has an extensive 3G mobile<br />
network and has also launched 4G services in the Helsinki area. Growth prospects in<br />
the Finnish mobile market have recently improved thanks to the rapid take-up of smartphones.<br />
At the end of 2010, some 45% of all new mobile phones sold were smartphones.<br />
At the same time, customer churn remains relatively high due to the intense<br />
campaigning by the various operators.<br />
In the fixed-line business segment there has been both revenue and margin pressure in<br />
recent years as fixed-to-mobile substitution has resulted in lower fixed-line traffic and a<br />
loss of access lines. On the positive side, Elisa is used to operating in this competitive<br />
market environment and has a solid track record when it comes to cost cutting. The<br />
company has also tried to pursue growth opportunities by offering new services such as<br />
IPTV and Information and Communications Technology (ICT) services for companies.<br />
Elisa’s geographic diversification is fairly limited, which means that the company has<br />
large exposure to the general economic development in Finland. The economic situation<br />
in Finland improved in 2010, with good consumer demand and more spending<br />
among corporate customers. Elisa’s only operations of meaningful size outside Finland<br />
are in Estonia, where it has close to 440,000 customers and a market share of around<br />
20%. The main competitors are Eesti Telekom/TeliaSonera and Tele2. The economic<br />
situation in Estonia stabilised in 2010 and is currently showing signs of improvement.<br />
HOLD<br />
Sector: Telecommunication Services,<br />
Diversified Telecom Services<br />
Corporate ticker: ELIAV<br />
Equity ticker: ELI1V FH<br />
Market cap: EUR2.6bn<br />
Ratings:<br />
S&P rating: BBB/S<br />
Moodys rating: Baa2/S<br />
Fitch rating: NR<br />
Analyst:<br />
Louis Landeman<br />
Louis.landeman@danskebank.se<br />
+46 8 568 80524<br />
Jakob Magnussen, CFA<br />
jakob.magnussen@danskebank.dk<br />
+45 45 128503<br />
Key credit issues<br />
Strengths:<br />
• Leading mobile and fixed-line telecom<br />
operator in Finland.<br />
• Solid debt metrics.<br />
• Good track record in cost cutting.<br />
• Low cyclical industry.<br />
Challenges:<br />
• Tough competition in Finnish telecoms<br />
markets.<br />
• Fairly limited geographical diversification.<br />
• Generous dividend pay-out policy.<br />
Source: <strong>Danske</strong> Markets<br />
Elisa has a generous dividend pay-out policy<br />
Elisa has maintained a rather conservative financial policy for several years, aiming to<br />
keep the unadjusted net debt to EBITDA ratio in the 1.5-2.0x range, the equity ratio<br />
above 35%, and a dividend pay-out ratio at 40-60% of net income. At the same time,<br />
the company has pursued a generous dividend pay-out policy. In conjunction with its<br />
Q4 earnings Elisa stated its intention to pursue a dividend payment of EUR0.90 per<br />
share, corresponding to 94% of the financial period’s net result. We expect this trend to<br />
continue. Although the Finnish state only has a minority stake in Elisa, we regard this<br />
holding as important as it could help maintain stable ownership conditions. Elisa’s<br />
4.75% 2014 bond also contains a change of control put covenant.<br />
152 | 13 April 2011<br />
www.danskeresearch.com
<strong>Scandi</strong> Handbook<br />
Liquidity<br />
We regard Elisa’s liquidity position as moderate as the company has a tight balance<br />
between its available liquidity sources and short-term debt maturities. At the end of<br />
2010 Elisa had cash and cash equivalents of EUR32m. The company also had access to<br />
EUR300m in committed credit facilities, of which EUR170m is a revolving credit<br />
facility that matures in June 2012 and EUR130m is a revolving credit facility that matures<br />
in November 2014. The EUR170m facility was undrawn at the end of 2010 while<br />
some EUR32m of the EUR130m facility was utilised. Elisa’s liquidity position is also<br />
supported by its positive free cash flow generation. In 2010 the company generated free<br />
cash flow after capital expenditure (but before dividend payments) of EUR189m.<br />
These liquidity resources can be compared to the short-term debt maturities that<br />
amounted to EUR362m as of end-2010, of which EUR102m was commercial paper,<br />
EUR33m were loans from financial institutions and EUR225m were bonds. Elisa’s<br />
largest debt maturity this year is the EUR225m 4.375% bond that matures in September,<br />
while the company’s other two bonds (worth EUR75m and EUR300m) mature in<br />
2013 and 2014, respectively. As Elisa also has announced plans for a dividend payment<br />
of EUR140m (EUR0.90 per share) plus an additional dividend at a later stage, this<br />
highlights the need for the company to actively refinance its upcoming debt maturities<br />
during the coming quarters in order to maintain a satisfactory liquidity profile.<br />
Current performance drivers<br />
Revenue growth picked up in Q4<br />
Elisa’s Q4 10 report indicates that revenue growth picked up somewhat during the<br />
quarter. At the same time, competition in the Finnish mobile market remains intense.<br />
As is the case with other Nordic telecom operators, increased sales of mobile smartphones<br />
helped to drive growth. The number of traditional fixed-line services continued<br />
to decline at the same time as the number of fixed broadband subscribers increased<br />
slightly.<br />
Debt maturity profile (as of end-2010)<br />
EURm<br />
400<br />
350<br />
300<br />
250<br />
200<br />
150<br />
100<br />
50<br />
0<br />
Source: Company data, <strong>Danske</strong> Markets<br />
Profitability<br />
EURm<br />
1 800<br />
1 600<br />
1 400<br />
1 200<br />
1 000<br />
800<br />
600<br />
400<br />
200<br />
0<br />
11 12 13 14 15 16-<br />
2006 2007 2008 2009 2010<br />
Sales EBITDA EBITDA-margin (rhs)<br />
Source: Company data, <strong>Danske</strong> Markets<br />
EBITDA by segment (2010)<br />
35%<br />
34%<br />
33%<br />
32%<br />
31%<br />
30%<br />
29%<br />
28%<br />
27%<br />
26%<br />
25%<br />
During Q4, overall revenues rose by 5% year-on-year, with 2% growth in EBITDA.<br />
The Consumer Customer business revenue rose by 5.4%, driven by growth in mobile<br />
broadband and other mobile services. At the same time, fixed network services revenues<br />
continued to decline. Revenues and EBITDA in Estonia also declined. In the<br />
Corporate Customer business area revenues rose by 4%. While the traditional fixed-line<br />
revenues continued to decline, revenues related to mobile services rose during the<br />
quarter.<br />
The number of mobile subscriptions grew by 144,000 during the quarter (+14% y/y),<br />
while the mobile churn fell sequentially to 15% (Q3: 18.1%). The mobile average<br />
revenue per user fell somewhat to EUR20.7 (Q3: EUR21.2).<br />
Corporate<br />
Customers<br />
Source: Company data, <strong>Danske</strong> Markets<br />
Consumer<br />
Customers<br />
Credit metrics remain strong<br />
Elisa’s Q4 free cash flow after investments fell to EUR28m (Q4 09: EUR74m). Capital<br />
expenditure fell somewhat in Q4 vs the year earlier to EUR56m (Q4 09: EUR61m). In<br />
total, Elisa’s capital expenditure rose to EUR184m in 2010 from EUR171m in 2009.<br />
The largest share of capital expenditure in 2010 related to 3G capacity and coverage<br />
increases and other network and IT investments.<br />
In Q4, Elisa’s cash flow was negatively affected by a one-off EUR40m CDO guarantee<br />
settlement payment. Net debt at year-end 2010 was EUR776m, up from EUR725m at<br />
end-Q3. Elisa’s net debt to EBITDA was 1.7x, up from 1.6x at end-Q3. This is at the<br />
low end of Elisa’s targeted 1.5-2.0x range.<br />
Slight growth in revenues and EBITDA expected for 2011<br />
For 2011 Elisa said that it expects a slight increase in revenues, driven by growth in<br />
mobile broadband services and equipment sales. The company expects FY 11E adjusted<br />
EBITDA to improve slightly vs 2010, while capital expenditure should<br />
amount to a maximum 12% of revenues (2010: 12.6%).<br />
Debt metrics<br />
EURm<br />
1 400<br />
1 200<br />
1 000<br />
800<br />
600<br />
400<br />
200<br />
0<br />
2006 2007 2008 2009 2010<br />
Net debt equity Net debt/EBITDA (rhs)<br />
Source: Company data, <strong>Danske</strong> Markets<br />
X<br />
2,00<br />
1,80<br />
1,60<br />
1,40<br />
1,20<br />
1,00<br />
0,80<br />
0,60<br />
0,40<br />
0,20<br />
0,00<br />
153 | 13 April 2011<br />
www.danskeresearch.com
<strong>Scandi</strong> Handbook<br />
Plan for extra dividend announced<br />
Elisa has announced plans for a dividend payment of EUR0.90 per share (94% of the<br />
financial period’s net result), with an extra EUR0.40 per share to be distributed at a<br />
later date, depending on Elisa’s financial position and financial targets at that point in<br />
time. Elisa also asked for authorisation to buy back a maximum of 5m shares, corresponding<br />
to 3% of the entire share capital.<br />
Adjusting Elisa’s credit ratios for the normal dividend payment and operating leases,<br />
we estimate that the company’s net debt to EBITDA ratio pro forma 2010 will rise to<br />
around 2.0x (2.1x including the extra dividend). We believe this is still in line with<br />
the requirements for Elisa’s BBB/Baa2 ratings, although the room for additional<br />
leverage beyond this should be relatively limited. Consequently, if Elisa were to<br />
carry out sizeable share buy-backs in addition to the planned dividend payments, we<br />
believe that this would put some pressure on the ratings. However, we believe that<br />
Elisa is committed to its current ratings. The company has also indicated that it is<br />
unlikely to both make the extra dividend payment while at the same time carrying out<br />
share buy-backs. We therefore expect that Elisa will make sure not to distribute more<br />
cash to its shareholders than the BBB/Baa2 ratings allow.<br />
We regard Elisa as a stable BBB credit<br />
We regard Elisa as a stable BBB credit. Compared to its larger Nordic peers, TeliaSonera<br />
and Telenor, Elisa has a more limited geographic diversification and hence a<br />
larger exposure to the economic development in its home market. While this means<br />
that growth prospects are more limited, it also means that Elisa has less exposure to<br />
more volatile emerging markets. Elisa has a shareholder-friendly cash pay-out policy,<br />
which limits the potential for debt reduction. At the same time the company has a<br />
consistent track record both of reducing operating costs and of maintaining a conservative<br />
balance sheet with only moderate gearing. We also take some comfort from<br />
the Finnish state’s 10% indirect stake in the company.<br />
In order to maintain its BBB rating on Elisa, S&P has stated that it would like to see<br />
Elisa maintain an adjusted debt to EBITDA ratio below 2.5x, slightly above Elisa’s<br />
own financial target of an unadjusted net debt to EBITDA below 2.0x. According to<br />
S&P’s method of calculation, Elisa’s adjusted net debt to EBITDA was 1.7x at the<br />
end of 2010. S&P has said that it would consider upgrading its rating on Elisa if the<br />
company were to pursue less aggressive liquidity management and if funds from<br />
operations consistently remain “in the mid-to-high” 40% (equivalent to unadjusted<br />
debt to EBITDA at the low end of the 1.5-2.0x range).<br />
Moody’s sees Elisa’s financial flexibility in its Baa2 rating as more limited. In general,<br />
Moody’s expects Elisa to remain at the low end of its 1.5-2.0x net debt to<br />
EBITDA target range, with restricted extraordinary cash distribution.<br />
Recommendation<br />
We regard Elisa’s Q4 performance as encouraging. While margins remain under<br />
some pressure and mobile churn is still relatively high, it seems that revenue growth<br />
has recently gained momentum, thanks to the increased sales of mobile smartphones.<br />
In addition, Elisa’s balance sheet remains strong, with some financial flexibility<br />
compared to the rating requirements. At the same time, Elisa is likely to continue to<br />
pursue a generous distribution policy. While Elisa’s bonds are trading at higher<br />
spreads than Telenor’s or TeliaSonera’s, we argue that this is justified considering<br />
Elisa’s somewhat lower credit ratings and smaller scale of operations. We hence<br />
maintain our HOLD recommendation (see list of instrument prices at the end of this<br />
book).<br />
154 | 13 April 2011<br />
www.danskeresearch.com
<strong>Scandi</strong> Handbook<br />
Financial data Elisa<br />
Key figures (EURm) 2006 2007 2008 2009 2010<br />
Net Sales 1,527 1,564 1,492 1,435 1,463<br />
EBITDA 435 499 472 484 485<br />
EBIT 225 302 265 268 268<br />
Net interest expenses 14 17 37 33 71<br />
Net profit 161 220 177 177 151<br />
FFO [1] 411 385 367 394 364<br />
Capex [2] 206 204 179 170 184<br />
FCF [3] 129 82 271 261 187<br />
RCF [4] 296 9 100 247 143<br />
Net Debt [5] 377 741 812 719 776<br />
Adjusted Net debt [6] 489 856 920 820 836<br />
Total Debt 399 755 845 750 808<br />
Equity 1,312 1,035 873 899 833<br />
Ratios<br />
EBITDA margin 28% 32% 32% 34% 33%<br />
Net debt / EBITDA 0.9x 1.5x 1.7x 1.5x 1.6x<br />
Adjusted net debt / EBITDA 1.1x 1.6x 1.9x 1.6x 1.7x<br />
Adjusted FFO interest coverage [7] 13.3x 24.1x 6.9x 9.0x 4.4x<br />
Adjusted FFO/net debt 0.9x 0.5x 0.4x 0.5x 0.5x<br />
Adjusted RCF/debt 0.4x -0.1x 0.1x 0.3x 0.2x<br />
Adjusted debt/total capital 28% 46% 52% 49% 51%<br />
(1) Cash flow from operating activities before changes in working capital. (2) Investments in tangible assets. (3) Cash flow from operating activities less capex. (4) Cash<br />
flow from operating activities less dividends but before changes in working capital. (5) Total interest-bearing debt less cash and marketable securities. (6) Net debt<br />
adjusted for contingent liabilities/contractual obligations, pension liabilities and debt in subsidiaries, which are not wholly owned and operating leases. Source:<br />
Company Data and <strong>Danske</strong> Fixed Income Credit Research<br />
Quarterly review (EURm)<br />
Q4 09 Q1 10 Q2 10 Q3 10 Q4 10<br />
Net sales 365 353 364 363 383<br />
EBITDA 121 116 119 127 123<br />
EBITDA margin (%) 33% 33% 33% 35% 32%<br />
Net income 41 8 40 51 52<br />
Net debt 719 817 752 725 776<br />
Net debt/LTM EBITDA 1.5x 1.7x 1.5x 1.5x 1.6x<br />
Source: Company data and <strong>Danske</strong> Fixed Income Credit Research<br />
Divisional quarterly overview (EURm)<br />
Q4 09 Q1 10 Q2 10 Q3 10 Q4 10<br />
Consumer Net sales 217 214 217 225 229<br />
EBITDA 71 73 68 77 71<br />
EBITDA-margin 33% 34% 31% 34% 31%<br />
Corporate Net sales 148 139 147 139 154<br />
EBITDA 50 43 51 50 52<br />
EBITDA-margin 34% 31% 34% 36% 34%<br />
Source: <strong>Danske</strong> Markets<br />
155 | 13 April 2011<br />
www.danskeresearch.com
<strong>Scandi</strong> Handbook<br />
Ericsson<br />
Company overview<br />
Stockholm-based Telefonaktiebolaget LM Ericsson (Ericsson) has origins that date<br />
back to 1876 and is a world-leading provider of fixed and mobile telecommunications<br />
infrastructure. In total Ericsson supports networks that serve more than 2bn<br />
subscribers and manages networks that serve more than 700m subscribers. Ericsson’s<br />
main business segments are Networks (55% of sales in 2010), Global Services (39%<br />
of sales in 2010) and Multimedia (5% of sales in 2010) and the 50/50 joint ventures,<br />
Sony Ericsson and ST Ericsson. Sony Ericsson is a mobile phone company that<br />
Ericsson owns together with Sony Corp, while ST Ericsson is a wireless platforms<br />
and semiconductors company that is owned together with STMicroelectronics. At<br />
year-end 2010 Ericsson had some 90,261 employees. Ericsson’s largest shareholders<br />
are the two Swedish investment companies, Investor AB and AB Industrivärden,<br />
which held 19.3% and 13.8%, respectively, of voting rights at the end of 2010.<br />
Key credit considerations<br />
World leadership in mobile telecoms equipment<br />
Ericsson’s key credit strength is its leading position in the mobile networks and<br />
equipment industry. Over 1,000 networks in more than 175 countries use Ericsson’s<br />
network infrastructure and more than 40% of all of the world’s mobile calls pass<br />
through Ericsson networks. Its main competitors include Nokia Siemens Networks,<br />
Alcatel Lucent and the Chinese vendors Huawei and ZTE. The global telecoms<br />
equipment market is characterised by fierce competition and rapidly evolving technological<br />
changes. In recent years, Chinese vendors have gained strong momentum at<br />
the same time as the market has consolidated. Ericsson has participated in this consolidation<br />
through its acquisitions of Marconi in 2006 and by the acquisition of<br />
Nortel’s CDMA and LTE assets in 2009. In 2010 Ericsson acquired companies for a<br />
total price of SEK3.3bn.<br />
Ericsson’s large operational scale and installed client base offer important competitive<br />
advantages. Ericsson’s market position is also supported by the company’s technological<br />
leadership and large R&D investments. In 2010 Ericsson invested some<br />
15% of its total sales into R&D and had some 20,000 R&D employees. More than<br />
80% of the company’s product development is software related. Ericsson also has a<br />
strong patent portfolio, totalling some 27,000 patents.<br />
Mobile data traffic expected to continue growing rapidly<br />
Networks earnings are highly correlated to telecom operators’ general spending. This<br />
spending is subject to a certain degree of cyclicality and is dependent on factors such<br />
as the telecom operators’ financial health and the overall economic outlook. At the<br />
end of 2010 there were some 5.3bn mobile subscribers worldwide, of which some<br />
10% were mobile broadband subscribers. Due to the rapid growth in mobile smartphones,<br />
Ericsson expects the number of mobile broadband subscribers to reach almost<br />
5bn in 2016. Mobile data traffic more than doubled in 2010 and is expected to<br />
continue to double annually over the coming three years. This suggests that mobile<br />
operators will need to continue to make large investments in network capacity upgrades<br />
in the coming years in order to be able to handle these rapidly increasing data<br />
traffic volumes. Ericsson is also trying to take advantage of the outsourcing trend<br />
among network operations via its Global Services operations, which employed some<br />
45,000 professionals at the end of 2010. As these outsourcing contracts are typically<br />
multi-year, the recent growth in this business area should have improved Ericsson’s<br />
revenue stability.<br />
HOLD<br />
Sector: Information Technology,<br />
Communications Equipment<br />
Corporate ticker: LMETEL<br />
Equity ticker: ERICB SS<br />
Market cap: SEK272bn<br />
Ratings:<br />
S&P rating: BBB+/S<br />
Moodys rating: Baa1/S<br />
Fitch rating: BBB+/S<br />
Analyst:<br />
Louis Landeman<br />
Louis.landeman@danskebank.se<br />
+46 8 568 80524<br />
Jakob Magnussen, CFA<br />
Jakob.magnussen@danskebank.dk<br />
+45 45 128503<br />
Key credit issues<br />
Strengths:<br />
• Market leader in mobile and fixed<br />
networks and network equipment.<br />
• Very well capitalised with negative<br />
net debt.<br />
• Among preferred providers with<br />
global footprint.<br />
• Rising share of high-margin expansion<br />
and upgrades business combined<br />
with rising margins.<br />
Challenges:<br />
• Competition from Chinese vendors<br />
increasing.<br />
• High technological risks from<br />
competing network standards.<br />
• Solid shareholder focus.<br />
• Struggling JVs although Sony-<br />
Ericsson has now turned profitable.<br />
Source: <strong>Danske</strong> Markets<br />
156 | 13 April 2011<br />
www.danskeresearch.com
<strong>Scandi</strong> Handbook<br />
Liquidity<br />
Ericsson enjoys a very strong liquidity profile. At the end of 2010 the company had<br />
cash and cash equivalents of SEK22.8bn while short-term investments totalled another<br />
SEK53.9bn. In addition, the company had access to an unused USD2bn revolving<br />
credit facility without financial covenants that matures in June 2014. Ericsson<br />
also has a strong strategic focus on improving its cash conversion rate and constantly<br />
strives to improve its working capital management. In 2010, the company generated<br />
operating cash flow after working capital of SEK26.6bn. Ericsson’s total debt included<br />
pension liabilities amounting to SEK35.9bn at the end of 2010, of which<br />
SEK3.8bn was short term. Ericsson has a conservative financial policy and generally<br />
likes to maintain a strong cash position as this allows the company to have an active<br />
M&A strategy.<br />
Current performance drivers<br />
Improved top-line growth in Q4 largely thanks to mobile data<br />
Ericsson’s overall sales rose by 8% year-on-year in Q4, mainly due to strong growth<br />
in mobile broadband network sales, especially in the US and Japan. Also, 2G sales to<br />
China showed good growth during the quarter. Helped by the positive impact from<br />
the acquired Nortel businesses, Ericsson’s network sales rose by 14% in Q4 in spite<br />
of the negative effect from the stronger SEK. In contrast, Global Services sales fell<br />
by 1% year-on-year due to negative currency effects and lower network roll-outs due<br />
to the component shortage in the industry earlier last year. The EBIT margin (before<br />
shares in JVs and associated companies) was 10.6%, clearly up compared to Q4 09<br />
(5.6%) but somewhat down compared to Q3 (11.2%). This is mainly due to business<br />
mix changes during the quarter, with a higher share of projects and sales from new<br />
network roll-outs relative to higher margin network maintenance and upgrades sales.<br />
Strong cash flow generation and conservative balance sheet<br />
Due to a combination of higher earnings and better cash flow collection, Ericsson’s<br />
operating cash flow (after working capital items) rose to SEK15.2bn in Q4 (Q4 09:<br />
SEK12.5bn). This meant that Ericsson’s gross cash position rose to SEK87.2bn, with<br />
a net cash position of SEK51.3bn (Q3 10: SEK 43.8bn). On a fully adjusted basis we<br />
estimate the net cash position at SEK32bn. Adjusted gross debt to LTM EBITDA<br />
was 1.7x, down from 1.9x in Q3 10, while FFO to gross debt was 42% (Q3 10: 37%).<br />
Outlook<br />
Ericsson does not provide any formal guidance but remains of the opinion that<br />
longer-term industry developments remain solid as mobile data traffic continues to<br />
grow strongly and mobile broadband networks are being built out across all regions.<br />
This should result in higher demand for capacity upgrades. There should also be<br />
demand for services related to enhanced operational efficiency among telecom operators<br />
(managed operations, network sharing and network transformation). According<br />
to Ericsson, global mobile traffic more than doubled between Q3 09 and Q3 10. The<br />
expectation is that global mobile traffic will continue to almost double annually in<br />
the coming years due to the increased usage of smartphones, tablets and laptops. At<br />
the same time, it is clear that market conditions will remain tough with intense competition<br />
from a number of vendors (such as the Chinese vendors Huawei and ZTE).<br />
Consequently, Ericsson continues to focus on cost reductions, with some SEK2bn of<br />
restructuring charges planned for 2011.<br />
Improved profitability at Ericssons joint ventures<br />
Ericsson’s 50% ownership stakes, Sony Ericsson (SE) and ST Ericsson (ST), are<br />
consolidated in Ericsson’s reports on an equity basis. SE has a narrow product line,<br />
mainly focused on high-end mobile phones. In 2010 the company’s revenues fell by<br />
7%. At the same time SE’s margins improved significantly due to intensive cost<br />
cutting. In 2010 SE’s EBIT margin rose to 3% from a negative 15% in 2009. We<br />
subsequently see a reduced risk of Ericsson providing further liquidity injections into<br />
Maturity profile (as of end-2010)<br />
SEK bn<br />
6<br />
5<br />
4<br />
3<br />
2<br />
1<br />
0<br />
Source: Company data and <strong>Danske</strong> Markets<br />
Profitability<br />
SEKm<br />
250 000<br />
200 000<br />
150 000<br />
100 000<br />
50 000<br />
11 12 13 14 15 16 17 18 19 20<br />
0<br />
Source: Company data, <strong>Danske</strong> Markets<br />
EBIT by segment (2010)<br />
Networks<br />
64%<br />
Source: Company data, <strong>Danske</strong> Markets<br />
Debt metrics<br />
SEKm<br />
200 000<br />
150 000<br />
100 000<br />
50 000<br />
0<br />
-50 000<br />
-100 000<br />
2006 2007 2008 2009 2010<br />
Source: Company data, <strong>Danske</strong> Markets<br />
25%<br />
20%<br />
15%<br />
10%<br />
5%<br />
0%<br />
Net sales EBITDA EBITDA-margin (rhs)<br />
ST-<br />
Ericsson<br />
0%<br />
Global<br />
Services<br />
33%<br />
2006 2007 2008 2009 2010<br />
Multimedia<br />
0%<br />
Net debt Equity Debt / EBITDA<br />
Sony<br />
Ericsson<br />
3%<br />
2,8x<br />
2,4x<br />
2,0x<br />
1,6x<br />
1,2x<br />
0,8x<br />
0,4x<br />
0,0x<br />
157 | 13 April 2011<br />
www.danskeresearch.com
<strong>Scandi</strong> Handbook<br />
SE in the near future. ST also experienced declining revenues in 2010. For 2010,<br />
ST’s sales fell by 9%, with a 22% y/y decline in Q4. While substantial cost cutting<br />
has been carried out, ST still recorded an EBIT loss of USD611m in 2010 (2009: loss<br />
of USD581m). Unfortunately a turnaround does not seem likely in the near term,<br />
with Ericsson guiding a sequential sales decline at ST in Q1 this year.<br />
Diverse earnings base partly offsets general industry risks<br />
Technology risks are generally high in the telecoms equipment industry and missing<br />
out on some important technological change can lead to significant loss of market<br />
share. In this regard Ericsson’s technology leadership and large-scale R&D is an important<br />
competitive advantage. It also typically means that the company is able to gain<br />
market share in periods of technological transformation. For example, Ericsson currently<br />
has a higher market share of 4G/LTE networks than it has for the earlier technology<br />
generations. Ericsson believes that it improved its overall market share in 2010 due<br />
to the acquired Nortel business. The intellectual property rights (IPRs) that Ericsson has<br />
also offer additional revenues for the company as these rights are licensed to other<br />
companies. In 2010 Ericsson’s net revenues from IPRs amounted to SEK4.6bn.<br />
Ericsson’s good geographic diversification together with its larger services business<br />
should also help to reduce earnings volatility. With its 45,000 service professionals<br />
Ericsson has the largest services organisation in the telecoms equipment industry,<br />
with services ranging from managed services, consulting and systems integration and<br />
customer support to network roll-out. In 2010, Ericsson signed some 54 managed<br />
services contracts, of which 26 were extensions or expansions.<br />
Geographically, Ericsson is present in all the world’s regions. In 2010, some 24% of<br />
sales were generated in North America, 9% in Latin America, 34% in Europe, Middle<br />
East and Central Asia, 5% in Sub-Saharan Africa and 24% in Asia and Oceania.<br />
The top five countries in terms of sales were USA, China, Japan, India and Italy.<br />
Ericsson’s strong geographic diversification also means that the company has large<br />
exposure to emerging markets. As the company typically serves the major telecom<br />
operators in the world this also means that it derives a relatively high share of earnings<br />
from individual customers. Ericsson’s ten largest customers accounted for some<br />
46% of the company’s net sales in 2010.<br />
Stable operating margins key for ratings<br />
We regard the strong cash flow generation in Q4 as supportive for Ericsson’s ratings.<br />
In order to maintain the current ratings it will also be important that Ericsson manages<br />
to keep its margins stable. S&P has previously stated that it sees continued<br />
margin recovery as a key component for its rating on Ericsson. S&P has said that it<br />
sees only limited headroom for further cash losses at Ericsson’s joint ventures. In Q4,<br />
Sony Ericsson reported net income of EUR3m while ST Ericsson reported negative<br />
operating income of USD171m (Q3 10: negative USD129m). Ericsson indicated that<br />
the near-term outlook for ST Ericsson is challenging but that it expects performance<br />
to improve over time as new products are launched and restructuring continues.<br />
Recommendation<br />
While Ericsson remains supported by its leading market position, industry conditions<br />
in the telecoms equipment market remain challenging with intense competition and<br />
an intense cost reduction focus among telecom operators. Consequently, it will be<br />
important for Ericsson to continue to keep good cost control and maintain stable<br />
margins. Positively, the company’s conservative balance sheet management provides<br />
some flexibility. We regard Ericsson’s bond spreads as fair and maintain our HOLD<br />
recommendation, with a preference for the shorter-dated 2013s over the 2017s (see<br />
list of instrument prices at the end of this book).<br />
158 | 13 April 2011<br />
www.danskeresearch.com
<strong>Scandi</strong> Handbook<br />
Financial data Ericsson<br />
Key figures (SEKm) 2006 2007 2008 2009 2010<br />
Net Sales 177,783 187,780 208,930 206,477 203,348<br />
EBITDA 37,410 39,009 24,927 18,041 26,408<br />
EBIT 35,828 30,646 16,252 5,918 16,455<br />
Net interest expenses -165 -83 -974 -325 672<br />
Net profit 26,351 22,135 11,667 4,127 11,235<br />
FFO [1] 32,496 28,315 34,018 14,525 26,255<br />
Capex [2] 3,827 4,319 4,133 4,006 3,686<br />
FCF [3] 14,662 14,891 19,867 20,470 22,897<br />
RCF [4] 25,153 20,183 25,778 8,207 19,578<br />
Net Debt [5] -47,696 -30,500 -44,524 -44,604 -56,387<br />
Adjusted Net debt [6] -31,536 -10,127 -19,056 -20,830 -37,289<br />
Total Debt 14,584 27,216 30,481 32,120 30,763<br />
Equity 120,113 135,052 142,084 141,027 146,785<br />
Ratios<br />
EBITDA margin 21% 21% 12% 9% 13%<br />
Net debt / EBITDA -1.3x -0.8x -1.8x -2.5x -2.1x<br />
Adjusted net debt / EBITDA -0.8x -0.2x -0.7x -1.0x -1.3x<br />
Adjusted FFO interest coverage [7] 14.3x 12.3x 11.1x 7.0x 10.6x<br />
Adjusted FFO/net debt -108% -297% -190% -80% -76%<br />
Adjusted RCF/debt 87% 46% 50% 19% 43%<br />
Adjusted debt/total capital 20% 26% 28% 28% 25%<br />
(1) Cash flow from operating activities before changes in working capital. (2) Investments in tangible assets. (3) Cash flow from operating activities less capex. (4)<br />
Cash flow from operating activities less dividends but before changes in working capital. (5) Total interest-bearing debt less cash and marketable securities. (6)<br />
Net debt adjusted for contingent liabilities/contractual obligations, pension liabilities and debt in subsidiaries, which are not wholly owned and operating leases.<br />
Source: Company Data, <strong>Danske</strong> Fixed Income Credit Research<br />
Quarterly review (SEKm)<br />
Q4 09 Q1 10 Q2 10 Q3 10 Q4 10<br />
Net sales 58,333 45,112 47,972 47,481 62,783<br />
EBITDA 5,678 5,114 5,324 7,480 8,490<br />
EBITDA margin 10% 11% 11% 16% 14%<br />
Net income 725 1,274 2,027 3,553 4,381<br />
Net debt -44,604 -46,581 -34,302 -43,805 -56,387<br />
Net debt/LTM EBITDA 0.0x 0.0x 0.1x 0.1x 0.1x<br />
Source: Company data, <strong>Danske</strong> Fixed Income Credit Research<br />
Divisional quarterly overview (SEKm)<br />
Q4 09 Q1 10 Q2 10 Q3 10 Q4 10<br />
Networks Net sales 31,844 24,704 25,472 26,087 36,445<br />
EBIT 2,128 1,540 2,507 3,717 4,717<br />
Global Services Net sales 23,137 18,098 20,080 19,076 22,869<br />
EBIT 1,076 1,325 1,377 1,891 1,920<br />
Multimedia Net sales 3,352 2,310 2,420 2,318 3,469<br />
EBIT 263 -335 -479 -187 358<br />
SonyEricsson Net sales 9,053 6,985 8,469 7,438 6,823<br />
EBIT -1,044 76 134 290 164<br />
ST Ericsson Net sales 2,594 2,178 2,064 1,881 1,890<br />
EBIT -351 -467 -391 -392 -505<br />
Source: Company data, <strong>Danske</strong> Markets<br />
159 | 13 April 2011<br />
www.danskeresearch.com
<strong>Scandi</strong> Handbook<br />
Nokia<br />
Company overview<br />
Finland-based Nokia is the world’s largest producer of mobile handsets with an estimated<br />
global market share of 32% of handsets sold in 2010. In 2010, Nokia’s Devices<br />
& Services unit constituted 68% of total group sales. Through the 50%-owned<br />
joint venture with Siemens, Nokia Siemens Networks (NSN), Nokia also designs and<br />
builds mobile and fixed-network infrastructure and platforms and offers professional<br />
services to telecom operators. In 2010, NSN comprised some 30% of group sales<br />
(17% when deducting Siemens’ share of the fully consolidated joint venture). The<br />
remaining 2% of group sales are made up by Navteq, Nokia’s division for digital<br />
map data and related location-based content and services. Nokia’s sales are well<br />
spread geographically, with Europe representing 35%, Middle East & Africa 13%,<br />
Asia-Pacific 21%, China 18%, North America 5% and South America 9% of total<br />
sales in 2010. Nokia has an open shareholder structure, with a large number of institutional<br />
shareholders, of which the three largest held slightly more than 10% of the<br />
shares at the end of 2010.<br />
Key credit considerations<br />
Broad strategic partnership with Microsoft announced<br />
In mid-February this year Nokia announced plans for a broad strategic partnership<br />
with Microsoft, whereby Windows Phone will become the new main smartphone<br />
platform for Nokia. Nokia’s own mobile operating system Symbian - with an installed<br />
user base of 200m - will become a franchise platform. Nokia said that it expects<br />
to sell an additional 150m Symbian devices over the coming years. Nokia also<br />
plans to ship some products based on its new software platform MeeGo later on this<br />
year, with MeeGo becoming an open-source mobile operating system project.<br />
New company structure as of 1 April<br />
To support this transition, Nokia will establish a new company structure as of 1<br />
April. Smart Devices and Mobile Phones will become two separate business areas in<br />
order to better differentiate between high-end smartphones and mass-market mobile<br />
phones. Some of the other new business areas include Services and Developer Experience<br />
(responsible for Nokia’s global services portfolio), NAVTEQ (the location<br />
and advertising business), The CTO Office (technology strategy – including Nokia<br />
Research Center) and Nokia Siemens Networks (NSN; continues to operate as a<br />
separate reporting entity).<br />
Strategic changes are positive but major challenges remain<br />
Considering Nokia’s rapidly weakening competitive situation in the smartphone<br />
segment, we agree with the company’s management that there is a need for radical<br />
change. Only in Q4 10, Nokia’s global market share in the smartphone segment fell<br />
to 31% from 38%. Also, as smartphones over time become cheaper and more like<br />
commodities, they should increasingly start to challenge Nokia’s currently strong<br />
market position for low-end mobile phones, which would likely have a further negative<br />
impact on Nokia’s operating margins.<br />
However, as Microsoft is currently a relatively small player in the mobile market, it still<br />
remains to be seen if Nokia and Microsoft can come up with an exciting range of<br />
products that can truly challenge the IOS (Apple) and Android (Google) platforms in<br />
terms of design and customer experience for smartphones. Hence this new strategic<br />
alliance entails a great deal of execution risk. Also, as it will also take some time<br />
before these new products can be launched on the market, we expect Nokia’s market<br />
share and operating margins to remain under pressure in the near term.<br />
SELL<br />
Sector: Information technology,<br />
Communications equipment<br />
Corporate ticker: NOKIA<br />
Equity ticker: NOK1V FH<br />
Market cap: EUR24bn<br />
Ratings:<br />
S&P rating: A-/S<br />
Moodys rating: A3/NO<br />
Fitch rating: BBB+/NO<br />
Analyst:<br />
Louis Landeman<br />
Louis.landeman@danskebank.se<br />
+46 8 568 80524<br />
Jakob Magnussen, CFA<br />
Jakob.magnussen@danskebank.dk<br />
+45 45 128503<br />
Key credit issues<br />
Strengths:<br />
• Large-scale advantages offered<br />
through world-leading market position<br />
and global footprint.<br />
• Diverse product range with particular<br />
competitive edge in low-end<br />
handset segment.<br />
• Very strong credit metrics with a<br />
large net cash position that offers<br />
financial flexibility.<br />
• High R&D budget.<br />
• Cost-cutting opportunities offered<br />
by Microsoft partnership.<br />
Challenges:<br />
• Weakening market position in the<br />
high-margin, high-end segment.<br />
• Very tough competitive situation<br />
with large technological challenges.<br />
• Declining overall market shares<br />
and margins risk of intensifying<br />
competition also in low-end market<br />
segment.<br />
• Large execution risks related to<br />
the partnership with Microsoft<br />
with tough transition period to be<br />
expected in coming years.<br />
Source: <strong>Danske</strong> Markets<br />
160 | 13 April 2011<br />
www.danskeresearch.com
<strong>Scandi</strong> Handbook<br />
Liquidity<br />
We regard Nokia’s liquidity position as very strong. At the end of 2010 the company<br />
enjoyed a net cash position of EUR6.1bn with cash, cash equivalents and liquid assets<br />
totalling EUR11.3bn. In addition the company had committed credit facilities of<br />
USD1.9bn maturing in 2012 (NSN also had a committed revolving credit facility<br />
amounting to EUR2bn maturing in 2012 that includes some financial covenants<br />
related to a gearing test, leverage test and interest coverage test of NSN). In comparison<br />
Nokia’s long-term debt amounted to EUR4.2bn while short-term debt was<br />
EUR1.0bn. Total debt to LTM EBITDA was 1.4x (1.5x on a lease-adjusted basis),<br />
unchanged from the end of Q3. Nokia’s liquidity position is also supported by its<br />
strong cash flow generation. In 2010 Nokia reported operating cash flow after working<br />
capital items of EUR4.8bn (2009: EUR3.2bn). This largely exceeded capital<br />
expenditure of EUR679m (2009: EUR531m) and dividends of EUR1.5bn (2009:<br />
EUR1.5bn).<br />
Current performance drivers<br />
Improvements in margins and ASP but continued loss of market share<br />
Overall, Nokia’s Q4 results were somewhat better than expected. Both the Devices<br />
and Services division and Nokia Siemens Networks managed to achieve some sequential<br />
sales growth and margin improvement compared to Q3. In Devices and<br />
Services, sales rose by 4% y/y and by 18% q/q, respectively. The operating margin<br />
rose sequentially to 11.3% (Q4 09: 15.4%, Q3 10: 10.5%), helped by an improved<br />
mobile device ASP, which rose to EUR69 from EUR65 in Q3. While Nokia increased<br />
its total global market share for mobile devices to 31% in Q4 from 30% in<br />
Q3, the company continued to struggle in the smartphone segment where its market<br />
share fell to 31% in Q4 from 38% in Q3. Currently, a large part of total mobile devices<br />
sold are low-margin, low-end phones in emerging markets. Over time, Nokia’s<br />
strong position in this market segment could be threatened by the development of<br />
cheaper smartphones. Hence we see further downside risks for Nokia’s operating<br />
margins.<br />
NSN continues to struggle<br />
In addition to the smartphone problems, Nokia’s joint venture with Siemens, NSN, is<br />
struggling to achieve sustainable profitability due to the current intense price competition<br />
in the mobile telecoms equipment market. In 2010, NSN strengthened its market<br />
position through the acquisition of the majority of Motorola’s mobile assets for<br />
USD1.2bn in cash. Like other telecom equipment manufacturers, NSN constantly<br />
needs to develop new products and services in order to stay competitive. NSN also<br />
needs to continue to restructure its operations and cut costs in order to improve its<br />
profitability. This is important for Nokia to avoid the risk of having to inject further<br />
equity into the joint venture. A positive effect of the rapid growth in mobile smartphone<br />
usage is the consequent increase in demand for mobile data capacity. This is an overall<br />
positive trend for all telecoms equipment manufacturers including NSN.<br />
Maturity profile as of end-2010<br />
2500<br />
2000<br />
1500<br />
1000<br />
500<br />
0<br />
Source: Company data and <strong>Danske</strong> Markets<br />
Profitability<br />
EURm<br />
60 000<br />
50 000<br />
40 000<br />
30 000<br />
20 000<br />
10 000<br />
0<br />
Source: Company data and <strong>Danske</strong> Markets<br />
Revenue split per segment (2010)<br />
Nokia<br />
Siemens<br />
Networks<br />
30%<br />
Source: Company data and <strong>Danske</strong> Markets<br />
Debt metrics<br />
EURm<br />
2011 2012-2013 2014-2015 2016-<br />
2006 2007 2008 2009 2010<br />
20%<br />
18%<br />
16%<br />
14%<br />
8%<br />
10%<br />
12%<br />
6%<br />
4%<br />
2%<br />
0%<br />
Net sales EBITDA EBITDA-margin (rhs)<br />
Navteq<br />
2%<br />
Devices &<br />
Services<br />
68%<br />
Cautious Q1 outlook...<br />
In conjunction with its Q4 earnings Nokia stated that it expects the Devices & Services<br />
division to achieve sales of EUR6.8-7.3bn in Q1 with an adjusted operating margin of<br />
7-10% (Q1-10: 12%). Nokia Siemens Networks is expected to achieve Q1 sales of<br />
EUR2.8-3.1bn with a margin of between -3% and breakeven (Q1-10: 0.6%).<br />
20 000<br />
15 000<br />
10 000<br />
5 000<br />
0<br />
-5 000<br />
-10 000<br />
-15 000<br />
2006 2007 2008 2009 2010<br />
2,5x<br />
1,5x<br />
0,5x<br />
-0,5x<br />
-1,5x<br />
-2,5x<br />
...and new financial targets presented<br />
In relation to the strategy update announcement in mid-February Nokia also provided<br />
updated financial guidance. Due to the uncertain near-term outlook for the Devices &<br />
Services business, Nokia did not present any 2011 guidance for this business unit at<br />
this point in time. Both 2011 and 2012 are expected to be “transition years” as the<br />
company invests in its new mobile ecosystem with Microsoft. After 2011, Nokia<br />
Net debt Equity Net debt/EBITDA (rhs)<br />
Source: Company data and <strong>Danske</strong> Markets<br />
161 | 13 April 2011<br />
www.danskeresearch.com
<strong>Scandi</strong> Handbook<br />
expects Devices & Services net sales to grow faster than the market with an operating<br />
margin of 10% or above. For NSN, overall industry revenue is expected to grow<br />
slightly in 2011 compared to 2010. NSN is expected to grow its sales faster than the<br />
market in 2011 with an operating margin “above breakeven”. NSN’s operating expenses<br />
and production overheads are expected to be reduced by EUR500m by the<br />
end of 2011 compared to the end of 2009.<br />
Nokia focuses heavily on product development. In 2010 the company spent EUR3bn<br />
on R&D, with more than 16,000 R&D employees in the Devices & Services division.<br />
If Nokia decides to give up the development of its own mobile operating systems this<br />
could allow for some serious cost savings. However, given the large installed client<br />
base using the Symbian operating system, it is more likely that this system will be<br />
phased out over time and that Nokia will continue to launch products both based on<br />
Symbian and MeeGo during this year, something that could become rather costly. At<br />
the same time, Nokia’s management has clearly stated that the ambition is to achieve<br />
“significant job reductions” and R&D savings in the coming years.<br />
Impact of the Japan earthquake on Nokias performance<br />
Like other handset manufacturers, Nokia sources components for its mobile devices<br />
from a global network of suppliers, including suppliers based in Japan. Following the<br />
Japan earthquake Nokia issued a statement saying that it does not expect any material<br />
impact on its Q1 11 results due to this tragic event. At the same time the company said<br />
that it continues to evaluate the situation and that it does expect some disruption to the<br />
Devices & Services unit’s ability to supply a number of products as an industry-wide<br />
shortage of components and raw materials sourced from Japan is expected to occur.<br />
Nokia said that it will provide more detailed information on the development of this<br />
situation at the latest in conjunction with its next quarterly results announcement on 21<br />
April.<br />
We foresee further rating pressure<br />
As long as Nokia does not manage to stabilise its profit margins we expect that its<br />
credit ratings will remain under pressure. While Fitch has downgraded Nokia’s ratings<br />
to BBB+ with a negative outlook, Moody’s downgraded the company to A3 with a<br />
negative outlook. In late March, S&P downgraded its ratings on Nokia to A- (from A)<br />
while changing the outlook to stable. S&P stated that it expects Nokia to maintain its<br />
conservative financial policy and very strong balance sheet during the coming years<br />
and that the Devices & Services margins should recover to “at least” 10% in 2013.<br />
Handset market shares by company<br />
40%<br />
35%<br />
30%<br />
25%<br />
20%<br />
15%<br />
10%<br />
5%<br />
0%<br />
Source: Gartner, Compactnews, <strong>Danske</strong> Markets<br />
Smartphone market shares by system<br />
50%<br />
45%<br />
40%<br />
35%<br />
30%<br />
25%<br />
20%<br />
15%<br />
10%<br />
5%<br />
0%<br />
2009 2010<br />
2009 2010<br />
Source: Gartner, Compactnews, <strong>Danske</strong> Markets<br />
To us this seems overly optimistic. In our opinion, it is far from certain that the partnership<br />
with Microsoft will be enough to stabilize Nokia’s market position. Rather, we see<br />
a large risk that Nokia’s market position and operating margins will erode further over<br />
the coming years as the competition also intensifies at the low end of the market and as<br />
Nokia manages the transition to its Microsoft Windows Phone software. In addition, we<br />
expect Nokia’s margins to be negatively impacted by royalty payments to Microsoft<br />
and the large restructuring charges that the company will have to take in order to adapt<br />
its current large R&D resources. S&P said that it may consider a further downgrade if<br />
Nokia’s Devices & Services margins fall below 5% or if the company’s smartphone<br />
market share drops below 20%<br />
Recommendation<br />
Nokia’s creditworthiness continues to be supported by the company’s solid balance<br />
sheet and large liquidity position, which offer some financial flexibility. Still, in order<br />
to stabilize its credit profile we believe that Nokia is faced with a number of challenges.<br />
We continue to believe that Nokia’s bonds – which have rather long maturities – trade<br />
somewhat tight considering the large challenges the company is faced with. Consequently<br />
we maintain our SELL recommendation (see list of instrument prices at the<br />
end of this book).<br />
162 | 13 April 2011<br />
www.danskeresearch.com
<strong>Scandi</strong> Handbook<br />
Financial data Nokia<br />
Key figures (EURm) 2006 2007 2008 2009 2010<br />
Net sales 41,121 51,058 50,710 40,984 42,446<br />
EBITDA 6,200 9,191 6,583 2,981 3,841<br />
EBIT 505 967 1,619 1,197 2,070<br />
Net interest expense -207 -239 2 265 108<br />
Net profit 4,366 7,205 3,988 260 1,343<br />
FFO [1] 5,271 7,277 5,743 3,107 2,425<br />
Capex [2] 650 715 889 531 679<br />
FCF [3] 3,828 7,167 2,308 2,716 4,095<br />
RCF [4] 3,510 5,517 3,695 1,561 906<br />
Net Debt [5] -8,221 -10,663 -2,368 -3,090 -6,085<br />
Adjusted net debt [6] -7,286 -9,353 -1,014 -219 -3,525<br />
Total Debt 316 1,090 4,452 5,203 5,279<br />
Equity 12,060 17,338 16,510 14,749 16,231<br />
Ratios<br />
EBITDA margin 15% 18% 13% 7% 9%<br />
Net debt / EBITDA -1.3x -1.2x -0.4x -1.0x -1.6x<br />
Adjusted net debt / EBITDA -1.1x -1.0x -0.1x -0.1x -0.8x<br />
Adjusted FFO interest coverage [7] 71.7x 57.6x 25.0x 9.4x 8.1x<br />
Adjusted FFO / net debt -74% -79% -586% -1520% -75%<br />
Adjusted RCF /debt 21% 77% 13% 22% 14%<br />
Adjusted net debt / total capital -153% -117% -7% -2% -28%<br />
(1) Adjusted for non-recurring items. (2) Net income after tax plus depreciation and amortization, deferred tax and other non cash items. (3) CFO plus interest and<br />
taxes paid less capex. (4) OpFCF less interest paid, tax paid, and dividends. (5) Total interest-bearing debt (incl. pension provision) less cash and marketable<br />
securities. (6) Net debt adjusted for operating leases and contingent liabilities.<br />
Quarterly review (EURm)<br />
Q4 09 Q1 10 Q2 10 Q3 10 Q4 10<br />
Net sales 11,988 9,522 10,003 10,270 12,651<br />
EBITDA 1,592 925 758 844 1,314<br />
EBITDA margin (%) 13% 10% 8% 8% 10%<br />
Net income 882 349 104 322 742<br />
Net debt (end period) -3,090 -4,353 -3,446 -3,317 -6,085<br />
Net debt/LTM EBITDA (x) 0.1x 0.1x 0.0x 0.0x 0.1x<br />
Source: Company data and <strong>Danske</strong> Fixed Income Credit Research<br />
Divisional quarterly overview (EURm)<br />
Q4 09 Q1 10 Q2 10 Q3 10 Q4 10<br />
Devices & Services Net sales 8,179 6,663 6,800 7,173 8499<br />
EBIT 1,257 820 660 807 961<br />
EBIT-margin 15.4% 12.3% 9.7% 11.3% 11.3%<br />
Navteq Net sales 225 189 253 252 309<br />
EBIT 54 41 50 -48 100<br />
EBIT-margin 24.0% 21.7% 19.8% -19.0% 32.4%<br />
NSN Net sales 3,625 2,718 3,039 2,943 3961<br />
EBIT 201 15 51 -282 145<br />
EBIT-margin 5.5% 0.6% 1.7% -9.6% 3.7%<br />
Source: Company data and <strong>Danske</strong> Markets<br />
163 | 13 April 2011<br />
www.danskeresearch.com
<strong>Scandi</strong> Handbook<br />
TDC<br />
Company overview<br />
TDC is the leading telecom operator in Denmark, offering a full range of telecommunication<br />
services, including fixed line, mobile, internet and cable TV. TDC’s<br />
business divisions consist of Consumer, Business, Nordic, Operations & Wholesale<br />
and YouSee. YouSee is Denmark’s leading cable TV operator with a fully digitized<br />
network covering some 56% of Danish households. Outside Denmark, TDC mainly<br />
provides telecoms services for businesses in the Nordic region through its pan-Nordic<br />
network. Mobile services are offered as a mobile virtual network operator (MVNO)<br />
through agreements with the local mobile network operators. At the end of last year,<br />
TDC sold its assets in Switzerland and prepaid part of its bank debt. At the same<br />
time, TDC’s majority owner, NTC, completed an IPO and redeemed its outstanding<br />
high yield bonds. Following the IPO, the consortium of private equity owners behind<br />
NTC reduced its ownership in TDC from 88% to 59% while TDC’s credit ratings<br />
were upgraded back to investment grade by S&P, Moody’s and Fitch.<br />
Key credit considerations<br />
TDC is the clear market leader in Denmark<br />
TDC’s main credit strength is its leading position in the Danish telecoms market.<br />
This also means that the company is exposed to the general development of the Danish<br />
economy as this has an impact on the business and residential spending on telecoms<br />
services. According to the IMF (October 2010), the Danish economy is expected<br />
to grow by 2.2% from 2010 to 2012 – slightly faster than the eurozone average<br />
(1.6%). We highlight though that TDC is a relatively low-cyclical company that<br />
should display a lower-than-average sensitivity to the overall development of the<br />
Danish economy.<br />
In the Danish residential market, TDC is the market leader in the landline telephony,<br />
mobile voice, broadband and pay-TV markets, and no.2 by market share in mobile<br />
broadband, while in the Danish business market, TDC ranks no.1 in all major market<br />
segments. TDC has defended its market position well in recent years, using a multibrand<br />
strategy with brands such as TDC, Fullrate, Telmore, M1 and YouSee.<br />
Through YouSee, TDC offers quad-play (fixed and mobile telephony, broadband and<br />
TV) solutions via its cable TV network. The ownership of YouSee is a large competitive<br />
advantage for TDC compared with many other sector peers that have had to<br />
divest their domestic cable TV subsidiaries for regulatory reasons.<br />
Very competitive market conditions focus on cost reductions<br />
The Danish telecoms market is very competitive and substantial price discounting<br />
and expansion of flat rate products in the landline, mobile and broadband markets<br />
have had negative effects on revenues and margins. There is also an ongoing transition<br />
of customers from landline telephony to mobile voice and from landline broadband<br />
to mobile broadband. Despite the tough competition and the recent economic<br />
downturn, the Danish telecoms market has shown some growth in recent years, with<br />
a compound annual growth rate of 0.9% over 2007-09. While the number of landline<br />
customers has declined, the mobile broadband market has shown very rapid growth.<br />
This trend is likely to continue in the coming years.<br />
Considering the tough competitive climate, TDC has actively worked on reducing its<br />
operating expenses in recent years while at the same time continuously making large<br />
infrastructure investments. This enabled the company to achieve 6% compound<br />
growth in EBITDA over 2007-09 in spite of declining revenues. At the same time,<br />
the EBITDA margin rose from 33.5% at the end of 2007 to 41.2% at the end of 2010.<br />
BUY<br />
Sector: Telecommunication Services,<br />
Diversified Telecom Services<br />
Corporate ticker: TDCDC<br />
Equity ticker: TDC DC<br />
Market cap: DKK 44bn<br />
Ratings:<br />
S&P rating: BBB / S<br />
Moodys rating: Baa2 / S<br />
Fitch rating: BBB / S<br />
Analysts:<br />
Louis Landeman<br />
Louis.landeman@danskebank.se<br />
+46 8 568 80524<br />
Jakob Magnussen, CFA<br />
Jakob.magnussen@danskebank.dk<br />
+45 45 128503<br />
Key credit issues<br />
Strengths:<br />
• TDC is the clear market leader in<br />
the Danish telecoms market<br />
• The ownership of YouSee is a<br />
large competitive advantage compared<br />
with sector peers<br />
• TDC has a good track record in<br />
delivering on cost reductions<br />
• The new financial policy aims at<br />
maintaining investment grade<br />
credit ratings<br />
Challenges:<br />
• The Danish telecoms market is<br />
very competitive with substantial<br />
price discounting<br />
• TDC has relatively limited geographic<br />
diversification with a large<br />
dependence on the Danish telecoms<br />
market<br />
• The targeted dividend pay-out ratio<br />
is very high<br />
• There are some longer-term uncertainties<br />
related to the ownership<br />
of TDC<br />
Source: <strong>Danske</strong> Markets<br />
164 | 13 April 2011<br />
www.danskeresearch.com
<strong>Scandi</strong> Handbook<br />
Liquidity<br />
We regard TDC’s liquidity position as fully satisfactory, with underlying strong free<br />
cash flow generation and only limited short-term debt maturities. In 2010, TDC’s<br />
operating cash flow amounted to DKK7.2bn (2009: DKK7.4bn) while capital expenditure<br />
amounted to DKK3.5bn (2009: DKK3.9bn). At the end of 2010, TDC had cash<br />
of DKK831m while short-term loans amounted to DKK216m. The remaining debt<br />
outstanding under TDC’s senior debt facilities amounted to DKK17.8bn at the end of<br />
2010, while the remaining EMTN bonds amounted to DKK5.4bn with maturities in<br />
2012 (DKK3.4bn) and 2015 (DKK2bn). In February this year, TDC issued<br />
EUR2.25bn (DKK16.8bn) of new bonds with maturities in 2015, 2018 and 2023. The<br />
proceeds from the bond issues together with other liquidity were used to fully repay<br />
the secured senior credit facilities. At the same time, TDC signed new credit facilities<br />
totalling EUR700m with an average maturity of 4.4 years.<br />
Current performance drivers<br />
Stable performance in Q4 but mobile competition intensifying<br />
TDC’s Q4 10 sales and earnings were broadly in line with the development noted<br />
during the previous quarters. While sales in the core Danish business remain under<br />
pressure – both in the Consumer and Business segments – this was offset by continued<br />
strong sales growth in YouSee (TV) and Nordic. Year-on-year group sales rose<br />
by 1.4%, with a 1.6% growth in EBITDA, which meant that the EBITDA margin<br />
was stable at 39% compared with the same period in the previous year. TDC reaffirmed<br />
its 2011 guidance of revenues at a similar level to 2010, with EBITDA growth<br />
of 2% and a capex-to-sales ratio of 13% (2010: 13.5%).<br />
A downside risk that we see for TDC’s revenues and EBITDA in 2011 is the intense<br />
competition in the Danish mobile market that has recently intensified further due to<br />
aggressive price offers in the discount segment from the new MVNO Onfone. With<br />
four mobile network operators in Denmark and additional capacity offered by the<br />
upgrades to HSPA and LTE, we see a risk that competition will continue to intensify<br />
during the coming quarters – with subsequent margin erosion for all operators including<br />
TDC – until some type of consolidation eventually takes place.<br />
Significant debt reduction following proceeds from Sunrise divestment<br />
At the end of October, TDC announced that it had completed the divestment of Sunrise<br />
in Switzerland with total cash proceeds of CHF3.3bn (DKK18.4bn). Following<br />
this, TDC decided to prepay DKK8.2bn of senior bank debt while also carrying out<br />
DKK9bn of share buybacks. In mid-December, TDC’s majority owner NTC completed<br />
an IPO of 210 million TDC shares at DKK51 per share, resulting in total proceeds<br />
of DKK10.7bn. After the completion of the IPO, NTC redeemed its outstanding<br />
DKK10.8bn of high yield bonds.<br />
Mainly due to higher taxes paid during the quarter, TDC’s operating cash flow fell in<br />
Q4 10 compared with Q4 09. Still, thanks to the divestment of Sunrise, TDC substantially<br />
reduced its debt in Q4, with net debt of DKK22.8bn at year-end 2010 (end-Q3:<br />
DKK30.7n). In addition to the on-balance sheet debt, TDC has operating leases totalling<br />
some DKK7.3bn. We estimate that TDC’s lease-adjusted net debt to EBITDA<br />
amounted to around 2.6x at year-end 2010 (not adjusting the EBITDA for restructuring<br />
costs; 2.9x when also adjusting the EBITDA for restructuring costs), compared<br />
with 3.1x at end-Q3 (excluding NTC debt).<br />
Investment grade financial policy<br />
In relation to the IPO, TDC presented a new financial policy. According to this policy,<br />
TDC aims to maintain stable investment grade ratings. The targeted leverage is a<br />
net debt to EBITDA ratio of 2.1x. Acquisitions are expected to be bolt-on and in<br />
Denmark and other Nordic countries. For the financial year 2011, a dividend of<br />
DKK4.35 per outstanding share is targeted, corresponding to DKK4.3bn, while for<br />
subsequent years a dividend payout of 80-85% of ‘equity free cash flow’ is targeted.<br />
165 | 13 April 2011<br />
Debt maturity profile (Dec 31, 2010)<br />
DKKm<br />
12<br />
10<br />
8<br />
6<br />
4<br />
2<br />
0<br />
Source: Company data and <strong>Danske</strong> Markets<br />
Profitability<br />
DKKm<br />
45 000<br />
40 000<br />
35 000<br />
30 000<br />
25 000<br />
20 000<br />
15 000<br />
10 000<br />
5 000<br />
0<br />
11 12 13 14 15<br />
Source: Company data and <strong>Danske</strong> Markets<br />
EBITDA by segments (2010)<br />
Operations<br />
10%<br />
2006 2007 2008 2009 2010<br />
Source: Company data and <strong>Danske</strong> Markets<br />
Debt metrics (TDC level)<br />
DKKm<br />
60 000<br />
50 000<br />
40 000<br />
30 000<br />
20 000<br />
10 000<br />
0<br />
Source: Company data and <strong>Danske</strong> Markets<br />
www.danskeresearch.com<br />
45%<br />
40%<br />
35%<br />
30%<br />
25%<br />
20%<br />
15%<br />
10%<br />
5%<br />
0%<br />
Sales EBITDA EBITDA-Margin (rhs<br />
YouSee<br />
13%<br />
Consumer<br />
38%<br />
Nordic<br />
5%<br />
2006 2007 2008 2009 2010<br />
Business<br />
34%<br />
X<br />
4,5<br />
4,0<br />
3,5<br />
3,0<br />
2,5<br />
2,0<br />
1,5<br />
1,0<br />
0,5<br />
0,0<br />
Net debt Equity Net debt/EBITDA (rhs)
<strong>Scandi</strong> Handbook<br />
This is relatively high compared with sector peers and leaves only limited room for<br />
potential add-on acquisitions and/or increased investment levels in spite of TDC’s<br />
strong free cash flow generation.<br />
De-leveraging positive for bondholders and ratings<br />
The debt reduction related to the Sunrise divestment and the IPO is obviously very<br />
positive for bondholders as it has once again allowed a return to investment grade<br />
ratings. We are also pleased by TDC’s new financial policy as it is targeting a lower<br />
leverage than we had expected. As of Q4 10, TDC’s reported unadjusted net debt to<br />
EBITDA stood at 2.1x, which is exactly at the level targeted by the company. At the<br />
same time, TDC’s targeted dividend pay-out ratio is very high, which leaves only<br />
limited room for potential add-on acquisitions and/or increased investment levels in<br />
spite of TDC’s strong free cash flow generation.<br />
Following the completion of the IPO, S&P, Moody’s and Fitch all upgraded TDC’s<br />
ratings back to investment grade. S&P initially assigned a one notch lower issue<br />
rating on TDC’s EMTN bonds (BBB-) than Moody’s (Baa2) and Fitch (BBB). However,<br />
following TDC’s new bond issues and the refinancing of its bank facilities,<br />
S&P also upgraded its bond ratings to BBB.<br />
In order to maintain a stable outlook on TDC’s ratings, S&P said that it wants the<br />
company to maintain its current EBITDA margin of 41% and solid free cash flow<br />
generation. Moody’s said that it expects TDC to maintain an adjusted debt to<br />
EBITDA ratio of 2.5x and a retained cash flow to debt ratio close to 20%. It also<br />
expects the company to only make bolt-on acquisitions within the guidance metrics<br />
for the current ratings.<br />
In order for TDC to maintain a mid-BBB credit profile, we expect the company to<br />
maintain low leverage as the company’s business risk is somewhat higher than its<br />
Nordic sector peers, TeliaSonera and Telenor, due to TDC’s more limited geographic<br />
diversification and dependence on the Danish telecoms market. On the positive side,<br />
TDC has a more limited exposure to volatile emerging markets than Telenor and<br />
TeliaSonera.<br />
Recommendation<br />
With TDC still being majority owned by a private equity consortium, we believe that<br />
there are some uncertainties with regard to the company’s long-term ownership structure.<br />
Still, we regard the company’s announced strategy positively as it suggests that<br />
M&A activity will be limited, with leverage rather maintained around its current low<br />
level.<br />
We believe that TDC’s newly issued bonds came at an attractive level and we have<br />
therefore assigned BUY recommendations to both the 3.5% Feb 2015 and 4.375%<br />
Feb 2018 bonds. While the new 2015 bonds are trading somewhat inside the old<br />
5.875% Dec 2015 bonds, the new bonds contain change of control language (with a<br />
coupon step-up of 125bp in case ratings fall below investment grade) which the old<br />
bonds do not. Considering the uncertainty related to the ownership structure of TDC<br />
over the longer term we regard this as a positive feature with the new bond issues<br />
which should also warrant a certain spread premium. Following substantial tightening<br />
on the 6.5% Apr 2012 bond, we now downgrade our recommendation on this<br />
bond from BUY to HOLD (see list of instrument prices at the end of this book).<br />
166 | 13 April 2011<br />
www.danskeresearch.com
<strong>Scandi</strong> Handbook<br />
Financial data TDC<br />
Key figures (DKKm) 2006 2007 2008 2009 2010<br />
Net Sales 39,941 36,779 35,609 26,079 26,167<br />
EBITDA 6,188 4,820 3,031 4,758 4,069<br />
EBIT 44,343 866 635 7,990 70<br />
Net interest expenses 2,723 2,401 1,719 2,064 1,496<br />
Net profit 3,443 3,632 557 2,383 3,007<br />
FFO [1] 10,026 9,217 6,640 10,472 8,171<br />
Capex [2] 5,595 3,545 3,539 3,891 3,534<br />
FCF [3] 4,546 6,326 3,624 6,728 5,208<br />
RCF [4] -34,317 8,351 6,005 2,482 8,101<br />
Net Debt [5] 55,221 41,516 35,032 33,635 22,813<br />
Adjusted net debt [6] 58,946 48,971 46,228 43,397 30,615<br />
Total Debt 58,676 49,813 41,750 34,398 23,644<br />
Equity 3,571 32,021 31,680 27,078 20,855<br />
Ratios<br />
EBITDA margin 33% 32.0% 34.3% 40.4% 41.2%<br />
Net debt / EBITDA 4.3x 3.5x 2.9x 3.2x 2.1x<br />
Adjusted net debt / EBITDA 4.2x 3.8x 3.8x 4.1x 2.9x<br />
Adjusted FFO interest coverage [7] 2.6x 2.2x 2.0x 4.4x 4.0x<br />
Adjusted FFO/net debt 18% 20% 16% 26% 29%<br />
Adjusted RCF/debt -53% 16% 13% 7% -1%<br />
Adjusted debt/total capital 95% 64% 63% 62% 60%<br />
(1) Cash flow from operating activities before changes in working capital. (2) Investments in tangible assets. (3) Cash flow from operating activities less capex. (4)<br />
Cash flow from operating activities less dividends but before changes in working capital. (5) Total interest-bearing debt less cash and marketable securities. (6)<br />
Net debt adjusted for contingent liabilities/contractual obligations, pension liabilities and debt in subsidiaries, which are not wholly owned and operating leases.<br />
Source: Company Data and <strong>Danske</strong> Fixed Income Credit Research<br />
Quarterly review (DKKm)<br />
Q4 09 Q1 10 Q2 10 Q3 10 Q4 10<br />
Net sales 6,565 6,549 6,547 6,460 6,609<br />
EBITDA 2,686 3,345 3,350 2,784 2,726<br />
EBITDA margin (%) 41% 41% 41% 43% 41%<br />
Net income 441 264 657 686 626<br />
Net debt 33,635 33,669 32,963 30,725 22,813<br />
Adj. Net debt/LTM EBITDA (excl ALC) 3.1x 3.2x 3.1x 2.8x 2.1x<br />
Source: Company data and <strong>Danske</strong> Fixed Income Credit Research. Not adjusted for operating leases and contingent liabilities.<br />
Divisional quarterly overview (DKKm)<br />
Q4 09 Q1 10 Q2 10 Q3 10 Q4 10<br />
Consumer EBITDA 1,000 1,006 1,004 1,042 989<br />
Business EBITDA 956 932 893 907 912<br />
Nordic EBITDA 425 118 135 161 150<br />
Operations & Wholesale EBITDA 294 287 226 298 303<br />
YouSee EBITDA 694 323 326 352 352<br />
Source: <strong>Danske</strong> Markets<br />
167 | 13 April 2011<br />
www.danskeresearch.com
<strong>Scandi</strong> Handbook<br />
Telenor<br />
Company overview<br />
Telenor is one of the world’s largest telecom operators with some 203 million mobile<br />
subscribers, a workforce of 33,200 employees and reported revenues of NOK95bn in<br />
2010. The company is the dominant telecom operator in Norway and also provides fullscale<br />
telecoms services in the Swedish and Danish markets. In addition Telenor has<br />
mobile operations in a large number of countries in both Europe and Asia, including<br />
Hungary, Serbia, Montenegro, Malaysia, Pakistan, Bangladesh, Thailand, India and<br />
Russia. The international operations has shown rapid growth and in 2010 Telenor’s<br />
non-Nordic operations made up for 56% of total group EBITDA. The Norwegian government<br />
holds a 54% stake in Telenor. In case of a strategic transaction, the Norwegian<br />
state could potentially reduce its stake to one-third. Both S&P and Moody’s currently<br />
give Telenor’s rating a one-notch uplift due to the AAA-rated Norwegian state ownership<br />
of the company.<br />
Key credit considerations<br />
Strong cash flows from domestic operations<br />
Telenor’s key credit strength is the strong cash flows generated from its domestic<br />
operations in Norway, and its well diversified international operations that offers<br />
good growth. Telenor is the market leader in all segments of the telecoms industry in<br />
Norway. In the Norwegian mobile market, Telenor mainly competes with TeliaSonera’s<br />
subsidiary Netcom, with Tele2 as the third largest operator. Tele2 operates as<br />
an MVNO (mobile virtual network operator) in Netcom’s network. Telenor’s domestic<br />
fixed-line revenues have for several years been under pressure from fixed-tomobile<br />
substitution and churn towards VoIP. Telenor addresses these challenges<br />
through cost reductions. In 2010 the company managed to maintain a stable overall<br />
EBITDA margin in Norway at 40%. The free cash flow generation from the domestic<br />
operations also remains strong, with an EBITDA minus capital expenditures of<br />
NOK7.6bn in 2010 (2009: NOK7.9bn)<br />
International mobile offers good growth but with higher risk profile<br />
The general revenue and price pressure that Telenor is experiencing domestically is<br />
contrasted by the good growth offered by the company’s international operations, especially<br />
in Telenor’s emerging market operations. In several of these markets mobile<br />
penetration is still relatively low. As Telenor in recent years has carried out several<br />
acquisitions of mobile operators in both Eastern Europe and Asia the company is now<br />
well positioned to benefit from this growth. In combination with Telenor’s more stable<br />
operations in <strong>Scandi</strong>navia this results in a geographically well-diversified business,<br />
with good medium-term growth prospects.<br />
At the same time, Telenor’s large emerging markets footprint also means that the company<br />
has some geopolitical, economic and foreign exchange rate exposure to these<br />
markets. Due to the higher risk profile of certain countries where Telenor operates, we<br />
believe that it is important to consider Telenor’s credit ratios both including and excluding<br />
the EBITDA generated from those countries. For this reason, S&P in its analysis of<br />
Telenor tends to exclude EBITDA from Bangladesh, Pakistan, Montenegro and Serbia<br />
and proportionally consolidate EBITDA and debt from Thailand and Malaysia. Some<br />
of the emerging market operators are only partly owned by Telenor. As the different<br />
local partners in the ventures may have a different view than Telenor on the preferred<br />
business and financial strategy, Telenor does not have the same control over the operations<br />
in these operators that it has in its fully owned subsidiaries. This risk has recently<br />
been demonstrated both in Russia (Vimpelcom) and India (Uninor) where Telenor has<br />
had a different view than its other partners on issues such as M&A activity (Vimpelcom)<br />
and a potential stock listing of the venture (Uninor).<br />
SELL<br />
Sector: Telecommunication Services,<br />
Diversified Telecom Services<br />
Corporate ticker: TELNO<br />
Equity ticker: TEL NO<br />
Market cap: NOK152bn<br />
Ratings:<br />
S&P rating: A- / S<br />
Moodys rating: A3 / S<br />
Fitch rating: BBB+ / S<br />
Analyst:<br />
Louis Landeman<br />
Louis.landeman@danskebank.se<br />
+46 8 568 80524<br />
Jakob Magnussen, CFA<br />
Jakob.magnussen@danskebank.dk<br />
+45 45 128503<br />
Key credit issues<br />
Strengths:<br />
• Geographically well diversified <br />
both stable Nordics and growing<br />
emerging markets operations<br />
• Proven track record of developing<br />
emerging markets<br />
• Majority government ownership by<br />
AAA rated Norway<br />
• Low leverage and sound credit<br />
metrics<br />
Challenges:<br />
• Generous shareholder payout<br />
policy<br />
• Tough regulatory and competitive<br />
environment in the Nordic region<br />
• Large emerging markets exposure<br />
• Telenors operations in India have<br />
yet to prove profitable<br />
• Some event risk related to potential<br />
M&A activity<br />
Source: <strong>Danske</strong> Markets<br />
168 | 13 April 2011<br />
www.danskeresearch.com
<strong>Scandi</strong> Handbook<br />
Liquidity<br />
Telenor’s enjoys a fully satisfactory liquidity position in our view, with ample cash at<br />
hand and only limited short-term debt maturities. At the end of 2010 Telenor held<br />
total cash and cash equivalents of NOK13.6bn. In addition Telenor has access to<br />
committed credit facilities totalling some NOK21.2bn. The company also enjoys a<br />
strong underlying cash flow with a free operating cash flow after investments of<br />
NOK10.1bn in 2010. As of end 2010 Telenor’s short-term debt amounted to<br />
NOK8.8bn.<br />
Current performance drivers<br />
Operating margins down y/y due to losses in India<br />
Telenor’s Q4 results were mainly supported by continued good growth in the more<br />
mature markets in Asia. In the Nordic region, Sweden showed good growth while<br />
competition intensified in Norway and Denmark. Overall organic revenue growth<br />
rose to 8% y/y during the quarter. Consolidated group EBITDA rose to NOK7.0bn<br />
from NOK6.6bn the year earlier. The EBITDA margin fell to 29% (Q4 2009: 31%)<br />
due to the losses related to Telenor’s start-up mobile operator Uninor in India.<br />
Largely due to higher depreciation and taxes net income fell to NOK2.3bn (Q4 2009:<br />
NOK2.4bn).<br />
Net debt was reduced somewhat during the quarter<br />
Telenor’s operating cash flow after working capital rose to NOK5.4bn (Q4 2009:<br />
NOK4.8bn). Capital expenditure rose to NOK3.4bn (Q4 2009: NOK3.1bn). During<br />
the quarter, Telenor also bought back additional shares of NOK778m. Net debt was<br />
reduced somewhat to NOK20.8bn (Q3 2010: NOK21.4bn), resulting in a net debt to<br />
EBITDA of 0.7x (Q3 2010: 0.8x) and an adjusted net debt to LTM EBITDA of 1.1x<br />
(Q3 2010: 1.2x). Taking the conservative approach of also excluding EBITDA from<br />
the most volatile emerging markets and minorities in Thailand and Malaysia (as S&P<br />
normally does), this would bring the adjusted net debt to EBITDA to around 1.8x<br />
(Q3-10: 1.9x), well within the 2.5x that S&P considers adequate for the A- rating.<br />
Telenor has an internal target of reported net debt to EBITDA of maximum 1.6x.<br />
Moderate revenue growth and stable margins expected for 2011<br />
Telenor also presented its guidance for 2011, with expected organic revenue growth<br />
of at least 5% and an adjusted EBITDA margin of around 31% (2010: 30.8%). Capital<br />
expenditure is expected to be around 12-13% of sales. A dividend of NOK3.80<br />
per share is proposed for 2010. This pay-out ratio is at the high end of Telenor’s<br />
dividend policy range (40-60% of normalised annual profits). In addition, management<br />
stated that potential further share buy-backs will be evaluated during the coming<br />
quarters.<br />
Vimpelcom to acquire Wind Telecom<br />
Since 1998 Telenor has held a large ownership stake in the second largest mobile<br />
operator in Russia, Vimpelcom. The other large shareholder in Vimpelcom is the<br />
Russian Alfa Group and the telecoms arm of the Alfa Group, Altimo. Following<br />
several years of ownership disputes between Telenor and Alfa Group, the two companies<br />
decided to combined their holdings in Vimpelcom and the Ukrainian telecom<br />
operator Kyivstar into a separate and jointly owned company called Vimpelcom Ltd<br />
that was subsequently listed on the New York Stock Exchange. This transaction was<br />
completed in April 2010. Following this, Telenor holds a 39.6% economic interest<br />
and 36% of the voting rights in Vimpelcom Ltd.<br />
In mid January this year, Vimpelcom’s supervisory board said that it had approved<br />
the proposed merger of Vimpelcom and Wind Telecom. The combined company will<br />
hold telecom assets in 19 countries including Russia, Italy, Africa, the Middle East<br />
and Asia and create the world’s 6th largest telecom operator with over 173m mobile<br />
subscribers. While the Telenor-nominated board directors voted against the transaction,<br />
the six other board members (of which three Altimo-nominated and three inde-<br />
169 | 13 April 2011<br />
Estimated maturity profile<br />
NOKb<br />
30<br />
25<br />
20<br />
15<br />
10<br />
5<br />
0<br />
Cash and equivalents Short-term debt Long-term debt<br />
Source: Company data and <strong>Danske</strong> Markets<br />
Profitability<br />
NOKm<br />
120 000<br />
100 000<br />
80 000<br />
60 000<br />
40 000<br />
20 000<br />
0<br />
Source: Company data and <strong>Danske</strong> Markets<br />
EBITDA by segments (2010)<br />
Bangladesh<br />
9%<br />
Source: Company data and <strong>Danske</strong> Markets<br />
Debt metrics<br />
NOKm<br />
120 000<br />
100 000<br />
80 000<br />
60 000<br />
40 000<br />
20 000<br />
0<br />
2006 2007 2008 2009 2010<br />
Net Sales EBITDA EBITDA margin (rhs)<br />
Malaysia<br />
15%<br />
Broadcast<br />
Other 6%<br />
mobile<br />
10%<br />
Thailand<br />
16%<br />
Norway<br />
31%<br />
Sweden<br />
7%<br />
Denmark<br />
6%<br />
2006 2007 2008 2009 2010<br />
Source: Company data and <strong>Danske</strong> Markets<br />
www.danskeresearch.com<br />
37%<br />
36%<br />
35%<br />
34%<br />
33%<br />
32%<br />
31%<br />
30%<br />
29%<br />
28%<br />
27%<br />
1,8<br />
1,6<br />
1,4<br />
1,2<br />
1<br />
0,8<br />
0,6<br />
0,4<br />
0,2<br />
0<br />
Net debt Equity Net deb/EBITDA (rhs)
<strong>Scandi</strong> Handbook<br />
pendent) voted in favour of it. If the transaction goes through, Telenor’s voting rights<br />
in Vimpelcom would be reduced to 25% (from 36%), with an economic ownership<br />
stake of 31.7% (from 39.6%). Due to Wind’s high leverage, the debt burden of the<br />
combined group will also increase materially with pro forma net debt of around USD<br />
21.7bn and a net debt to EBITDA of 2.3x. As the issuance of new shares had to be<br />
approved by a majority of shareholders, a shareholders’ meeting was held at March<br />
17. Although Telenor fought hard to stop the acquisition, the transaction was approved<br />
by a majority of the shareholders (53%) that participated at the shareholders’<br />
meeting. Vimpelcom’s CEO has stated that he now expects the transaction with<br />
Wind to close within the coming month. Following this, Moody’s downgraded its<br />
ratings on Vimpelcom to Ba3 from Ba2 as it believes that the financial risk of the<br />
company will increase following the merger with Wind.<br />
We see it as credit negative for Telenor that Vimpelcom’s acquisition of Wind now<br />
seems to be going ahead. Due to Wind’s higher leverage we believe that this will<br />
reduce Vimpelcom’s potential for dividend distributions. Also Telenor’s influence on<br />
Vimpelcom’s strategy will be reduced due to its diluted ownership stake in the company.<br />
While Telenor has requested an arbitration tribunal to determine if Telenor is<br />
entitled to exercise its pre-emptive rights related to the issuance of new Vimpelcom<br />
shares, it is currently uncertain if Telenor will have any success with this claim.<br />
Telenors investment in India is a credit negative<br />
During 2009 and 2010, Telenor gradually acquired 67.25% of the Indian greenfield<br />
mobile operator Unitech Wireless, now named Uninor. Due to its early stage of operation,<br />
Uninor is currently heavily loss making and will demand large investments<br />
before it can become profitable and achieve positive cash flows. We therefore regard<br />
Telenor’s investment in Uninor as a credit negative event.<br />
In Q4 2010 Uninor reported a negative EBITDA of 1.0bn, somewhat less than in Q3<br />
(NOK1.1bn). The company continued to grow strongly, with revenue growth of 87%<br />
in Q4 from Q3 to NOK400m. In 2011 Uninor is expected to generate an EBITDA<br />
loss around NOK4bn, with capital expenditure of NOK1-1.5bn. In addition to tough<br />
competition, the regulatory environment in India is challenging, which causes some<br />
uncertainties for Telenor’s investments in the country. Currently, Indian authorities<br />
are investigating if there were any wrongdoings when 2G licenses were issued to<br />
Uninor and other operators in 2008. While these corruption charges have been directed<br />
directly towards the minority (33%) partner Unitech and its Managing Director<br />
rather than towards Uninor or Telenor, there is still a risk that the licenses could<br />
be revoked as they were originally issued to Unitech.<br />
S&P revises its outlook on Telenor to stable<br />
In early April, S&P revised its outlook on its A- rating on Telenor to stable from<br />
negative. According to S&P, Telenor’s balance sheet should be strong enough to<br />
accommodate one off risk events related to its investments in Vimpelcom and India<br />
and moderately sized acquisitions. S&P expects Telenor to maintain an adjusted debt<br />
to EBITDA ratio of maximum 2x with an FFO to debt above 40%.<br />
Recommendation<br />
All in all, Telenor demonstrated a solid performance in Q4. The company’s current<br />
leverage is only moderate and should be well in line with the rating requirements.<br />
Telenor’s credit ratings also benefit from an uplift due to the 54% ownership by the<br />
Kingdom of Norway. However, considering the expected negative cash flows from<br />
India, Telenor’s rather shareholder friendly payout policy, and the company’s general<br />
appetite for acquisitions, we continue to see a we see a clear risk that debt ratios will<br />
deteriorate in the coming year to a level that would be too high for the company’s A-<br />
/A3 ratings. Considering this risk we believe that Telenor’s bonds are trading tight<br />
compared to sector peers and therefore maintain our SELL recommendation (see list<br />
of instrument prices at the end of this book).<br />
170 | 13 April 2011<br />
www.danskeresearch.com
<strong>Scandi</strong> Handbook<br />
Financial data Telenor<br />
Key figures (NOKm) 2006 2007 2008 2009 2010<br />
Net Sales 91,077 92,473 96,167 97,650 94,843<br />
EBITDA 32,687 29,257 29,809 30,918 28,648<br />
EBIT 17,708 14,985 15,708 13,321 12,500<br />
Net interest expenses 1,811 1,476 3,172 2,184 1,989<br />
Net profit 18,477 19,203 14,810 10,104 14,808<br />
FFO [1] 32,770 24,368 24,600 30,666 23,945<br />
Capex [2] 19,036 19,063 17,465 13,014 11,688<br />
FCF [3] 11,605 4,633 8,164 17,608 14,777<br />
RCF [4] 28,405 19,248 17,408 29,136 17,719<br />
Net Debt [5] 43,210 40,408 47,108 27,863 20,846<br />
Adjusted Net debt [6] 55,187 48,778 57,902 38,501 31,484<br />
Total Debt 49,957 47,249 56,033 39,342 34,452<br />
Equity 62,728 74,655 88,568 85,381 96,218<br />
Ratios<br />
EBITDA margin 36% 32% 31% 32% 30%<br />
Net debt / EBITDA 1.3x 1.4x 1.6x 0.9x 0.7x<br />
Adjusted net debt / EBITDA 1.6x 1.6x 1.8x 1.2x 1.1x<br />
Adjusted FFO interest coverage [7] 12.3x 8.1x 7.3x 9.7x 11.7x<br />
Adjusted FFO/net debt 61% 52% 44% 83% 78%<br />
Adjusted RCF/debt 46% 36% 25% 62% 36%<br />
Adjusted debt/total capital 50% 43% 43% 37% 32%<br />
(1) Cash flow from operating activities before changes in working capital. (2) Investments in tangible assets. (3) Cash flow from operating activities less capex. (4)<br />
Cash flow from operating activities less dividends but before changes in working capital. (5) Total interest-bearing debt less cash and marketable securities. (6) Net<br />
debt adjusted for contingent liabilities/contractual obligations, pension liabilities and debt in subsidiaries, which are not wholly owned and operating leases. Source:<br />
Company Data and <strong>Danske</strong> Fixed Income Credit Research<br />
Quarterly review (NOKm)<br />
Q4 09 Q1 10 Q2 10 Q3 10 Q4 10<br />
Net sales 24,191 23,952 25,177 24,096 24,858<br />
EBITDA 6,691 7,088 6,891 7,746 6,962<br />
EBITDA margin (%) 28% 30% 27% 32% 28%<br />
Net income 2,774 1,149 9,582 1,771 2,306<br />
Net debt 27,863 22,692 26,981 21,442 20,846<br />
Net debt/LTM EBITDA 0.9x 0.8x 0.9x 0.8x 0.7x<br />
Source: Company data and <strong>Danske</strong> Fixed Income Credit Research<br />
Divisional quarterly overview, EBITDA (NOKm)<br />
Q4 09 Q1 10 Q2 10 Q3 10 Q4 10<br />
Norway 2,444 2,680 2,561 2,627 2,601<br />
Sweden 529 549 546 609 561<br />
Denmark 488 445 381 413 505<br />
Pannon - Hungary 490 499 496 599 155<br />
DTAC - Thailand 953 1,075 1,145 1,296 1,307<br />
DiGi - Malaysia 882 999 1,104 1,167 1,229<br />
Grameenphone - Bangladesh 717 798 719 892 802<br />
Other mobile operations 637 579 715 738 684<br />
UniNor -677 -974 -1,132 -1,115 -1,026<br />
Broadcast 497 527 525 619 532<br />
Other Operations 66 -19 -85 33 -158<br />
Note: Source: Company data and <strong>Danske</strong> Fixed Income Credit Research<br />
171 | 13 April 2011<br />
www.danskeresearch.com
<strong>Scandi</strong> Handbook<br />
TeliaSonera<br />
Company Overview<br />
TeliaSonera is the result of the merger between the incumbent Swedish and Finnish<br />
telecom operators Telia and Sonera in 2002. The Swedish and Finnish governments<br />
are still the largest shareholders in the company with ownership stakes of<br />
37.3% and 13.7% respectively. TeliaSonera is one of the largest telecom operators<br />
in Europe. The company holds a leading position in Sweden and Finland, a number<br />
two position in Norway and a number three position in Denmark. The company<br />
also holds leading market positions in the three Baltic countries Estonia, Latvia and<br />
Lithuania. TeliaSonera also has a large international presence outside the Nordic<br />
and Baltic region with a presence in the emerging markets of Eurasia, including<br />
Russia and Turkey, and in Spain. TeliaSonera’s operations are organised in the<br />
business areas Mobility Services, Broadband Services, Eurasia and Other operations.<br />
At the end of 2010, TeliaSonera had a total client base of some 157m subscribers.<br />
Key credit considerations<br />
Well diversified operations but intense competition<br />
TeliaSonera’s operations are well diversified with a healthy mix of stable earnings in<br />
its Nordic and Baltic home region, while faster growth is offered by operations in the<br />
more volatile markets in Eurasia. In 2010, close to 75% of total group revenues<br />
were generated in the Nordic and Baltic region. Revenues and margins in Broadband<br />
Services have in recent years been under pressure from fixed to mobile substitution<br />
and migration from traditional voice to VoIP. Also in Mobility Services competition<br />
and price pressure have intensified. At the same time, the recent strong uptake<br />
of smartphone usage in the Nordic area has significantly helped to improve growth<br />
prospects in this business area. To spur a continued development of this positive<br />
trend TeliaSonera has taken several initiatives to further roll out its 4G mobile networks<br />
and fibre to the home (FTTH) throughout the Nordic region. The Eurasian<br />
operations continue to be very profitable, with EBITDA margins around 50%. The<br />
operations in Eurasia are an important growth driver for TeliaSonera, but also carry a<br />
higher risk profile than the company’s traditional operations.<br />
Further privatisations remain uncertain<br />
As the Swedish minority government has stated that TeliaSonera remains on its privatisation<br />
list, there has been some speculation that a further tranche of the Swedish<br />
government’s shares in TeliaSonera could be placed in the market. At the same time,<br />
the opposition parties have objected to the privatisation plans. Recently, the Swedish<br />
parliament approved a proposal to limit the government’s mandate of a further privatisation<br />
of TeliaSonera and some other state-owned companies. While S&P does not<br />
include any ownership support in its ratings on TeliaSonera, Moody’s includes a one<br />
notch uplift from the Swedish and Finnish state ownership that according to Moody’s<br />
could be removed in case the Swedish state’s ownership drops below 20%. Given the<br />
political opposition against further privatisations in Sweden, we see it as unlikely that<br />
this would happen in the near future.<br />
HOLD<br />
Sector: Telecommunication Services,<br />
Diversified Telecom Services<br />
Corporate ticker: TLIASS<br />
Equity ticker: TLSN SS<br />
Market cap: SEK219bn<br />
Ratings:<br />
S&P rating: A-/ S<br />
Moodys rating: A3 / S<br />
Fitch rating: A- / S<br />
Analyst:<br />
Louis Landeman<br />
Louis.landeman@danskebank.se<br />
+46 8 568 80524<br />
Jakob Magnussen, CFA<br />
Jakob.magnussen@danskebank.dk<br />
+45 45 128503<br />
Key credit issues<br />
Strengths:<br />
• Leader in Sweden and Finland,<br />
among the dominant operators in<br />
other Nordic markets<br />
• Broad geographical diversification<br />
into emerging markets<br />
• Strong cash generation<br />
• Low financial gearing and solid<br />
debt coverage metrics<br />
Challenges:<br />
• Exposure to volatile emerging<br />
markets with regulatory and geopolitical<br />
risks<br />
• Tough competition and regulation<br />
in Nordic region<br />
• Heightened focus on shareholders<br />
• Some event risk related to potential<br />
debt-financed acquisitions<br />
Source: <strong>Danske</strong> Markets<br />
172 | 13 April 2011<br />
www.danskeresearch.com
<strong>Scandi</strong> Handbook<br />
Liquidity<br />
We regard TeliaSonera’s liquidity position as strong. The financial flexibility is<br />
supported by the company’s strong underlying cash flow generation. In 2010, the<br />
company generated operating cash flow of SEK27.4bn, with a free cash flow after<br />
capital expenditure of SEK12.9bn. At the end of 2010, TeliaSonera held cash and<br />
cash equivalents of SEK15.3bn while short-term borrowings amounted to SEK4.9bn.<br />
In December last year TeliaSonera signed a new 7-year revolving credit syndicated<br />
loan facility of EUR1bn to replace a similar facility maturing in December 2011. The<br />
company further strengthened its liquidity position in February and March this year<br />
as it issued a EUR750m 4.25% bond maturing in 2020 and a SEK4bn FRN bond at<br />
Stibor +45bp maturing in September 2012.<br />
Current performance drivers<br />
Further cost reductions in the pipeline<br />
As TeliaSonera’s result was negatively impacted by currency effects in Q4 10, reported<br />
net sales were down 2.8% compared to the year earlier, while EBITDA was unchanged.<br />
However, adjusted for currency effects and acquisitions, underlying revenue growth<br />
was 4.2%, with a 5.2% growth in EBITDA. The main growth engines were Mobility<br />
Services and Eurasia that showed underlying revenue growth of 6.9% and 20.8% respectively.<br />
In Broadband Services, underlying net sales declined 5%. For 2011 TeliaSonera<br />
has guided for 4% revenue growth with an improved EBITDA margin and a<br />
capex to sales ratio of 13-14% (2010: 14%). Further cost cuts are planned for this year,<br />
including a workforce reduction of some 800 employees (of which 640 in Sweden and<br />
165 in Finland).<br />
Dividend and share buyback announced<br />
TeliaSonera’s free cash flows after capital expenditures fell to SEK1.7bn (Q4 09:<br />
SEK4.1bn). This decline was due to higher capital expenditures and higher paid taxes.<br />
Net debt was virtually unchanged at SEK50bn (Q3 10: SEK49.7bn). This meant that<br />
the unadjusted net debt to EBITDA was unchanged at 1.4x. On a fully adjusted basis<br />
net debt to EBITDA was 1.9x, slightly below S&P’s guidance for the current A- rating.<br />
TeliaSonera announced both an ordinary dividend of SEK12.3bn (to be distributed in<br />
April) and a SEK10bn share buyback (that is to be carried out via a public offering).<br />
Mobile data and Eurasia continue to drive growth<br />
The positive development in Mobility Services was mainly driven by strong growth<br />
in mobile data services thanks to the strong uptake of smartphones. In Sweden underlying<br />
mobile net sales rose by 8% during the quarter, of which mobile data explained<br />
two thirds of the increase. Sales in Finland and Norway rose by a more moderate<br />
1.2% and 1.7% respectively. In Sweden, mobile margins were unchanged while in<br />
Finland they fell y/y. The development in Spain was also encouraging as sales rose<br />
52% y/y and the Spanish operator Yoigo reached its target of becoming EBITDApositive<br />
during the quarter. The performance in Denmark and the Baltic states was<br />
disappointing as local currency revenues and margins fell, negatively impacted by<br />
intensified competition and lower interconnect fees. Eurasia continued to grow<br />
strongly, with organic sales growth in local currencies of 17% and a high 54%<br />
EBITDA margin.<br />
Ownership disputes related to Turkcell and MegaFon still ongoing<br />
Apart from its majority-owned mobile operations in Eurasia, TeliaSonera has two large<br />
shareholdings in the associated companies MegaFon in Russia (43.8% owned by TeliaSonera)<br />
and Turkcell in Turkey (38% owned by TeliaSonera). MegaFon is the third<br />
largest mobile operator in Russia with some 57m subscribers at the end of 2010. The<br />
other large shareholders in MegaFon are the Alfa group (Altimo) with a 25% holding<br />
and AF Telecom with a 31% stake. Turkcell is the largest mobile operator in Turkey<br />
with some 31m subscribers. Turkcell is also partly owned by the Turkish Cukurova<br />
group and the Alfa Group (about 13% each). TeliaSonera has previously had some<br />
ownership disputes both with the Alfa Group and Cukurova over its holdings in Mega-<br />
173 | 13 April 2011<br />
Maturity profile as of end 2010<br />
SEKbn<br />
70<br />
60<br />
50<br />
40<br />
30<br />
20<br />
10<br />
0<br />
Cash and equivalents Short-term debt Long-term debt<br />
Source: Company data and <strong>Danske</strong> Markets<br />
Profitability<br />
SEKm<br />
120 000<br />
100 000<br />
80 000<br />
60 000<br />
40 000<br />
20 000<br />
Source: Company data and <strong>Danske</strong> Markets<br />
Debt metrics<br />
SEKm<br />
0<br />
160 000<br />
140 000<br />
120 000<br />
100 000<br />
80 000<br />
60 000<br />
40 000<br />
20 000<br />
0<br />
2006 2007 2008 2009 2010<br />
Source: Company data and <strong>Danske</strong> Markets<br />
EBITDA by segments (2010)<br />
Eurasia<br />
23 %<br />
Broadband<br />
Services<br />
35 %<br />
Source: Company data and <strong>Danske</strong> Markets<br />
www.danskeresearch.com<br />
36 %<br />
35 %<br />
34 %<br />
33 %<br />
32 %<br />
31 %<br />
30 %<br />
Net sales EBITDA EBITDA-margin (rhs)<br />
2006 2007 2008 2009 2010<br />
1,6x<br />
1,4x<br />
1,2x<br />
1,0x<br />
0,8x<br />
0,6x<br />
0,4x<br />
0,2x<br />
0,0x<br />
Net debt Equity Net debt/EBITDA (rhs)<br />
Other<br />
Operations<br />
2 %<br />
Mobility<br />
Services<br />
40 %
<strong>Scandi</strong> Handbook<br />
Fon and Turkcell. The disagreement with Cukurova over its shareholding in Turkcell<br />
dates back to 2005. In 2009, Cukurova was ordered by a Geneva court to sell its stake<br />
in Turkcell to TeliaSonera. Cukuvora has so far refused to comply and court proceedings<br />
in this matter are still ongoing. In November 2009 TeliaSonera and the Alfa Group<br />
reached an agreement to merge their ownership interests in MegaFon and Turkcell.<br />
However, this agreement is contingent on a satisfactory solution of the dispute with<br />
Cukurova. The proposed solution has been that the Alfa Group should acquire Cukurova’s<br />
stake in Turkcell and then include this with the new merged company. While we<br />
regard it as positive that TeliaSonera and the Alfa Group have reached an agreement, it<br />
still remains to be seen if a final resolution of the uncertain ownership situation in these<br />
companies can be achieved between all the parties involved.<br />
TeliaSonera has limited financial headroom in current ratings<br />
TeliaSonera’s operating performance during the past few quarters has been encouraging.<br />
Thanks to the good uptake in mobile data services in the Nordic region, the<br />
favourable growth in Eurasia and the intensified focus on cost reductions, the company<br />
has managed to deliver on some top-line growth and margin improvement in<br />
spite of the competitive and relatively mature nature of its home markets.<br />
We believe that TeliaSonera’s current leverage is in line with rating requirements.<br />
However, the combination of the SEK12.3bn dividend and the SEK10bn share buyback<br />
will bring leverage to the upper limit of what we think may be tolerable for<br />
S&P and Moody’s in order to maintain their A-/A3 ratings on TeliaSonera. Moody’s<br />
has also stated that it now sees TeliaSonera as “weakly positioned” in the A3 rating<br />
category. According to Moody’s, TeliaSonera’s adjusted debt to EBITDA ratio will<br />
rise to around 2.4x following the share buyback, which is at the higher end of the 2.0-<br />
2.5x range that Moody’s has indicated for the A3 rating. As TeliaSonera has a stipulated<br />
financial policy of maintaining A-/BBB+ ratings, we believe that potential<br />
downgrades to Baa1/BBB+ would be acceptable for the company.<br />
An additional risk that we see for TeliaSonera’s ratings is potential debt-financed<br />
acquisitions. The company is currently participating in a bidding auction for the<br />
Polish mobile operator Polkomtel. Polkomtel, valued at around EUR3.7bn<br />
(SEK33bn; valuation according to Bloomberg) is to be sold during the first half of<br />
this year. If TeliaSonera’s bid for Polkomtel is successful, we expect such a transaction<br />
to be structured in a way as to ensure that BBB+/Baa1 ratings are maintained.<br />
Apart from Polkomtel, TeliaSonera has previously expressed an interest to acquire<br />
the remaining minorities (41.5%) in the controlling company for its Eurasian operations,<br />
Fintur Holdings, currently held by Turkcell in case such an opportunity would<br />
arise at some point.<br />
Recommendation<br />
We expect TeliaSonera’s management to remain committed to its financial policy of<br />
maintaining A-/BBB+ ratings. Consequently, we expect any negative rating actions<br />
related to potential M&A activity to be limited to one notch. Considering this, we<br />
regard TeliaSonera’s current bond spreads as fair and maintain our HOLD recommendation<br />
(see list of instrument prices at the end of this book).<br />
174 | 13 April 2011<br />
www.danskeresearch.com
<strong>Scandi</strong> Handbook<br />
Financial data TeliaSonera<br />
Key figures (SEKm) 2006 2007 2008 2009 2010<br />
Net Sales 91,060 96,344 103,585 109,161 106,582<br />
EBITDA 32,266 31,021 32,954 36,666 36,977<br />
EBIT 25,489 26,155 28,648 30,324 32,083<br />
Net interest expenses 263 904 2,237 2,710 2,147<br />
Net profit 19,283 20,298 21,442 21,280 23,562<br />
FFO [1] 28,034 27,541 28,480 31,965 28,722<br />
Capex [2] 11,101 13,525 15,758 13,967 14,533<br />
FCF [3] 16,400 13,004 11,328 17,024 12,810<br />
RCF [4] 10,794 -2,164 8,616 20,812 15,347<br />
Net Debt [5] 14,892 34,155 48,614 46,175 50,092<br />
Adjusted Net debt [6] 11,989 -935 9,845 22,109 16,016<br />
Total Debt 26,495 41,957 60,440 68,663 65,436<br />
Equity 127,717 127,057 141,448 142,499 132,665<br />
Ratios<br />
EBITDA margin 35% 32% 32% 34% 35%<br />
Net debt / EBITDA 0.5x 1.1x 1.5x 1.3x 1.4x<br />
Adjusted net debt / EBITDA 0.8x 1.5x 2.1x 1.8x 1.8x<br />
Adjusted FFO interest coverage 17.4x 11.5x 7.6x 10.1x 13.4x<br />
Adjusted FFO/net debt 1.1x 0.6x 0.4x 0.5x 0.4x<br />
Adjusted RCF/debt 0.3x 0.0x 0.1x 0.2x 0.2x<br />
Adjusted debt/total capital 17% 28% 34% 33% 34%<br />
(1) Cash flow from operating activities after net interest paid and taxes paid but before change in working capital. (2) Investments in tangible & intangible assets. (3)<br />
Cash flow from operating activities before net interest paid and taxes paid but less capex. (4) OpFCF less net interest paid, tax paid, and dividends. (5) Cash flow from<br />
operating activities after net interest paid, taxes paid, change in working capital, and less dividend (6) Total interest-bearing debt less cash and marketable<br />
securities. (7) Net debt adjusted contingent liabilities/contractual obligations, pension liabilities and debt in subsidiaries, which are not wholly owned.<br />
Quarterly review (SEKm)<br />
Q4 09 Q1 10 Q2 10 Q3 10 Q4 10<br />
Net sales 27,410 26,090 26,964 26,754 26,774<br />
EBITDA 9,039 8,724 9,214 9,776 9,024<br />
EBITDA margin (%) 33% 33% 34% 37% 34%<br />
Net income 5,499 5,236 5,886 6,107 5,965<br />
Net debt 49,345 47,789 54,688 49,670 50,092<br />
Net debt/LTM EBITDA (x) 1.4x 1.3x 1.5x 1.4x 1.4x<br />
Source: Company data and <strong>Danske</strong> Fixed Income Credit Research<br />
175 | 13 April 2011<br />
www.danskeresearch.com
<strong>Scandi</strong> Handbook<br />
176 | 13 April 2011<br />
www.danskeresearch.com
<strong>Scandi</strong> Handbook<br />
Utilities<br />
177 | 13 April 2011<br />
www.danskeresearch.com
<strong>Scandi</strong> Handbook<br />
DONG Energy<br />
Company overview<br />
DONG Energy (DONG) is the largest energy company in Denmark, operating in most<br />
parts of the energy value chain. DONG derives its earnings from five operating segments:<br />
E&P, Renewable generation, Fossil Generation, Sales & Distribution and Energy<br />
Markets. DONG’s E&P division is responsible for exploration and production of<br />
oil and gas, predominantly in the North Sea, where the group has 73 E&P licences<br />
comprising some 446m boe proven oil and gas reserves. In 2010, DONG produced<br />
24.4m boe, indicating a reserve to production ratio of 19 years. DONG also has regulated<br />
gas and power distribution assets in Denmark. In Denmark, the group supplies<br />
11.4TWh of natural gas and 9.1TWh of electricity, corresponding to market shares of<br />
28% and 27%, respectively. The Generation and Renewables divisions comprises<br />
DONG’s power production, most of which is in Denmark. In 2010, the group produced<br />
20.2TWh and 53,200TJ of heat on its wind and fossil fuel-based generation fleet primarily<br />
based in Denmark and the UK. Going forward, DONG targets an increased<br />
share of wind assets. Through the Energy Markets segment, DONG procures and sells<br />
oil and gas in the North-West European energy markets. DONG is 76%-owned by the<br />
Kingdom of Denmark (AAA), with the bulk of the remainder owned by smaller Danish<br />
utilities. Both Moody’s and S&P apply one extra notch due to government support.<br />
Key credit considerations<br />
Attractive vertical integration and diversification<br />
Although falling, DONG still has a high share of its generation assets being thermally<br />
based, making it somewhat exposed to rising CO 2 allowance prices. The group<br />
is also negatively exposed to rising gas and coal prices in its generation fleet as these<br />
commodities serve as input. However, this is more than offset by positive exposure to<br />
gas prices in the E&P segment, creating a valuable internal hedge for the group. This<br />
is also true because of coal and gas being partially positively correlated. DONG<br />
benefits from positive exposure to rising Nord Pool prices. This winter this has been<br />
the case due to below average temperatures, low precipitation and low Nordic nuclear<br />
capacity. In that respect we also believe that the aftermath from the ongoing<br />
Fukushima nuclear crisis could end up being positive for DONG if politicians demand<br />
a scale down on Nordic and German nuclear capacity. This would benefit<br />
DONG, as the subsequent fall in neighbouring countries power supply would cause<br />
retail power prices to rise.<br />
Switching to wind<br />
DONG is seeking to reduce its dependence on fossil fuels through investments in<br />
renewable generation assets, in particular wind. In 2010 some 79% of DONG’s generated<br />
power was thermal based (84% in 2009), with the rest coming from renewable<br />
energy plants. DONG primarily seeks to fulfil its CO2 reduction target through massive<br />
offshore wind park investments. Until 2020 some 3GW is planned to be operation.<br />
In 2010 DONG had 0.7GW of offshore capacity. We regard it as credit-positive<br />
that DONG diversifies its generation base, although the subsequent large investments<br />
will weigh on group metrics in the short- to medium-term. As DONG wants to diversify<br />
its wind production portfolio, reducing reliance on any one wind power park, the<br />
group is actively seeking partnerships on its larger wind power parks. This was most<br />
recently exemplified by DONG’s sale of 50% of the 400MW Anholt offshore wind<br />
park to two Danish pension funds.<br />
Ownership<br />
The current agreement in the Danish parliament states that DONG should be majority-owned<br />
by the Kingdom of Denmark until at least 2015. Given the group’s importance<br />
to Denmark’s gas and power infrastructure, we expect the Danish state to be<br />
supportive of DONG should the company experience financial problems. Previous<br />
discussion about the possibility of an IPO appears to have left the debate, which is<br />
credit positive.<br />
BUY<br />
Sector: Utility, Electric Utility<br />
Corporate ticker: DANGAS<br />
Equity ticker: 1001Z DC<br />
Market cap: Not listed<br />
Ratings:<br />
S&P rating: A- / S<br />
Moodys rating: Baa1 / S<br />
Fitchs rating: BBB+ / S<br />
Analyst:<br />
Jakob Magnussen, CFA<br />
jakob.magnussen@danskebank.dk<br />
+45 45 128503<br />
Louis Landeman<br />
louis.landeman@danskebank.com<br />
+46 8 568 80524<br />
Key credit issues<br />
Strengths:<br />
• Well diversified across business<br />
areas and geography.<br />
• Solid share of earnings derived<br />
from regulated activities.<br />
• Proven focus on conserving debt<br />
metrics and protecting rating.<br />
• Majority government ownership<br />
with solid mandate.<br />
Challenges:<br />
• High capex budget directed at wind<br />
assets in particular.<br />
• Declining reserves in North Sea.<br />
• Exposed to rising CO 2 prices, predominantly<br />
fossil fuel fed Danish<br />
generation assets.<br />
• Time differences in earnings and<br />
P&L recognition yield volatility.<br />
Source: <strong>Danske</strong> Markets<br />
178 | 13 April 2011<br />
www.danskeresearch.com
<strong>Scandi</strong> Handbook<br />
Liquidity<br />
DONG’s short-term liquidity profile looks robust in our view. After 2010 DONG had<br />
some DKK11.8bn in cash & equivalents on its balance sheet, adequately covering<br />
short-term debt maturities of DKK4.4bn. Furthermore, we anticipate that DONG has<br />
additional DKK1.5bn of extra cash raised after Q4 from the net proceeds from the<br />
group’s new hybrid issuance and partial redemption of its old hybrid. DONG generated<br />
some DKK14.2bn of cash from operations in 2010. While we don’t expect such<br />
an amount to be repeated in 2011, we stress that cash generation is likely to also be<br />
high in 2011. This will be offset by some DKK13.3bn in capex (The three-year average<br />
of DKK40bn) and DKK2.2bn in proposed dividend payments.<br />
Combining all this, we don’t believe DONG should have any short-term liquidity<br />
issues. DONG’s evenly-spread medium-term debt maturity profile also protects<br />
against liquidity-consuming chunks of debt redemption over the coming year. Furthermore,<br />
DONG has access to some DKK12.6bn in committed credit facilities.<br />
While DONG doesn’t need the liquidity now, we note that the group prides itself<br />
with being a regular issuer in the euro bond market. We would therefore not be surprised<br />
to see DONG as an opportunistic issuer sometime during this year.<br />
Current performance drivers<br />
Strong Q4 earnings driven by high fossil and power prices<br />
The Q4 report from DONG revealed very strong quarterly and full-year figures beating<br />
DONG’s previous guidance from November. Higher oil and gas prices – and especially<br />
higher power prices in the latter part of Q4 – helped boost revenues which were up 20%<br />
y/y. Danish power prices for the full-year 2010, which were aided by very cold winter<br />
temperatures and below-average supply from neighbouring countries, were up 37% y/y.<br />
The strong top-line is furthermore a result of previous quarters’ investments in windassets<br />
and oil & gas fields starting to come on line and generating income. Group Q4<br />
EBITDA rose 68% y/y as a result of the combined effect of higher top-line and<br />
DONG’s strong focus on cost reductions and efficiency improvements. As a result<br />
group EBITDA-margin improved 2.8pp q/q to 25.2%. The improvement was furthermore<br />
facilitated by a widening of DONG’s generation margins as FIFO accounted<br />
input costs (coal and CO2) did not rise to the same extent as power prices.<br />
Very strong cash flow boosted credit metrics to stellar levels<br />
DONG’s strong earnings also fed through to cash generation, which was very strong in<br />
Q4. Group FFO rose 155% y/y. With a lower working capital and an unchanged level<br />
of capex, Group FOCF improved to DKK284m vs negative DKK1.2bn last quarter.<br />
This caused reported net debt to fall 8% q/q, which was lower than guidance given in<br />
Q3. When adjusting for 50% hybrid capital, leases, pensions and other obligations we<br />
see adjusted net debt at DKK38.8bn down 5% q/q. This leaves the adjusted LTM<br />
FFO/net debt figure at 32% up from 25% last quarter. Adjusted net debt to LTM<br />
EBITDA was 2.7x (3.3x after Q3). When further adjusting for 50% of the newly issued<br />
hybrid (call 2021), we see this metric at 2.6x. These levels are clearly better than<br />
DONG’s own financial policy and also strong for the current rating at both rating agencies.<br />
We caution though, that this quarter’s strong cash flow generation is not expected<br />
to be a recurring theme, as especially power prices were affected by exceptional supply<br />
and weather conditions in the Nordic region.<br />
Parts of asset base regulated<br />
DONG’s distribution, oil pipeline and heat activities are carried out on a regulated<br />
basis. We believe it is comforting that a meaningful part of group EBITDA over the<br />
cycle comes from this stable and predictable cash flow source. DONG also argues that<br />
its large and increasing wind power generation fleet could also be considered regulated.<br />
As DONG is guaranteed a certain return on its wind investments through feed-in tariffs<br />
or other subsidy schemes, it makes the group immune to fluctuating power prices and<br />
wind production up to a certain level. This argument is contingent on the government<br />
standing by its subsidy commitments, and public sentiment not turning more negative<br />
179 | 13 April 2011<br />
Debt maturity profile as of end 2010<br />
DKKbn<br />
16<br />
14<br />
12<br />
10<br />
8<br />
6<br />
4<br />
2<br />
0<br />
11<br />
12<br />
13<br />
Source: Company data, <strong>Danske</strong> Markets<br />
Profitability<br />
DKKm<br />
70,000<br />
60,000<br />
50,000<br />
40,000<br />
30,000<br />
20,000<br />
10,000<br />
0<br />
Hybrid debt<br />
Source: Company data, <strong>Danske</strong> Markets<br />
EBITDA by segment, 2010<br />
Generation<br />
14%<br />
Source: Company data, <strong>Danske</strong> Markets<br />
Debt metrics<br />
DKKm<br />
60,000<br />
50,000<br />
40,000<br />
30,000<br />
20,000<br />
10,000<br />
Renewables<br />
12%<br />
0<br />
14<br />
15<br />
16<br />
17<br />
18<br />
2006 2007 2008 2009 2010<br />
Source: Company data, <strong>Danske</strong> Markets<br />
www.danskeresearch.com<br />
19<br />
+20<br />
30%<br />
25%<br />
20%<br />
15%<br />
10%<br />
5%<br />
0%<br />
Net sales EBITDA EBITDA-margin (rhs)<br />
Energy<br />
Markets<br />
23% Sales &<br />
Distribution<br />
15%<br />
E&P<br />
36%<br />
2006 2007 2008 2009 2010<br />
net debt (excl. Hybrid)<br />
Net debt/EBITDA (rhs)<br />
Equity<br />
4.0x<br />
3.5x<br />
3.0x<br />
2.5x<br />
2.0x<br />
1.5x<br />
1.0x<br />
0.5x<br />
0.0x
<strong>Scandi</strong> Handbook<br />
on wind power. We believe that support is likely, even across changing governments<br />
over time, as future public tender competitions would suffer if the government were to<br />
go back on its “promised” wind subsidies from historical tender competitions.<br />
Outlook for 2011<br />
In its full-year report DONG guides for 2011 EBITDA at a similar level as in 2010.<br />
Given the strong performance in especially Q1 and Q4 10, we view this as a strong<br />
signal from DONG. The guidance reflects a surge in earnings from new investments<br />
coming on stream offsetting DONG’s expectations that the close to perfect market<br />
earnings environment (hedging effect, high generation margins and very high commodities<br />
prices) seen in 2010 probably won’t be repeated.<br />
DONG also made creditor-friendly adjustment to its capex budget. Previously DONG<br />
guided for 2011-13 net capex in the range of DKK45-55bn. The new capex guidance<br />
for the same time period is now only DKK40bn. The revision is made as DONG expects<br />
to scale up its ambitions of co-ownerships implying an uptake of partial asset<br />
divestments.<br />
Financial targets and rating<br />
The creditor-friendly revision of the capex budget was accompanied by a change in<br />
financial guidance in a credit-positive direction. Previously DONG guided for adjusted<br />
cash flow from operations to net debt of “around 3x”. The wording of the new<br />
targets is “up to 3x”. Currently this metric is reported at 1.8x vs 3.5x after Q3. Interestingly,<br />
DONG adjusts its net debt by 50% from the “old” hybrid, but 0% from the<br />
new hybrid. This is because S&P would assign 100% equity content to the new<br />
EUR700m hybrid if DONG’s senior rating was to be downgraded to ‘BBB+’. Currently<br />
DONG is ‘A-’ rated, and the “new” hybrid counts as 50% debt. DONG uses<br />
0% debt weight though, as the group’s capital structure minimum target is ‘BBB+’.<br />
Therefore DONG currently overstates the quality of this metric slightly. We believe<br />
it is slightly worrying that DONG’s rating minimum target implies a one notch<br />
downgrade from S&P. We stress though, that a downgrade by S&P could also imply<br />
a downgrade from Moody’s to ‘Baa2’ which is not acceptable according to DONG’s<br />
policy. We believe the current state of DONG’s metrics certainly does not point to a<br />
downgrade from anybody.<br />
Due to the 76%-ownership by the ‘AAA’ rated Kingdom of Denmark, both Moody’s<br />
and S&P’s factors in a one-notch uplift due to an assumed low dependence and medium<br />
support by the owner. The investment grade rating of the group reflects the low<br />
cyclical nature of DONG’s regulated distribution activities offset by the more volatile<br />
E&P activities combined with gas supply and power generation and supply, leaving the<br />
group exposed to volatile commodities and currency prices.<br />
New hybrid to supplement the old hybrid<br />
In January DONG redeemed some EUR500m of its ‘old’ hybrid (DANGAS 5.5%<br />
call 2015). At the same time DONG issued EUR700m in a ‘new’ hybrid (DANGAS<br />
7.75% call 21). From a senior unsecured perspective the increased loss absorbing<br />
junior capital base is obviously positive. This is further fuelled by the fact that the<br />
new hybrid is more equity-like compared with the old hybrid.<br />
Recommendation<br />
We believe that the strong 2010 results combined with more conservative capex and<br />
capital structure guidance underlines the quality of DONG from a credit perspective.<br />
We stress that metrics are likely to deteriorate from this very strong level as capex<br />
picks up and due to timing effects of working capital and investments. We believe<br />
that credit quality is very strong for the current spread-level of DONG’s outstanding<br />
bonds. We hence maintain our Buy recommendation, preferring the 2019’s and the<br />
hybrids. (See list of instrument prices at the end of this book.)<br />
180 | 13 April 2011<br />
www.danskeresearch.com
<strong>Scandi</strong> Handbook<br />
Financial data DONG Energy<br />
Key figures (DKKm) 2006 2007 2008 2009 2010<br />
Net Sales 36,564 41,625 60,777 49,262 54,598<br />
EBITDA 8,950 9,606 13,622 8,840 14,089<br />
EBIT 5,691 4,783 8,004 3,757 8,074<br />
Net interest expenses 592 740 1,134 1,362 1,595<br />
Net profit 5,039 3,259 4,815 1,138 4,464<br />
FFO [1] 9,670 8,729 9,418 7,529 12,498<br />
Capex [2] 4,946 10,718 9,529 15,956 15,073<br />
FCF [3] 6,011 -747 850 -6,488 -859<br />
RCF [4] 9,410 6,762 7,949 5,603 12,017<br />
Net Debt [5] 17,779 14,792 15,253 28,137 26,136<br />
Adjusted Net debt [6] 25,563 22,523 22,822 38,916 38,834<br />
Total Debt 27,760 17,309 18,047 35,206 37,903<br />
Equity 42,390 42,211 46,190 44,808 51,308<br />
Ratios<br />
EBITDA margin 24.5% 23.1% 22.4% 17.9% 25.8%<br />
Adjusted net debt / EBITDA 2.8x 2.3x 1.6x 4.2x 2.7x<br />
Adjusted FFO interest coverage [7] 5.7x 3.1x 3.1x 2.7x 3.0x<br />
Adjusted FFO/net debt 37% 38% 41% 19% 32%<br />
Adjusted RCF/debt 26% 26% 31% 12% 24%<br />
Adjusted debt/total capital 46% 37% 36% 51% 50%<br />
(1) Cash flow from operating activities before changes in working capital. (2) Investments in tangible assets. (3) Cash flow from operating activities less capex. (4) Cash flow from operating activities<br />
less dividends but before changes in working capital. (5) Total interest-bearing debt less cash and marketable securities. (6) Net debt adjusted for contingent liabilities/contractual obligations,<br />
pension liabilities and debt in subsidiaries, which are not wholly-owned and operating leases. Source: Company data, <strong>Danske</strong> Fixed Income Credit Research<br />
Quarterly review (DKKm)<br />
Q4 09 Q1 10 Q2 10 Q3 10 Q4 10<br />
Net sales 13,471 16,203 11,488 10,799 16,108<br />
EBITDA 2,010 4,343 3,276 2,413 4,057<br />
EBITDA margin 14.9% 26.8% 28.5% 22.3% 25.2%<br />
Net income 57 2,013 1,074 141 1,236<br />
Net debt 28,134 26,826 28,912 30,010 26,136<br />
Net debt/LTM EBITDA 3.6x 2.9x 2.8x 2.8x 2.1x<br />
Source: Company data, <strong>Danske</strong> Fixed Income Credit Research<br />
Divisional quarterly overview (DKKm)<br />
PRIMARY SEGMENTS Q4 09 Q1 10 Q2 10 Q3 10 Q4 10<br />
Exploration & Production Net sales 1,591 1,850 2,072 1,841 2,461<br />
EBITDA 545 1,076 1,276 1,086 1,574<br />
EBITDA margin 34% 58% 62% 59% 64%<br />
Renewables Net sales 664 710 680 685 872<br />
EBITDA 109 447 317 355 606<br />
EBITDA margin 16% 63% 47% 52% 69%<br />
Generation Net sales 3,309 4,219 2,128 1,470 3,513<br />
EBITDA 325 1,340 209 -162 477<br />
EBITDA margin 10% 32% 10% -11% 14%<br />
Sales & Distribution Net sales 3,744 4,687 2,941 2,643 3,914<br />
EBITDA 596 701 432 394 509<br />
EBITDA margin 16% 15% 15% 15% 13%<br />
Energy Markets Net sales 6,961 9,286 6,468 6,279 9,731<br />
EBITDA 318 962 1,154 354 737<br />
EBITDA margin 5% 10% 18% 6% 8%<br />
Source: Company data, <strong>Danske</strong> Markets .<br />
181 | 13 April 2011<br />
www.danskeresearch.com
<strong>Scandi</strong> Handbook<br />
Fortum<br />
Company overview<br />
Fortum is a diversified Finnish power and heat company operating in the Nordic countries,<br />
Poland, the Baltics and Russia. Fortum generates power through predominantly<br />
hydro and nuclear plants in the Nordic region. In 2010 the group generated some<br />
52.3TWh, making it the second-largest generator in the Nordic region behind Vattenfall.<br />
Roughly 69% of Fortum’s total power generation comes from non-CO2 emitting<br />
nuclear and hydro plants (91% if Russia is excluded) making it one of the “cleanest”<br />
generators in Europe after Statkraft. Apart from generation, which contributed some<br />
68% of operating profits in 2010, Fortum is also engaged in regulated heat and distribution,<br />
which comprise some 15% and 16% of EBIT, respectively. Minor parts of Fortum’s<br />
Nordic power and heat production stem from fossil-fuelled plants, some of which<br />
use renewable technologies such as biomass, peat and waste. In the Nordic market the<br />
group is the largest within distribution with some 1.6m electricity customers. The group<br />
is also largest in the Nordic region within district heating with annual deliveries of<br />
some 21.7TWh. Fortum’s Russian activities consist mainly of generation and heat with<br />
annual volumes of 22.1TWh and 34.8TWh, respectively. The Finnish Government is<br />
the largest shareholder with a 50.8% stake. Parliamentary approval is required to reduce<br />
the stake to less than 50.1%. Both S&P and Moody’s factor in one notch of government<br />
support, estimating support and dependence as medium.<br />
Key credit considerations<br />
Relatively low volatility in Nordic business profile<br />
We regard Fortum’s strong position as the largest heat and electricity distributor and the<br />
second-largest power generator in the Nordic market as very credit positive. Especially<br />
the group’s large exposure toward regulated distribution and heat, which combined<br />
contributed 31% of group EBIT in 2010, is credit positive. Together with the group’s<br />
extensive power price hedging programme, this yields large, stable and predictable cash<br />
flows. After 2010, 70% of 2011 power production was hedged and 40% for 2012. The<br />
average hedge price is EUR45/MWh and EUR44/MWh respectively, which is clearly<br />
below the current Nord Pool power price levels of about EUR60/MWh. We stress that<br />
current levels are elevated due to extraordinary issues such as excess demand due to a<br />
cold winter combined with supply shortages due to hydro and nuclear capacity issues.<br />
The group’s large share of hydro generation exposes it to Finnish and Swedish precipitation<br />
levels. We see a partial inverse relationship between precipitation levels (capacity)<br />
and Nordic power prices, yielding an attractive hedge as lower quantities will be<br />
offset by higher prices and vice versa. Fortum’s nuclear generation fleet creates a stable<br />
and low-cost base load capacity that contributes to high EBITDA margins. Fortum is<br />
currently expanding its nuclear footprint through its ownership in TVO, which is constructing<br />
the Olkiluoto 3 (Fortum’s share is 400MW) and seeking approval to build a<br />
fourth reactor (Olkiluoto 4). So far the Finnish politicians have not flagged any revisions<br />
to these plans on the back of the Fukushima nuclear crisis.<br />
Finland has a majority ownership stake in Fortum<br />
The AAA-rated Finnish state owns 50.8% of Fortum’s shares. The current agreement<br />
states that the government could reduce its stake to only 50.1%. Further divestments<br />
would require parliamentary approval. Both agencies factor in a one-notch uplift due to<br />
Fortum’s role as a supplier of key strategic utilities services. Fortum has a relatively<br />
aggressive payout history. In both 2009 and 2010 the figure was 66%, which to us is<br />
slightly credit negative as it exceeded the group’s stated payout policy of 50-60%. At<br />
Fortum’s CMD the CEO stated that he considered dividend payments to be important<br />
and that they should not be considered residual. To us this signals a rather credit negative<br />
shareholder focus.<br />
SELL<br />
Sector: Utility, Electric Utility<br />
Corporate ticker: FRTUM<br />
Equity ticker: FUM1V FH<br />
Market cap: EUR20.9bn<br />
Ratings:<br />
S&P rating: A / S<br />
Moodys rating: A2 / S<br />
Fitchs rating: A / S<br />
Analyst:<br />
Jakob Magnussen, CFA<br />
Jakob.magnussen@danskebank.dk<br />
+45 45 128503<br />
Louis Landeman<br />
louis.landeman@danskebank.com<br />
+46 8 568 80524<br />
Key credit issues<br />
Strengths:<br />
• Market leader in Finland with geographical<br />
diversification to the<br />
east.<br />
• Predominantly low CO2 emitting<br />
generation portfolio.<br />
• Solid credit metrics.<br />
• Owned by AAA-rated Finnish government.<br />
Challenges:<br />
• Increasing exposure to volatile<br />
Russian market with political/regulatory<br />
risk.<br />
• Current low reservoir levels in the<br />
Nordic region threaten group<br />
margins.<br />
• Increasing capex budget primarily<br />
directed at Russia.<br />
• Shareholder friendly focus, with<br />
above average payout policy.<br />
Source: <strong>Danske</strong> Markets<br />
182 | 13 April 2011<br />
www.danskeresearch.com
<strong>Scandi</strong> Handbook<br />
Liquidity<br />
Fortum had some EUR971m of cash & equivalents sitting on its balance sheet after<br />
2010, just covering reported short-term debt maturities of EUR862m. In 2010 Fortum<br />
generated some EUR1.4bn in cash from operations. This level is likely to be repeated<br />
or even exceeded in 2011 as hydro capacity improves. In connection with the 2010<br />
report Fortum stated that it wanted to accelerate its capex in respect of Russia. For<br />
2011 this implies an aggregate capex outlay of roughly EUR1.7bn. On top of this<br />
massive capex level, Fortum also revealed a dividend payment in 2011 of EUR888m.<br />
When adding these items, we see Fortum’s short-term liquidity situation as rather<br />
stretched.<br />
If Fortum wishes to avoid using its credit lines, we see them as a likely issuer in<br />
2011. After 2010 Fortum has some EUR2.9bn in committed credit facilities. Further<br />
issues that could partly alleviate funding needs are Fortum’s divestment of its Fingrid<br />
stake and Swedish heating assets. The cash raised from the Fingrid stake is<br />
EUR325m and some EUR220m from its Swedish heating assets.<br />
In general, the group has a policy that cash and cash equivalents and undrawn committed<br />
facilities should always cover the coming 12-months’ maturities and always<br />
amount to at least EUR500m.<br />
Current performance drivers<br />
High achieved Q4 power prices didnt feed through to earnings<br />
Fortum displayed a 22% growth in top-line in Q4, spurred by high Swedish and Finnish<br />
power prices as a consequence of continued low precipitation in the region, low nuclear<br />
output coupled with below average temperatures. This was further aided by a strong<br />
SEK/EUR and continued growth in Nordic industrial demand. Fortum stated that its<br />
achieved power price in Q4 was EUR51/MWh, which was lower than the average Q4<br />
spot price in the region of EUR62/MWh. The difference is due to Fortum’s short positions<br />
in the power futures market. Fortum’s Russian unit continued to deliver strong<br />
growth, fuelled by the Russian power liberalisation process, where the power price is<br />
now 100% unregulated and where the energy departments continues to deliver on its<br />
promised “beneficial” capacity payments. Fortum’s EBITDA fell 29% y/y due to<br />
higher than expected maintenance cost on Swedish nuclear reactors and impairments on<br />
short futures positions carried on the balance sheet. The low nuclear and hydroavailability<br />
also forced Fortum to increase its share of procurement from fossil-plants,<br />
where rising commodities prices yielded a negative development in Fortum’s procurement<br />
margins. Excluding the accounting effects of Fortum’s stock of short futures<br />
positions, group operating profit was largely unchanged y/y. Net earnings were<br />
EUR260m, short of market expectations of EUR305m.<br />
Fortum maintains its guidance for its view on future power prices, reiterating that the<br />
strong power demand levels seen in 2008 should not be expected until 2012-14.<br />
Leverage continues to edge higher<br />
Fortum’s FCF was negative EUR211m in Q4 as a consequence of a high capex level<br />
and short position in SEK/EUR derivatives used to hedge Fortum’s Swedishdenominated<br />
loans. The negative FCF caused Fortum’s net debt to increase to<br />
EUR6.8bn from EUR6.6bn after Q3 10. With EBITDA largely unchanged this leads<br />
to a rise in reported net debt to LTM EBITDA to 3x (2.7x in Q3). On adjusted figures,<br />
we see the metric at 3.3x. Adjusted FFO/net debt fell to 18.5% vs 20.8% last<br />
quarter.<br />
Russian investment to contribute to earnings volatility<br />
Currently Fortum owns 94.5% of the Russian OAO Fortum (the former TGC-10),<br />
which, combined with its 25% holding in TGC-1 makes the group quite exposed to its<br />
eastern neighbour. In 2010 the Russian division only constituted some 3% of group<br />
EBIT, as previous investments has yet to come on stream and generate income. While<br />
Debt maturity profile end 2010<br />
EURm<br />
1,400<br />
1,200<br />
1,000<br />
800<br />
600<br />
400<br />
200<br />
0<br />
Source: Company data and <strong>Danske</strong> Markets<br />
Profitability<br />
EURm<br />
7000<br />
6000<br />
5000<br />
4000<br />
3000<br />
2000<br />
1000<br />
0<br />
11 12 13 14 15 16 17 18 19 >20<br />
Source: Company data and <strong>Danske</strong> Markets<br />
EBIT by segment 2010<br />
Distribution<br />
16%<br />
Heat<br />
15%<br />
Source: Company data and <strong>Danske</strong> Markets<br />
Debt metrics<br />
EURm<br />
10,000<br />
9,000<br />
8,000<br />
7,000<br />
6,000<br />
5,000<br />
4,000<br />
3,000<br />
2,000<br />
1,000<br />
0<br />
2006 2007 2008 2009 2010<br />
Source: Company data and <strong>Danske</strong> Markets<br />
60%<br />
50%<br />
40%<br />
30%<br />
20%<br />
10%<br />
0%<br />
Net sales EBITDA EBITDA margin (rhs)<br />
Electricity<br />
Sales<br />
1%<br />
Russia<br />
0%<br />
2006 2007 2008 2009 2010<br />
Power<br />
68%<br />
X<br />
3.5<br />
3<br />
2.5<br />
2<br />
1.5<br />
1<br />
0.5<br />
0<br />
Net debt Equity Net debt/EBITDA (rhs)<br />
183 | 13 April 2011<br />
www.danskeresearch.com
<strong>Scandi</strong> Handbook<br />
geographical diversification is positive from a credit point of view, we caution that<br />
2009 demonstrated volatility in Russian power demand (down 5%) and in the rouble<br />
(down 4%). Another worrying issue right now is the Russian energy ministers talks<br />
about a potential power tariff revision in Russia to protect consumers bills from rising.<br />
That said the Russian market has great potential for long-term increasing power demand<br />
underlined by the Russian Ministry of Energy expecting electricity demand to<br />
increase by 50% in the coming 10 years. We believe Fortum’s Russian exposure should<br />
contribute to earnings volatility, given regulatory uncertainty, geopolitical risks, demand<br />
volatility and integration risk.<br />
Capex programme<br />
On the back of the continued positive developments in Russia and in particular due to<br />
the new generous capacity payments, Fortum has decided to accelerate its capex in<br />
respect of Russia. In total Fortum expects to spend EUR1.6-1.8bn annually in 2011<br />
and 2012. For 2013 and 2014 the number is EUR1.1-1.4bn. This compares poorly to<br />
Fortum’s long-term annual capex target of EUR0.8-1.2bn. On a further worrying<br />
note, Fortum indicates that it wishes to increase its footprint in Euro-Asian markets,<br />
seeking to deploy its “clean” technology into developing markets. We see this as<br />
credit-negative, as this would increase the volatility of Fortum’s assets due to rising<br />
geo-political risks.<br />
The Finnish government earlier this year gave a decision in principle that a third reactor<br />
at Fortum’s Loviisa nuclear site is not recommended. Instead TVO was permitted to<br />
build a fourth reactor at Olkiluoto, in which Fortum will hold a 26% stake. The government<br />
stresses that there were no business or operational reasons for Fortum being<br />
denied. The decision was solely based on a demand projection on Finnish power. Future<br />
rising demand would be served through the construction of two new reactors, one<br />
by TVO and one by Fennovoima. In that connection it is relevant to mention that, until<br />
now, the public reaction to the nuclear crisis in Fukushima hasn’t spurred any meaningful<br />
public demand for a contraction of nuclear capacity in either Sweden or Finland,<br />
where Fortum has nuclear capacity. It is difficult to imagine how Finland and Sweden<br />
should replace the vast amounts of power generated at its nuclear plants. As especially<br />
the Finnish plants are top-notch in terms of security and since the geological conditions<br />
in the Nordic region are far more stable than in Japan, we deem the risk of any material<br />
negative spill-over effects from the Japan crisis as remote. However, it is a political<br />
issue that could change if things turn increasingly “ugly” in Japan.<br />
Financial policy<br />
The hiked capex budget and continued benign shareholder focus makes us worry that<br />
Fortum’s leverage could deteriorate further in the short future. After Q4, Fortum’s<br />
adjusted FFO to net debt fell to 18.5%. S&P has recently stated that it expects this<br />
metric to be above 20% for the current ‘A’ rating. Fortum has, however, repeated its<br />
net debt to LTM EBITDA guidance of 3x, which is exactly what the metric was after<br />
Q4. Therefore a further releveraging would mark a temporary breach to Fortum’s<br />
own guidance.<br />
Recommendation<br />
In the long-term we see Fortum being well positioned to profit from our expectations<br />
of recovering Nordic and Russian demand, rising power prices and rising<br />
CO2 prices. In the short-term, however, we fear that a negative rating-reaction<br />
could be under way in connection with the group’s Russian capex budget. This,<br />
coupled with Fortum’s relatively tight pricing relative to peer’s bonds and heightened<br />
risk of primary market activity makes us repeat our SELL recommendation<br />
on the name. (See list of instrument prices at the end of this book.)<br />
Finnish reservoir capacity<br />
%<br />
88<br />
78<br />
68<br />
58<br />
48<br />
38<br />
28<br />
18<br />
Week<br />
1 5 9 13 17 21 25 29 33 37 41 45 49<br />
2008 2009 2010 Median 2011<br />
Note: % of total Finnish capacity. Source: Nordpool<br />
Nordpool power prices<br />
EUR/MWh<br />
100<br />
90<br />
80<br />
70<br />
60<br />
50<br />
40<br />
30<br />
20<br />
10<br />
0<br />
Jan Mar May Jun Aug Oct Dec<br />
2007 2008 2009 2010 2011<br />
Source: Nordpool<br />
184 | 13 April 2011<br />
www.danskeresearch.com
<strong>Scandi</strong> Handbook<br />
Financial data Fortum<br />
Key figures (EURm) 2006 2007 2008 2009 2010<br />
Net Sales 4,491 4,479 5,636 5,435 6,296<br />
EBITDA 1,884 2,298 2,478 2,292 2,271<br />
EBIT 1,455 1,847 1,963 1,782 1,708<br />
Net interest expenses 103 154 239 167 155<br />
Net profit 1,120 1,608 1,596 1,351 1,354<br />
FFO [1] 1,329 1,619 2,104 2,245 1,399<br />
Capex [2] 485 592 1,108 862 1,222<br />
FCF [3] 666 1,078 894 1,402 215<br />
RCF [4] 342 497 906 1,357 511<br />
Net Debt [5] 4,345 4,466 6,179 5,969 6,826<br />
Adjusted Net debt [6] 4,560 4,673 6,920 6,876 7,709<br />
Total Debt 4,502 4,893 7,500 6,859 7,382<br />
Equity 8,161 8,651 8,411 8,491 8,742<br />
Ratios<br />
EBITDA margin 42% 51% 44% 42% 36%<br />
Net debt / EBITDA 2.3x 1.9x 2.5x 2.6x 3.0x<br />
Adjusted net debt / EBITDA 246.5x 228.0x 2.9x 2.8x 3.2x<br />
Adjusted FFO interest coverage 7.0x 6.1x 6.3x 9.5x 7.2x<br />
Adjusted FFO/net debt 0.3x 0.3x 0.3x 0.3x 0.2x<br />
Adjusted net debt/total capital 36% 35% 45% 45% 47%<br />
(1) Cash flow from operating activities before changes in working capital. (2) Investments in tangible assets. (3) Cash flow from operating activities less capex. (4)<br />
Cash flow from operating activities less dividends but before changes in working capital. (5) Total interest-bearing debt less cash and marketable securities. (6) Net<br />
debt adjusted for contingent liabilities/contractual obligations, pension liabilities and debt in subsidiaries, which are not wholly owned and operating leases. Source:<br />
Company Data and <strong>Danske</strong> Fixed Income Credit Research<br />
Quarterly review (EURm)<br />
Q4 09 Q1 10 Q2 10 Q3 10 Q4 10<br />
Net sales 1,563 1,947 1,295 1,152 1,902<br />
EBITDA 658 861 490 452 468<br />
EBITDA margin (%) 0% 0% 0% 0% 0%<br />
Net income 431 583 271 240 260<br />
Net debt 5,969 5,679 6,506 6,608 6,826<br />
Net debt/LTM EBITDA 2.6x 2.3x 2.7x 2.7x 3.0x<br />
Source: Company data and <strong>Danske</strong> Markets<br />
Divisional quarterly overview (EURm)<br />
Q4 09 Q1 10 Q2 10 Q3 10 Q4 10<br />
Power Generation Net sales 663 769 597 584 752<br />
EBIT 327 467 280 256 129<br />
EBIT-margin 49% 61% 47% 44% 17%<br />
Heat Net sales 458 651 301 220 598<br />
EBIT 109 159 35 -15 124<br />
EBIT-margin 24% 24% 12% -7% 21%<br />
Distribution Net sales 227 280 200 196 287<br />
EBIT 81 113 53 62 93<br />
EBIT-margin 36% 40% 27% 32% 32%<br />
Electricity Sales Net sales 410 637 327 305 529<br />
EBIT 37 -29 23 12 40<br />
EBIT-margin 9% -5% 7% 4% 8%<br />
Russia Net sales 197 244 169 137 254<br />
EBIT 8 32 -9 14 16<br />
EBIT-margin 4% 13% -5% 10% 6%<br />
Source: Company data and <strong>Danske</strong> Markets<br />
185 | 13 April 2011<br />
www.danskeresearch.com
<strong>Scandi</strong> Handbook<br />
Neste Oil<br />
Company overview<br />
Based in Espoo, Neste Oil is Finland’s largest oil refiner employing some 5,030<br />
people around the globe. The Group has access to refinery plants with relatively high<br />
complexity, enabling it to process relatively more sour and heavier crude oil types<br />
with higher inherent margins compared to average oil grades. Neste Oil produces a<br />
wide array of oil-based products counting gasoline, diesel, aviation and heating fuels,<br />
base oils and bunker fuels. With some 25 vessels, Neste Oil has access to product and<br />
crude-tanker capacity, making the Group positively exposed to tanker rates. On top<br />
of traditional refining, Neste Oil also produces renewable diesel fuels based on vegetable<br />
oils and animal-waste fat. Finally Neste Oil is active in gasoline, diesel, fuel<br />
and heating oil retailing, covering the whole of Finland, North-West Russia, the<br />
Baltics and Poland with its 1,169 service stations. With the exception of crude oil<br />
procurement, Neste Oil is hence exposed to the whole liquids value chain. Neste Oil<br />
is 50.1% owned by the Finnish government, the rest of the shares are in free float.<br />
Neste Oil does not have a rating with either of the major rating agencies, but we see<br />
an indicative rating for the Group at ‘BBB-‘.<br />
Key credit considerations<br />
Above-average complexity<br />
Neste Oil’s main refineries are situated in Porvoo and Naantali in Southern Finland.<br />
The distillation capacity of the two refineries is 205mbpd and 56mbpd respectively.<br />
This ranks Neste Oil as a relatively small player in a global context. What Neste lacks<br />
in size, it makes up for in complexity. The Nelson complexity index for Porvoo and<br />
Naantali is 12.1 and 7.1 respectively. In short, the Nelson complexity index reflects the<br />
oil quality requirements as input into the refinery. The higher the index, the more heavy<br />
and sour oils can be refined. Normally these oil types are cheaper to buy, reducing the<br />
variable input cost for a refiner. Furthermore, a high complexity index indicates a high<br />
value of the final output. Therefore, a higher Nelson complexity index, all things being<br />
equal, points to higher refinery margins, but also often to higher fixed costs, as complex<br />
refinery equipment is more expensive to build than low-complex. The average Nelson<br />
complexity index for European refiners lies in the 6.5 area, rendering Neste Oil a high<br />
complex refiner relative to peers. Some 54% of Neste Oil’s output is high margin middle<br />
distillates (heating oil, diesel and jet-fuels) which compares well with a European<br />
average of 43%. In Q4 10 Neste Oil’s achieved margin on its middle-distillates was<br />
USD16/bbl compared to Neste’s total refining margin of USD9.67/bbl. In general all<br />
refining margins tend to be positively correlated to the oil price.<br />
High cost focus and flexibility in procurement and delivery<br />
In addition to the margin-enhancing features offered by the complexity of the Group’s<br />
refineries, Neste Oil also has a very competitive cost structure. In 2010 Neste Oil continued<br />
its high focus on cost reductions and efficiency. In this connection a vast maintenance<br />
program was undertaken for its largest refinery in Porvoo.<br />
In<br />
addition to complex refinery assets and a competitive cost structure, Neste Oil has<br />
access to storage capacity of refined products in rock caverns and tank farms totalling<br />
some 9.7mCbm. This allows the Group to delay sales of refined products if it believes<br />
the price will rise in the future. Finally Neste Oil has its own tanker fleet, allowing the<br />
Group to capture international price differences in both crude oil and refined products.<br />
In 2010 roughly 69% of Neste Oil’s input crude was Russian Export Blend which is<br />
generally more sour, but also less expensive than ordinary North Sea Brent. As the<br />
Brent price normally dictates the refinery spreads (vital input for Neste Oil’s operating<br />
profit), the spread between Urals and Brent is a key spread to monitor for Neste Oil, as<br />
a cheaper Urals price relative to Brent will feed straight into the refinery spreads.<br />
HOLD<br />
Sector: Energy, Oil & Gas Refining &<br />
Marketing<br />
Corporate ticker: NESVFH<br />
Equity ticker: NES1V FH<br />
Market cap: EUR3.7bn<br />
Ratings:<br />
S&P rating: NR<br />
Moodys rating: NR<br />
Fitch rating: NR<br />
Analyst:<br />
Jakob Magnussen, CFA<br />
Jakob.magnussen@danskebank.dk<br />
+45 45 128503<br />
Louis Landeman<br />
louis.landeman@danskebank.com<br />
+46 8 568 80524<br />
Key credit issues<br />
Strengths:<br />
• Complex refinery assets<br />
• Diversified over almost the whole<br />
liquids value chain<br />
• Conservative shareholder policy<br />
• Government owned<br />
Challenges:<br />
• Exposed to volatile refining margins<br />
• Relative small refiner<br />
• Below average credit metrics<br />
• We see Neste as having an Indicative<br />
rating borderline investment<br />
grade<br />
Source: <strong>Danske</strong> Markets<br />
186 | 13 April 2011<br />
www.danskeresearch.com
<strong>Scandi</strong> Handbook<br />
Liquidity<br />
According to Neste Oil’s Q4 report, the Group had a solid position of cash & equivalents<br />
of EUR380m. In 2010 Neste Oil secured some EUR1.1bn in cash flow from<br />
operations, which is a figure Neste Oil is likely to repeat in 2011. Over the coming<br />
years these sources of cash will be offset by some EUR299m in short-term debt<br />
maturities and capex outlays of EUR300m. Management has also decided to pay out<br />
EUR90m in dividend for the accounting year 2010. Based on these numbers, Neste<br />
Oil clearly has no liquidity problems in the coming 12 months. When combining this<br />
with some EUR1.4bn in committed credit facilities, Neste Oil can only be described<br />
as a company with a very robust liquidity profile. As shareholder friendliness has<br />
made its way onto many Nordic corporate agendas, we highlight that Neste Oil’s<br />
management has no mandate from the board to undertake share buybacks. In general<br />
Neste Oil aims to pay out at least 33% of net earnings each year. The payout ratio for<br />
2010 will be 39%, a level we think is conservative compared to Nordic industrial<br />
peers.<br />
Current performance drivers<br />
2010 result exceeded expectations<br />
Generally 2010 was a strong year for Neste Oil. Revenue rose 23% y/y to<br />
EUR11.9bn as a direct consequence of a higher average oil price and in spite of<br />
lower production y/y due to a large maintenance outage at the Porvoo refinery. Clean<br />
EBIT ballooned to EUR240m up 107% y/y as a result of higher refinery margins and<br />
lower y/y fixed costs. Some of the key reasons for the margin improvements were the<br />
cold weather, strong refined products demand growth from emerging markets and a<br />
normalisation of the refinery overcapacity situation in 2009. Both the oil products<br />
and oil retail divisions performed strongly in 2010 with clean EBIT growth of 98%<br />
and 20% y/y respectively. Neste Oil’s expected future growth area ‘Renewable Fuels’<br />
has yet to show performance with a negative clean EBIT of EUR65m in 2010.<br />
Neste Oil delivered a solid positive FoCF of EUR173m (-EUR639m in 2009), primarily<br />
driven by a significant release of working capital during the year. As a consequence<br />
of the strong cash flow, Neste Oil reduced its net debt position by EUR117m<br />
to EUR1.8bn.<br />
2011 Outlook<br />
Despite the strong result, the shares fell after the release of the 2010 report as the<br />
2011 outlook was a bit mixed. Neste Oil guided for continued losses in the renewable<br />
segment also in 2011. As this is meant to be the primary driver of growth for the<br />
Group, this disappointed the equity market. From a credit perspective, where the<br />
upside from earnings growth is limited, we see little impact from a delay of profitability<br />
in the renewable segment. On a positive note, Neste Oil guides for a continuation<br />
of growth in both refining margins and demand in 2011. Especially diesel demand<br />
growth is expected to be strong, which bodes well for 2011 cash flow.<br />
For 2011 Neste Oil guides for capex in the EUR300m area, which is clearly lower<br />
than the average of EUR745m in the last three years. The drop is primarily due to<br />
Neste Oil having completed the bulk of capex directed at its two renewable diesel<br />
refineries in Singapore and Rotterdam in the preceding two years.<br />
Group targets<br />
Neste Oil targets a leverage ratio of 25-50%. After Q4 10 this stood at 42.6%. Neste<br />
Oil has been above this throughout the past five quarters, but has lived up to the<br />
target in preceding years. Neste Oil targets a payout ratio equivalent to a third of<br />
underlying profits. In 2010 the payout ratio was 39% on headline numbers, but in the<br />
55% area on comparable net profit numbers. In the past six years Neste Oil has always<br />
paid out significantly more than 33%. From a credit perspective this is rather<br />
disappointing although the level is not high compared to other Nordic industrials.<br />
Debt maturity profile as of end 2010<br />
EURm<br />
700<br />
600<br />
500<br />
400<br />
300<br />
200<br />
100<br />
0<br />
Source: Company data and <strong>Danske</strong> Markets<br />
Profitability<br />
EURm<br />
16000<br />
14000<br />
12000<br />
10000<br />
8000<br />
6000<br />
4000<br />
2000<br />
0<br />
2011 2012 2013 2014 2015 2016 2017+<br />
Source: Company data and <strong>Danske</strong> Markets<br />
Clean EBIT by segments 2010<br />
Renewable<br />
fuels<br />
0%<br />
Source: Company data and <strong>Danske</strong> Markets<br />
Debt metrics 2010<br />
Source: Company data and <strong>Danske</strong> Markets<br />
9%<br />
8%<br />
7%<br />
6%<br />
5%<br />
4%<br />
3%<br />
2%<br />
1%<br />
0%<br />
2006 2007 2008 2009 2010<br />
Net sales EBITDA EBITDA margin (rhs)<br />
Oil Retail<br />
14%<br />
EURm<br />
3,000<br />
2,500<br />
2,000<br />
1,500<br />
1,000<br />
500<br />
0<br />
2006 2007 2008 2009 2010<br />
Oil<br />
Products<br />
86%<br />
X<br />
4<br />
3.5<br />
3<br />
2.5<br />
2<br />
1.5<br />
1<br />
0.5<br />
0<br />
Net debt Equity Net debt/EBITDA (rhs)<br />
187 | 13 April 2011<br />
www.danskeresearch.com
<strong>Scandi</strong> Handbook<br />
Credit metrics improving for Neste Oil<br />
Following the strong annual report, the Group demonstrated improving credit metrics<br />
y/y. Headline net debt to EBITDA improved to 3.1x from 3.4x in 2009. We see adjusted<br />
net debt to EBITDA at 3.6x down from 5x in 2009. Group RCF to adjusted net<br />
debt was 29.5% in 2010 up 8.5%-points during the year. As cash flow generation is<br />
set to improve due to significantly lower capex in 2011, we are confident that Neste<br />
Oil will continue to deliver improvement in credit metrics.<br />
Another important metric to gauge when it comes to refiners is debt to complexity<br />
barrels. Basically this measures Neste Oil’s debt per unit of capacity when adjusting<br />
for the refiner’s complexity. On this measure Neste Oil scored ‘778’ in 2010, which<br />
in Moody’s methodology maps into a ‘B’ rating. To achieve investment grade on this<br />
metric in isolation, Neste Oil needs to improve to ‘475’. Compared to a long-term<br />
average, the last two years of average adjusted net debt to EBITDA of 4.3x mark a<br />
departure from a longer-term trend where this metric hovered in the 1.4x-area (05-<br />
08).<br />
Implied rating<br />
We believe that a strong leverage level is essential for a Group like Neste Oil because<br />
of the inherent high operational leverage and high exposure to volatile refinery margins<br />
and oil prices. This is partly offset by Neste Oil’s fair share of earnings coming<br />
from retailing and its strong vertical integration in the fluids value chain combined<br />
with top-notch equipment. Overall we view Neste Oil’s business risk profile as<br />
somewhere between ‘Fair’ and ‘Weak’. Currently we see the Group’s financial risk<br />
profile as ‘Intermediate’ but expect this to improve in the coming year. Combining<br />
these views, we estimate that Neste Oil qualifies as a ‘BB+’ rated issuer on a standalone<br />
basis. As Neste Oil is 50.1% owned by the government of Finland we see a moderate<br />
likelihood that Finland will provide some sort of support in case of financial distress.<br />
Due to this, we assign one additional notch, and arrive at a ‘BBB-‘ long-term<br />
rating at the senior unsecured level. In assigning our indicative rating to Neste Oil, we<br />
also take into consideration that only EUR2m out of EUR6.7bn of Group’s high<br />
quality assets are pledged, providing a relatively strong recovery rating profile for<br />
Neste Oil.<br />
Renewable division dependent on political regulation<br />
The profit of the renewable division, which is flagged as the key growth area for<br />
Neste Oil, is very dependent on politicians providing incentives to consumers to<br />
choose renewable fuels such as Neste Oil’s NExBTL renewable diesel over regular<br />
diesel. In an effort to reduce oil dependence and CO2 emissions, various governments<br />
require that a certain portion of diesel contains renewable diesel. In other<br />
instances politicians are providing, or are contemplating, subsidies for renewable<br />
fuels. Failure by politicians to agree on subsidy schemes or renewable requirements<br />
will impair Neste Oil’s growth ambitions in the renewable fuels sector. This will also<br />
lead to large impairments on Neste Oil’s renewable plants into which the Group is<br />
currently deploying most of its capex. Neste Oil has just recently commissioned a<br />
huge renewable plant in Singapore with production capacity of some 800kt of<br />
NExBTL. A similar sized plant is expected to come on stream in the summer of<br />
2011. The combined capital invested into these two plants is just shy of EUR1.22bn.<br />
Recommendation<br />
We see Neste Oil as an intermediate issuer in terms of credit quality, where lack of size<br />
and inherent earnings volatility is offset by a relatively high margined business with<br />
improving credit metrics and partial government ownership. Neste oil only has three<br />
EUR issues outstanding all below benchmark size, making the issues rather illiquid.<br />
Seeing the Group as a ‘BBB-‘ issuer and factoring in a liquidity premium, we think<br />
Neste Oil’s secondary bonds trade at fair levels compared to other ‘BBB-‘ issuers. We<br />
initiate coverage with a HOLD recommendation. (See list of instrument prices at the<br />
end of this book).<br />
Neste Oil refinery margin<br />
USD/bbl<br />
40<br />
30<br />
20<br />
10<br />
0<br />
-10<br />
-20<br />
-30<br />
-40<br />
Q1<br />
08<br />
Q2<br />
08<br />
Q3<br />
08<br />
Q4<br />
08<br />
Source: Company data and <strong>Danske</strong> Markets<br />
Urals Brent difference<br />
USD/bbl<br />
160<br />
140<br />
120<br />
100<br />
80<br />
60<br />
40<br />
20<br />
0<br />
Jan-08<br />
Apr-08<br />
Source: Bloomberg<br />
NWE Diesel margin<br />
Neste Oil total refining margin<br />
Jul-08<br />
NWE heavy fuel oil margin<br />
Oct-08<br />
Q1<br />
09<br />
Q2<br />
09<br />
NWE Gasolinemargin<br />
Q3<br />
09<br />
Q4<br />
09<br />
Q1<br />
10<br />
Urals -Brent difference >><br />
Jan-09<br />
<strong>Scandi</strong> Handbook<br />
Financial data Neste Oil<br />
Key figures (EURm) 2006 2007 2008 2009 2010<br />
Net Sales 12,734 12,103 15,043 9,636 11,892<br />
EBITDA 1,007 996 409 569 582<br />
EBIT 854 801 186 335 323<br />
Clean EBIT 597 626 602 116 240<br />
Net profit 636 580 101 225 231<br />
FFO [1] 618 730 264 627 619<br />
Capex [2] 521 321 487 816 932<br />
FCF [3] -9 220 25 -639 173<br />
RCF [4] 413 499 8 422 553<br />
Net Debt [5] 721 755 1,004 1,918 1,801<br />
Adjusted Net debt [6] 1,253 1,024 1,699 2,216 2,082<br />
Total Debt 783 807 1,059 2,035 2,181<br />
Equity 2,097 2,427 2,179 2,222 2,426<br />
Ratios<br />
EBITDA margin 7.9% 8.2% 2.7% 5.9% 4.9%<br />
Adjusted net debt / EBITDA 1.5x 1.1x 1.8x 5.0x 3.6x<br />
Adjusted FFO interest coverage [7] 14.5x 10.5x 3.2x 9.3x 11.2x<br />
Adjusted FFO/net debt 54.4% 78.6% 19.7% 31.1% 32.3%<br />
Adjusted RCF/debt 38.0% 56.0% 4.7% 21.9% 29.1%<br />
Adjusted debt/total capital 37.4% 29.7% 43.8% 49.9% 46.2%<br />
(1) Cash flow from operating activities before changes in working capital. (2) Investments in tangible assets. (3) Cash flow from operating activities less capex. (4) Cash<br />
flow from operating activities less dividends but before changes in working capital. (5) Total interest-bearing debt less cash and marketable securities. (6) Net debt<br />
adjusted for contingent liabilities/contractual obligations, pension liabilities and debt in subsidiaries, which are not wholly-owned and operating leases. Source: Company<br />
data, <strong>Danske</strong> Fixed Income Credit Research<br />
Quarterly review (EURm)<br />
Q4 09 Q1 10 Q2 10 Q3 10 Q4 10<br />
Net sales 2491 2725 2576 3,065 3,526<br />
EBITDA 74 155 -1 207 221<br />
EBITDA margin 3.0% 5.7% 0.0% 6.8% 6.3%<br />
Net income 1 64 -50 110 107<br />
Net debt 1,918 1,753 1,926 2,117 1,801<br />
Net debt/LTM EBITDA 3.4x 3.1x 4.8x 4.9x 3.1x<br />
Source: Company data, <strong>Danske</strong> Fixed Income Credit Research<br />
Divisional quarterly overview (EURm)<br />
PRIMARY SEGMENTS Q4 09 Q1 10 Q2 10 Q3 10 Q4 10<br />
Oil Products Net sales 1,987 2,272 2,064 2,491 2,962<br />
EBIT -11 58 -3 45 108<br />
EBIT margin -1% 3% 0% 2% 4%<br />
Renewable Fuels Net sales 61 36 60 120 112<br />
EBIT -10 -18 -23 -12 -13<br />
EBIT margin -16% -50% -38% -10% -12%<br />
Oil Retail Net sales 791 849 884 917 1,004<br />
EBIT 5 6 13 23 18<br />
EBIT margin 1% 1% 1% 3% 2%<br />
Source: Company data, <strong>Danske</strong> Markets .<br />
189 | 13 April 2011<br />
www.danskeresearch.com
<strong>Scandi</strong> Handbook<br />
Statkraft<br />
Company overview<br />
Statkraft is Norway’s largest electric utility, being responsible for some 36% of the<br />
country’s total generation. With annual power production of 57.4TWh in 2010,<br />
Statkraft is the third-largest utility company in the Nordic region, following Fortum<br />
and Vattenfall. Through its large base of owned and partially owned hydrogeneration<br />
plants and various renewable assets, roughly 88% of its generation portfolio<br />
is comprised of non-CO2-emitting renewable assets, making it the cleanest generator<br />
in Europe in terms of emissions. The bulk of the company’s hydro-generation<br />
facilities are located in Norway, Sweden and Finland. Statkraft also holds peak-load<br />
capacity in the form of stakes in gas-fired plants in Germany and Norway. As the<br />
vast majority of Statkraft’s production comes from low variable-cost hydro plants,<br />
the group’s capacity is very dependent on the level of precipitation in <strong>Scandi</strong>navia.<br />
Production of electricity and trading with the wholesale market and major industrial<br />
customers are the largest contributors to Statkraft’s revenues and operating income,<br />
although moderate downstream integration through distribution and retail sales provides<br />
some diversification to cash flow. Statkraft also has a smaller emerging-market<br />
footprint through its 60%-owned SN Power. In 2010, SN Power’s installed capacity<br />
was 1GW. Statkraft has 181,000 grid customers across its consolidated companies<br />
and is 100%-owned by the ‘AAA’ rated Norwegian state. The government ownership<br />
is reflected in the ratings by both S&P and Moody’s, which give two-notch uplifts in<br />
their stand-alone ratings due to the assumed support in the event of financial hardship,<br />
arriving at a rating of Baa1/A-.<br />
Key credit considerations<br />
Precipitation risk partly mitigated by large reservoir capacity<br />
Statkraft is vastly exposed to hydro production, holding more than 40% of the total<br />
reservoir capacity in Norway. Should precipitation be low, Statkraft can draw on reservoir<br />
levels to produce power. Currently, levels are very low compared with the average,<br />
which is a contributing factor behind the high Nordic power prices seen in the past few<br />
months. In general, although reservoir level volatility affects Statkraft’s earnings, this is<br />
mitigated to some extent by the negative correlation between reservoir levels and power<br />
prices, yielding a partial natural hedge. We also note that Statkraft uses power hedges<br />
to reduce the short-term impact on volatile power prices.<br />
Relatively low share of regulated earnings<br />
Parts of Statkraft’s earnings come from regulated distribution assets. We estimate<br />
that roughly 7% of Statkraft’s 2010 EBITDA was derived from regulated grid and<br />
heating activities. From a credit point of view, we would prefer more regulated income<br />
to less, given its predictability in terms of earnings. We see 7% as being at the<br />
lower end relative to Statkraft’s Nordic peers. Statkraft is further increasing its windgeneration<br />
capacity. In the sense that these earnings are guaranteed by feed-in tariffs<br />
imposed by public regulators, they could also be regarded as low-volatility regulated<br />
income.<br />
Strong position in Norway 100% government-owned<br />
As Norway’s largest power producer and owner of vital strategic assets, Statkraft is<br />
of considerable importance to the Kingdom of Norway. Governed by the Ministry of<br />
Trade and Industry, Norway has a 100% ownership stake in Statkraft. We do not<br />
expect the government to reduce its stake below majority going forward. The opposition<br />
party in Norway continually advocates a reduction in several state ownerships.<br />
We take comfort in the fact that Statkraft is not one of the companies mentioned and<br />
maintain that the Norwegian government considers Statkraft’s generation and infrastructure<br />
assets as key strategic holdings.<br />
BUY<br />
Sector: Utility, Electric Utilities<br />
Corporate ticker: STATK<br />
Equity ticker: 1256Z NO<br />
Market cap: not listed<br />
Ratings:<br />
S&P rating: A- / S<br />
Moodys rating: Baa1 / S<br />
Fitch rating: BBB+ / S<br />
Analyst:<br />
Jakob Magnussen, CFA<br />
Jakob.magnussen@danskebank.dk<br />
+45 45 128503<br />
Louis Landeman<br />
louis.landeman@danskebank.com<br />
+46 8 568 80524<br />
Key credit issues<br />
Strengths:<br />
• Market leader in Norway and topthree<br />
Nordic player.<br />
• Low-variable cost power producer.<br />
• Low CO2 emission produced<br />
MWh.<br />
• Vital strategic asset for the AAA<br />
rated Norwegian government.<br />
• Proven support from owner<br />
through equity injection.<br />
Challenges:<br />
• Volatile generation capacity, which<br />
is weather dependent.<br />
• High capex budget and high dividend<br />
requirements.<br />
• Poor diversification on generation<br />
portfolio.<br />
• Exposed to below-cost power delivery<br />
contracts.<br />
Source: <strong>Danske</strong> Markets<br />
190 | 13 April 2011<br />
www.danskeresearch.com
<strong>Scandi</strong> Handbook<br />
Liquidity<br />
Following the Norwegian government’s decision to inject some NOK14bn into<br />
Statkraft, we can only characterize the group’s short-term liquidity profile as solid.<br />
Statkraft has some NOK20bn in cash and cash equivalents and generated some<br />
NOK13.6bn in cash flow from operations in 2010, which we expect could be indicative<br />
of the level in 2011. In the same period Statkraft will face some NOK6.2bn in<br />
short-term debt maturities. Following the government’s decision to inject cash into<br />
Statkraft, the group raised its capex budget, which could indicate a level of<br />
NOK15bn in 2011 (based on a targeted budget of NOK70-80bn over the coming five<br />
years). 45% of 2011 capex is committed. The government has proposed a NOK5.2bn<br />
dividend to be paid in 2011. Summing up these items, Statkraft looks adequately<br />
funded in 2011.<br />
Statkraft has a policy of maintaining a liquidity reserve adequate to always meet the<br />
coming six-month maturities. Statkraft’s asset swap with E.ON has given the group a<br />
4.17% share in E.ON AG’s equity. At current market prices this is worth<br />
NOK14.6bn. As E.ON AG shares are very liquid, we believe it is prudent to also<br />
consider these when accessing Statkraft’s liquidity profile.<br />
Statkraft signed a NOK12bn drawing facility in January 2011, which replaced the<br />
existing NOK8bn facilities. After this, Statkraft has access to some NOK13bn in committed<br />
facilities.<br />
Current performance drivers<br />
Strong Q4 10 result boosted by higher production & prices<br />
Statkraft delivered very sound Q4 top-line growth of 10% y/y, primarily driven by<br />
Nordpool power prices, which were up some 69% y/y. The rising prices were primarily<br />
the result of lower Nordic capacity as hydro and nuclear capacity were below<br />
normal. This was further supported by higher demand due to below-average temperatures<br />
and stronger demand from energy-intensive industrials. In Germany, where<br />
Statkraft secured just below 8% of its total revenues in 2010, power prices were up<br />
33% y/y. The higher group revenue was also explained by a slight uptake in hydro<br />
generation by some 400GWh y/y. We find this rather impressive given the belowaverage<br />
precipitation in Norway causing reservoir levels to be lower than normal.<br />
Going forward Statkraft guides below-average generation due to the low capacity at<br />
its dams. Group EBITDA improved 36% y/y. Excluding hedging and P&L adjustments<br />
due to value revisions on the balance sheet, group adjusted and comparable<br />
EBITDA rose 20% y/y, taking the underlying margin to 60.8%, up 5.4pp y/y. The<br />
higher margin is a direct reflection of Statkraft’s high share of fixed costs in its total<br />
cost base, causing the group to reap the full margin benefits from rising sales.<br />
Statkraft’s net income was down 61% y/y, but this was due to a non-cash impairment<br />
on the group’s 4.17% stake in E.ON AG due to the fall in E.ON’s share price. The<br />
impairment charge was NOK3.6bn. Adjusting for the E.ON impairment, Statkraft’s<br />
Q4 net income actually rose 142% y/y.<br />
Credit metrics improved due to equity injection and strong FOCF<br />
Statkraft continued its very solid credit trend of delivering strong quarterly FOCF<br />
numbers. In Q4 FOCF was NOK1.6bn, up 46% y/y. Combined with the Norwegian<br />
government’s equity injection of some NOK14bn into Statkraft, the group’s net debt<br />
situation improved substantially. At end-Q4 group net debt was NOK20.4bn, down<br />
NOK16.9bn during the quarter. On adjusted numbers we subsequently see Statkraft’s<br />
net debt to LTM EBITDA at 1.5x (2.8x after Q3 10). Adjusted FFO to net debt rose<br />
sharply to 58.7% (37.1%). LTM adjusted FFO interest coverage rose to 9.6x (9x after<br />
Q3 09).<br />
Maturity profile as of end 2010<br />
NOKbn<br />
7,000<br />
6,000<br />
5,000<br />
4,000<br />
3,000<br />
2,000<br />
1,000<br />
0<br />
Source: Company data and <strong>Danske</strong> Markets<br />
Profitability<br />
NOK<br />
35,000<br />
30,000<br />
25,000<br />
20,000<br />
15,000<br />
10,000<br />
5,000<br />
0<br />
11 12 13 14 15 16 17 18 19 20 20+<br />
Source: Company data and <strong>Danske</strong> Markets<br />
Divisional EBITDA split 2010<br />
Emerging<br />
markets<br />
1%<br />
Wind power<br />
0%<br />
Source: Company data and <strong>Danske</strong> Markets<br />
Debt metrics<br />
NOKm<br />
80,000<br />
70,000<br />
60,000<br />
50,000<br />
40,000<br />
30,000<br />
20,000<br />
10,000<br />
0<br />
2006 2007 2008 2009 2010<br />
Source: Company data and <strong>Danske</strong> Markets<br />
90%<br />
80%<br />
70%<br />
60%<br />
50%<br />
40%<br />
30%<br />
20%<br />
10%<br />
0%<br />
Net sales EBITDA EBITDA-margin (rhs)<br />
Skagerak<br />
Energi<br />
13%<br />
Customers<br />
2% Industrial<br />
ownership<br />
0%<br />
Generation<br />
& Markets<br />
84%<br />
2006 2007 2008 2009 2010<br />
Net debt Equity Net debt/EBITDA (rhs)<br />
4.0x<br />
3.5x<br />
3.0x<br />
2.5x<br />
2.0x<br />
1.5x<br />
1.0x<br />
0.5x<br />
0.0x<br />
191 | 13 April 2011<br />
www.danskeresearch.com
<strong>Scandi</strong> Handbook<br />
Outlook<br />
Statkraft sees 2011 generation at lower levels than 2010 due to the current very low<br />
hydrological situation in the Norwegian reservoirs. The group expects this to be<br />
partly offset by relatively higher power prices. We expect Statkraft to present lower<br />
FOCF going forward, as the group intends to increase its capex spending.<br />
Norway demonstrates valuable support willingness<br />
Norway’s decision to inject new equity is very credit positive in our view. To recap,<br />
Statkraft earlier this year announced its decision to reduce its capex budget from the<br />
previously targeted NOK90bn in the period 2009-2015 as a consequence of the government’s<br />
reluctance to give clarity on its decision regarding equity injections into<br />
Statkraft. After the government decided to inject NOK14bn into Statkraft, the capex<br />
budget was hiked again to NOK70-80bn in the period 2011-2015. Some 45% of the<br />
budget is committed, while credit quality preservation will be considered before<br />
using the remainder. The NOK14bn will be paid as equity capital to Statkraft SF,<br />
which in turn will increase its share capital in Statkraft AS (the issuer of the outstanding<br />
EUR bonds). Statkraft states that this "extra" capital will be devoted to<br />
"strengthen its efforts both in and outside Norway". Statkraft’s chairman said in a<br />
press conference that roughly 25% of Statkraft’s capital is to be invested in Norway.<br />
We think that the benefits from increased international diversification outweigh the<br />
increased inherent geo-political risks from emerging-market exposure.<br />
The government’s decision underscores the Norwegian state’s willingness to support<br />
Statkraft, a theme that is currently very valuable as Norway is one of the European<br />
sovereigns that is also able to support its incumbent utilities in the short to medium<br />
term. This is less obvious for many of its colleagues in peripheral nations.<br />
S&Ps removed its negative outlook<br />
Following the decision from the Norwegian government to inject capital into<br />
Statkraft, S&P’s removed the negative outlook on Statkraft’s A- rating. The capital<br />
injection underscores the Norwegian state’s commitment towards maintaining the<br />
quality of Statkraft. S&P highlights that the subsequently announced capex budget of<br />
NOK70-80bn is likely to be in line with the current assumptions behind its A- rating.<br />
Statkraft has a stated target policy of maintaining its current ratings from both<br />
Moody’s and S&P’s.<br />
Recommendation<br />
Fundamentally, we like the operating profile of Statkraft and its relatively low-cyclical<br />
business with its large share of hydro assets being attractive given our expectations of<br />
higher fossil and CO2 allowance prices. The currently strong operating profile combined<br />
with management’s rating commitments and the Norwegian government’s equity<br />
support makes Statkraft a solid credit story, in our view. We caution that the low reservoir<br />
capacity could give rise to some earnings setback in the quarters to come. Although<br />
cash generation is likely to fall in the coming quarters as capex picks up, we still<br />
see Statkraft’s metrics as solidly anchored in its current ratings. We see a risk of opportunistic<br />
issuance pressure in 2011 but underscore that the group’s liquidity is currently<br />
strong. Despite good performance we continue to think that selected Statkraft issues<br />
offer attractive spread levels. We consider the Statkraft 15’s and 19’s as attractive while<br />
the 17’s are beginning to look fairly priced. Overall we maintain our BUY recommendation<br />
on Statkraft (see list of instrument prices at the end of this book).<br />
Nordpool power prices<br />
EUR/MWh<br />
100<br />
90<br />
80<br />
70<br />
60<br />
50<br />
40<br />
30<br />
20<br />
10<br />
0<br />
Source: Nordpool<br />
Norwegian reservoir capacity<br />
%<br />
100<br />
90<br />
80<br />
70<br />
60<br />
50<br />
40<br />
30<br />
20<br />
Jan Mar May Jun Aug Oct Dec<br />
2007 2008 2009 2010 2011<br />
1 5 9 13 17 21 25 29 33 37 41 45 49<br />
2008 2009 2010<br />
2011 Median<br />
Note: % of maximum capacity. Source: Nordpool<br />
Week<br />
192 | 13 April 2011<br />
www.danskeresearch.com
<strong>Scandi</strong> Handbook<br />
Financial data Statkraft<br />
Key figures (NOKm) 2006 2007 2008 2009 2010<br />
Net Sales 16,200 17,619 25,061 25,675 29,252<br />
CLEAN EBITDA 13,335 9,620 13,888 12,582 15,030<br />
EBIT 9,918 7,242 16,618 7,027 12,750<br />
Net interest expenses 928 1,317 -23,369 1,696 -453<br />
Net profit 7,735 6,632 33,262 7,716 7,451<br />
FFO [1] 8,550 7,412 12,459 8,864 14,453<br />
Capex [2] 3,648 2,014 1,992 3,755 2,852<br />
FCF [3] 2,896 5,706 9,507 8,959 10,725<br />
RCF [4] 3,560 -483 4,063 -1,396 6,489<br />
Net Debt [5] 28,871 34,134 38,582 38,997 20,434<br />
Adjusted Net debt [6] 33,139 38,379 43,867 48,592 43,694<br />
Total Debt 32,021 37,284 40,791 45,660 40,486<br />
Equity 44,565 44,418 72,324 64,901 75,302<br />
Ratios<br />
Clean EBITDA margin 82.3% 54.6% 55.4% 49.0% 51.4%<br />
Net debt / clean EBITDA 2.2x 3.5x 2.8x 3.1x 1.4x<br />
Adjusted net debt / clean EBITDA 2.2x 3.7x 3.0x 3.3x 1.6x<br />
Adjusted FFO interest coverage [7] 7.6x 5.0x 5.9x 5.1x 10.0x<br />
Adjusted FFO/net debt 29% 21% 30% 21% 61%<br />
Adjusted RCF/debt 14% -1% 9% -1% 15%<br />
Adjusted debt/total capital 43% 46% 38% 43% 37%<br />
(1) CFO before change in working capital (including dividend from associates). (2) CFO less capex. (3) OpFCF less net interest paid (assuming that this number is<br />
included in Repayment of long-term liabilities and sub. loans), tax paid, and dividends. (4) Total interest-bearing debt less cash and marketable securities. (5) Net debt<br />
adjusted for guarantees. Source: Company data and <strong>Danske</strong> Fixed Income Credit Research<br />
Quarterly review (NOKm)<br />
Q4 09 Q1 10 Q2 10 Q3 10 Q4 10<br />
Net sales 8,157 10,507 5,443 4,364 8,939<br />
EBITDA 3,840 5,344 2,801 2,000 5,232<br />
EBITDA margin (%) 47.1% 50.9% 51.5% 45.8% 58.5%<br />
Net income 1,777 4,532 1,064 1,163 692<br />
Net debt 38,997 33,333 31,289 37,352 20,434<br />
Net debt/LTM EBITDA (x) 4.0x 3.0x 2.5x 2.7x 1.3x<br />
Source: Company data and <strong>Danske</strong> Fixed Income Credit Research<br />
Divisional quarterly overview (NOKm)<br />
PRIMARY SEGMENTS Q4 09 Q1 10 Q2 10 Q3 10 Q4 10<br />
Generation & Markets Net sales 6,140 7,557 3,285 3,546 7,213<br />
EBIT 2,781 5,344 1,532 1,600 3,774<br />
Wind power Net sales 115 76 57 48 109<br />
EBIT 10 5 -40 -83 -155<br />
Emerging markets Net sales 178 181 163 171 192<br />
EBIT 10 58 -24 183 -135<br />
Skagerak Energi Net sales 857 1,117 530 514 1,166<br />
EBIT 413 778 142 119 829<br />
Customers Net sales 585 403 653 37 237<br />
EBIT 39 121 426 -63 43<br />
Industrial ownership Net sales 991 2,069 1,006 819 2,107<br />
EBIT 84 14 17 -21 -9<br />
Source: Company data and <strong>Danske</strong> Markets<br />
193 | 13 April 2011<br />
www.danskeresearch.com
<strong>Scandi</strong> Handbook<br />
Statnett<br />
Company overview<br />
Statnett is the transmission power system operator (TSO) in Norway, owning some<br />
10,000km of high-voltage power networks, which comprises some 90% of Norway’s<br />
total transmission grid. As Statnett leases the remaining 10% from other utilities, Statnett<br />
is the sole operator of transmission assets in Norway. Statnett also owns part of the<br />
Norwegian distribution grid. Revenues on the power networks are regulated by the<br />
Norwegian Water Resources and Energy Directorate. It is Statnett’s task to secure a<br />
smooth and well functioning power network in Norway, ensuring that all agents have<br />
free and equal access to transport power. Apart from power networks, Statnett also has<br />
minor heavy transportation activities through the wholly owned Statnett Transport A/S,<br />
and is active in the Nordic power exchange through its ownership of the company Nord<br />
Pool Spot AS. Statnett also has a stake in the cross-border transmission cables connecting<br />
Norway and continental Europe. Statnett is 100% owned by the ‘AAA’ rated Kingdom<br />
of Norway. Statnett enjoys a strong credit rating from both Moody’s and S&P’s,<br />
and is rated, respectively, ‘A+’ and ‘A2’. Moody’s assigns a three-notch uplift due to<br />
government support while S&P’s assign four notches, reflecting the strong, implicit<br />
government willingness to support Statnett should the group face financial difficulties.<br />
Key credit considerations<br />
Main business areas are regulated<br />
The Norwegian energy regulator, The Norwegian Water Resources and Energy Directorate,<br />
decides on the allowed revenue for Statnett. The regulator decides on a fair<br />
level of revenue to cover a pre-defined level of operating costs and a fair return on<br />
investments. It uses a yearly ‘revenue cap’ to decide Statnett’s allowed revenues: if<br />
Statnett’s income is too high or too low according to the allowed return on investments,<br />
the next year’s allowed revenue is adjusted downward or upward. In the new<br />
regulatory period, it has been decided that any over- or under-shooting of revenues<br />
shall be adjusted in the following three to four years instead of previously being<br />
adjusted over one year. This model ensures that in the medium and long terms Statnett’s<br />
income should be stable and reflect a fair return on previous years’ investments.<br />
In practice, Statnett’s revenues consist of a fixed tariff charged to power suppliers.<br />
On top of this, Statnett charges so-called congestion prices, where excess<br />
demand for a particular interconnector is regulated by higher prices. The Norwegian<br />
regulator ensures the long-term stability of the return on investments through annual<br />
adjustments to the fixed tariff element of Statnett’s revenues. Put simply, Statnett’s<br />
allowed return on investments is roughly the five-year yield on a Norwegian government<br />
bond plus around 300bp. Currently this corresponds to 6.27%. Finally Statnett’s<br />
revenues are adjusted to incentivise a low level of outages.<br />
Government ownership means long-term cash flow stability<br />
Statnett is 100% owned by the ‘AAA’ rated Kingdom of Norway. On the basis of<br />
statements from the ruling party we expect Norway to be very supportive of Statnett as<br />
it sees the group as a vital strategic asset. In this respect it is also important to note that<br />
Statnett is embedded in the Ministry of Oil and Energy as opposed to the Ministry of<br />
Trade and Industry. The Ministry of Oil and Energy traditionally holds Norway’s strategic<br />
core assets, such as Statoil, Statkraft and Statnett. It is also noteworthy that the<br />
opposition has not mentioned Statnett when it points to companies it sees as appropriate<br />
for part or full divestment, such as Telenor, Norsk Hydro and DnB NOR. Should Statnett<br />
experience financial difficulties it is very likely that the Norwegian government<br />
will intervene with some sort of financial aid. Furthermore, Statnett’s long-term financial<br />
rigour is ensured through the regulated income model in Norway, where Statnett is<br />
secured a fair return on its investments.<br />
HOLD<br />
Sector: Utility, Electric Utilities<br />
Corporate ticker: STATNE<br />
Equity ticker: 1005Z NO<br />
Market cap: Not Listed<br />
Ratings:<br />
S&P rating: A+/ S<br />
Moodys rating: A2/ S<br />
Fitch rating: NR<br />
Analyst:<br />
Jakob Magnussen, CFA<br />
Jakob.magnussen@danskebank.dk<br />
+45 45 128503<br />
Louis Landeman<br />
louis.landeman@danskebank.com<br />
+46 8 568 80524<br />
Key credit issues<br />
Strengths:<br />
• Monopoly TSO in Norway.<br />
• Wholly owned by the Kingdom of<br />
Norway.<br />
• Visible regulated revenues.<br />
• Some diversification into other<br />
business areas.<br />
Challenges:<br />
• Stretched credit metrics.<br />
• Large investment budget.<br />
• Weak on a stand-alone basis.<br />
Source: <strong>Danske</strong> Markets<br />
194 | 13 April 2011<br />
www.danskeresearch.com
<strong>Scandi</strong> Handbook<br />
Liquidity<br />
Statnett’s liquidity profile is not strong in the short term. In its Q4 10 earnings statement<br />
Statnett showed a cash and equivalents position of NOK1.7bn. This doesn’t<br />
compare well to Statnett’s short-term debt maturities of NOK1.3bn and planned 2011<br />
capex of NOK2.9bn. Statnett also plans to distribute NOK499m in dividends in H1<br />
11. Due to the nature of Statnett’s regulated revenue profile, it is likely that the group<br />
will demonstrate a significant drop in cash flow from operations during 2011, as it<br />
will have to return parts of excess revenues gained in 2010. Therefore the contribution<br />
to Statnett’s liquidity situation from internally generated cash should be minor in<br />
2011. We therefore deem Statnett’s liquidity profile as stretched. Mitigating the<br />
short-term funding pressure is a strong credit facility base. Statnett has a two-tranche<br />
credit facility available: the first matures in 2012 and amounts to NOK2bn; the second<br />
was recently established and matures in 2016 with options to prolong it until<br />
2018 in the amount of NOK3.5bn. However, summarizing Statnett’s liquidity situation,<br />
we deem it very likely that we will see Statnett issuing in 2011.<br />
Current performance drivers<br />
2010 report showed sequential improvement, but this is temporary<br />
In 2010 Statnett reported revenue growth of 153% y/y to NOK7.2bn. The strong topline<br />
figure reflects congestion revenues due to excess cross-border power transmission<br />
spurred by higher-than-normal imports into the Norwegian system. The higher-thannormal<br />
imports are a consequence of the very dry conditions seen in Norway in 2010,<br />
coupled with below-average temperatures. The combined effect of low supply and high<br />
demand has driven a surge in prices and import requirements. Statnett’s revenues were<br />
further boosted by an allowed tariff deficit recovery in 2010. In 2009 Statnett’s revenues<br />
were NOK1bn lower than the level commensurate with a fair return on investments<br />
as stipulated by the regulator. This meant that Statnett was allowed to hike its<br />
fixed network tariff in 2010 to compensate for the lost revenues in 2009. The high<br />
revenues in 2010 are above the allowed level and the estimated surplus of NOK1.5bn<br />
will contribute to tariff reductions in the coming 3-4 years. Statnett’s total costs were<br />
only up slightly during the year, taking group EBITDA to NOK4bn (NOK300m in<br />
2009). 2010 net earnings were NOK2.2bn vs a negative NOK500m in 2009.<br />
In 2010 Statnett landed some NOK3.8bn in cash flow from operations vs. negative<br />
NOK462m in 2009. In spite of capex being up 48% y/y, Group free cash flow still<br />
landed at a strong level of NOK1.9bn (negative NOK1.7bn in 2009). The strong, albeit<br />
temporary, inflow of cash, caused Group net debt to fall 12% y/y to NOK10bn. On<br />
adjusted basis we see Statnett’s net debt at NOK10.6bn. With the surge in operating<br />
cash flow in 2010, Statnett delivered a significant improvement in debt metrics with<br />
adj. net debt to LTM EBITDA at 2.6x vs. 40.8x in 2009. Adjusted net debt to total<br />
capital was 58.1% in 2010 vs. 68.2% in 2009.<br />
Debt maturity profile<br />
NOKbn<br />
12000<br />
10000<br />
8000<br />
6000<br />
4000<br />
2000<br />
0<br />
Source: <strong>Danske</strong> Markets & Company data.<br />
Profitability<br />
NOKm<br />
2,500<br />
2,000<br />
1,500<br />
1,000<br />
500<br />
0<br />
-500<br />
Source: Company data, <strong>Danske</strong> Markets<br />
Earnings by segment, 2010<br />
Source: Company data, <strong>Danske</strong> Markets<br />
Debt metrics<br />
NOKm<br />
14,000<br />
12,000<br />
10,000<br />
8,000<br />
6,000<br />
4,000<br />
2,000<br />
0<br />
Short term<br />
Source: Company data, <strong>Danske</strong> Markets<br />
Long term<br />
Q4 09 Q1 10 Q2 10 Q3 10 Q4 10<br />
70%<br />
60%<br />
50%<br />
40%<br />
30%<br />
20%<br />
10%<br />
Net sales EBITDA EBITDA-margin (rhs)<br />
Nord Pool<br />
1%<br />
Significant capex on the agenda over the next 10 years<br />
Statnett has identified a capex budget of up to NOK40bn over the coming 10 years.<br />
This includes investments in a new Oslo fjord cable, a general upgrade and additions to<br />
Norwegian transformer stations, and the Skagerrak (Norway-Denmark) and Nordlink<br />
(Norway-Germany) interconnectors. Until and including 2014, Statnett guides investments<br />
in the NOK18bn area. This massive capex budget is a reflection of the Norwegian<br />
state’s ambitions to secure a well functioning transmission infrastructure. The<br />
investments in cross-border interconnectors should reduce Norway’s current dependence<br />
on hydro generation and subsequent very volatile power prices, as Norway will be<br />
better equipped to export power in times of overcapacity and vice versa. Currently<br />
Statnett contemplates interconnectors to the UK, Holland, Germany, Denmark and<br />
Sweden. The investment budget is also aiming to facilitate further investments from<br />
generators in remotely situated renewable energy. Constructing a new wind park or<br />
hydro-plant is only viable if the backbone power infrastructure is in place to facilitate<br />
transportation of power. Even though the capex budget is credit negative, we once<br />
again highlight that a fair return on the investments is ensured through the power regu-<br />
Transportation<br />
0%<br />
Revenues<br />
99%<br />
Q4 09 Q1 10 Q2 10 Q3 10 Q4 10<br />
0%<br />
-10%<br />
70.0x<br />
60.0x<br />
50.0x<br />
40.0x<br />
30.0x<br />
20.0x<br />
10.0x<br />
0.0x<br />
Net debt Equity Net debt/LTM EBITDA (rhs)<br />
195 | 13 April 2011<br />
www.danskeresearch.com
<strong>Scandi</strong> Handbook<br />
lation model. The most negative implication of the tough capex budget is an increased<br />
issuance pressure, which could drive secondary spreads wider. Of the flagged<br />
NOK18bn over the next four years, we estimate that some NOK3.5bn is committed.<br />
In the case of government-owned power generator Statkraft, the government decided<br />
on an extraordinary equity injection to fund Statkraft’s large investment budget over the<br />
next five years. This was done to protect Statkraft’s credit metrics. The government,<br />
however, decided not to support Statnett’s significant capex budget. We believe,<br />
though, that the reason for this difference in treatment is the government’s ability to<br />
support Statnett through the regulated revenue cap. We don’t see the government’s<br />
reluctance to inject equity as a sign of weakening support.<br />
Financial targets<br />
Statnett aims to always hold cash and equivalents to cover the coming 12 months of<br />
operational and investment costs. Furthermore, it is Statnett’s ambition to have an<br />
evenly distributed maturity profile. As Statnett’s allowed return on investment is partly<br />
linked to the interest rate of a Norwegian bond, Statnett has an effective interest rate<br />
risk hedge. Statnett is positively exposed to interest rate hikes through its tariff structure,<br />
which to a certain degree offsets Statnett’s negative exposure to rate hikes through<br />
its funding. Statnett doesn’t provide any guidance on ratings targets or financial metrics,<br />
so it looks slightly less appealing than Nordic utilities peers, which generally have<br />
a good reputation of being clear about financial targets.<br />
Statnett has a long-term dividend payout target of 50%.<br />
Rating<br />
Moody’s assigns an ‘A2’ rating to Statnett. This rating includes a three-notch uplift due<br />
to assumed support from the Kingdom of Norway. On a stand-alone basis Moody’s<br />
sees Statnett as a ‘Baa2’ issuer. Moody’s states that a benign operating profile is partly<br />
offset by Statnett’s massive capex budget over the next 10 years.<br />
S&P’s sees Statnett’s rating a ‘A+’. S&P’s assigns four notches to Statnett due to government<br />
support. S&P’s hence shares Moody’s view that Statnett’s stand-alone rating is<br />
in the middle of the ‘BBB’ range.<br />
Both agencies flag that, under the revenue-cap model in Norway, Statnett won’t be<br />
compensated for incurred investment costs until the assets are in operation. As many of<br />
Statnett’s investments have a relatively long lead time from construction initiation to<br />
assets coming on stream, this implies a short-term negative cash effect, which is likely<br />
to impair credit metrics as Statnett hikes its investments. However, this is incorporated<br />
by rating agencies into current metrics. None of Statnett’s assets are pledged.<br />
Recommendation<br />
We think the regulated nature of Statkraft’s business model makes it a strong credit.<br />
We like Statnett’s role in Norway as the government’s tool for facilitating its electricity<br />
policy, making the ties between the government and Statnett very strong. This<br />
should also ensure timely support if Statnett experiences financial problems. Compared<br />
to many transmission grid issuers from peripheral EU countries, the strong<br />
quality of the ‘AAA’-rated Norwegian government is a key comparative credit<br />
strength for Statnett. On a stand-alone basis, we think the credit-negative contribution<br />
from Statnett’s mediocre credit metrics and high capex budget are offset by the longterm<br />
stability of income. Currently Statnett doesn’t have any EUR bonds outstanding<br />
but only issues in NOK, SEK and CHF. However, we expect Statnett to visit the<br />
EUR market in the short to medium term, as it seeks funding for its large capex<br />
budget. We subsequently initiate coverage on Statnett with a HOLD recommendation<br />
(see list of instrument prices at the end of this book).<br />
196 | 13 April 2011<br />
www.danskeresearch.com
<strong>Scandi</strong> Handbook<br />
Financial data Statnett<br />
Key figures (NOKm) 2006 2007 2008 2009 2010<br />
Net Sales 3,205 3,415 4,256 2,862 7,247<br />
EBITDA 1,006 1,535 1,722 259 3,975<br />
EBIT 308 1,025 1,194 -403 3,309<br />
Net interest expenses 148 203 289 289 232<br />
Net profit 163 651 1,517 -480 2,228<br />
FFO [1] 858 1,340 1,358 -98 3,682<br />
Capex [2] 863 661 2,773 1,278 1,892<br />
FCF [3] 196 1,134 -1,244 -1,740 1,912<br />
RCF [4] 771 1,188 1,040 -597 3,550<br />
Net Debt [5] 6,962 8,271 11,345 11,444 10,035<br />
Adjusted Net debt [6] 7,120 8,441 12,007 12,036 10,627<br />
Total Debt 7,752 9,309 12,340 12,340 11,757<br />
Equity 4,907 5,562 6,585 5,618 7,658<br />
Ratios<br />
EBITDA margin 31.4% 44.9% 40.5% 9.0% 54.9%<br />
Net debt / EBITDA 6.9x 5.4x 6.6x 44.2x 2.5x<br />
Adjusted net debt / EBITDA 6.9x 5.4x 6.9x 40.8x 2.6x<br />
Adjusted FFO interest coverage [7] 3.9x 4.7x 2.7x 0.0x 11.2x<br />
Adjusted FFO/net debt 0.1x 0.2x 0.1x 0.0x 0.3x<br />
Adjusted RCF/net debt 10.8% 14.1% 8.7% -5.0% 33.4%<br />
(1) Cash flow from operating activities before changes in working capital. (2) Investments in tangible assets. (3) Cash flow from operating activities less capex. (4) Cash<br />
flow from operating activities less dividends but before changes in working capital. (5) Total interest-bearing debt less cash and marketable securities. (6) Net debt<br />
adjusted for contingent liabilities/contractual obligations, pension liabilities and debt in subsidiaries, which are not wholly owned and operating leases. Source: Company<br />
data, <strong>Danske</strong> Fixed Income Credit Research<br />
Quarterly review (NOKm)<br />
Q4 09 Q1 10 Q2 10 Q3 10 Q4 10<br />
Net sales 855 2,270 1,573 1,392 2,012<br />
EBITDA -22 1,382 815 705 1,073<br />
EBITDA margin -3% 61% 52% 51% 53%<br />
Net income 60 65 41 59 67<br />
Net debt 11,444 10,257 10,398 10,237 10,035<br />
Net debt/LTM EBITDA 63.9x 7.2x 4.7x 3.6x 2.5x<br />
Source: Company data, <strong>Danske</strong> Fixed Income Credit Research<br />
197 | 13 April 2011<br />
www.danskeresearch.com
<strong>Scandi</strong> Handbook<br />
Statoil<br />
Company overview<br />
Norwegian Statoil ASA is the result of the merger between Statoil and the oil and gas<br />
activities of Norsk Hydro that took place on 1 October 2007. The group is a vertically<br />
integrated oil and gas company with activities in 42 different countries, employing<br />
some 30,300 people. It is the largest producer of crude oil and gas on the Norwegian<br />
Continental Shelf (NCS), which constitutes 73% of total group equity production.<br />
In 2010, Statoil had 5.3bn barrels of oil equivalent (boe) in proven liquids and<br />
gas reserves and an average daily production of 1.9m boe per day. International E&P<br />
is located in Canada, the Gulf of Mexico, Venezuela, Brazil, Algeria, Libya, Angola,<br />
Azerbaijan, the UK, China and Russia. In 2010 Statoil’s reserve replacement ratio<br />
was 87%. While improving, this underlines Statoil’s fundamental problems with<br />
declining reserves in the NCS, forcing Statoil to look beyond its traditional home turf<br />
in search of new production assets. Statoil is the second-largest supplier of natural<br />
gas to Europe and the world’s largest deepwater operator. After the partial IPO, Statoil<br />
has a 54% stake in Statoil Fuel and Retail, which includes refining activities and<br />
retail activities selling petrol, diesel and groceries at around 2,283 filling stations in<br />
<strong>Scandi</strong>navia. The ‘AAA’-rated Norwegian state holds a 67% stake in Statoil. This<br />
causes Moody’s to assign a two-notch uplift from the group’s standalone profile,<br />
arriving at an ‘Aa2’. S&P assigns a one-notch uplift to ‘AA-’.<br />
Key credit considerations<br />
Strong operational profile<br />
Statoil has a strong asset base with NOK5.3bn in proven reserves in several attractive<br />
regions – i.e. North America, North Africa and several Eurasian states. The bulk of<br />
the reserves are located on the NCS and gives the group access to hydrocarbon assets<br />
located in a politically and economically stable region. The group is furthermore the<br />
world’s largest deepwater operator. The expertise in this segment will be a crucial<br />
competitive advantage going forward, as we believe future oil resources will be<br />
found in deep waters as most land-based production sites are being depleted. Statoil<br />
expects to increase its global liquids production by 3% annually, primarily due to<br />
acquired and potential reserves being matured for production. In 2010, Statoil experienced<br />
several technical problems relating to assets on the NCS. Combined with increased<br />
maintenance and declining production on old assets, overall equity production<br />
is down by 7% y/y in 2010.<br />
Declining reserves on the NCS<br />
Statoil has an ambitious capex budget of USD16bn for 2010 (up 23% on last year).<br />
The continued high capex budget is an attempt to address the group’s declining reserves.<br />
Proven reserves have dropped from 5.4bn boe to 5.3bn boe y/y. The reserve<br />
replacement ratio in 2010 was 87% up from 73% in 2009. Statoil is committed to<br />
increase its reserve replacement rate to over 100% in the next few years. It continues<br />
its soft guidance on daily production, expecting a level of 1.9m boe/day or slightly<br />
under. This guidance points to a lifetime of Statoil’s current proven reserves of fewer<br />
than eight years. To our understanding this is below levels seen at Statoil’s peers.<br />
The high capex budget could relieve some pressure in the reserve replacement ratio,<br />
but we expect that Statoil’s capex budget will need to stay at these high levels in the<br />
medium- to long-run also, to maintain an adequate reserve replacement ratio. The<br />
current E&P budget, which targets both NCS and international production, will lead<br />
to international fields coming on stream, thus creating greater diversification in cash<br />
flow generation across regions and a fair share of lower taxed income from the international<br />
division, which is credit positive.<br />
SELL<br />
Sector: Energy, Oil and Gas<br />
Corporate ticker: STOIL<br />
Equity ticker: STL NO equity<br />
Market cap: NOK505bn<br />
Ratings:<br />
S&P rating: AA- / S<br />
Moodys rating: Aa2 / S<br />
Fitch rating: NR / NR<br />
Analyst:<br />
Jakob Magnussen, CFA<br />
Jakob.magnussen@danskebank.dk<br />
+45 45 128503<br />
Louis Landeman<br />
louis.landeman@danskebank.com<br />
+46 8 568 80524<br />
Key credit issues<br />
Strengths:<br />
• Vital strategic asset for the AAArated<br />
Norwegian government<br />
• Largest deepwater operator globally<br />
• Second largest supplier of natural<br />
gas to Europe<br />
• Strong geographic diversification<br />
• Strong asset base<br />
• Majority of production in politically<br />
stable Norway<br />
Challenges:<br />
• Volatile oil and gas prices reduce<br />
earnings stability<br />
• Declining reserves on the NSC<br />
• Future large capex programme<br />
and dividend payouts pressure<br />
credit metrics<br />
• Increased production costs pressure<br />
earnings margins<br />
• Exposure to politically unstable<br />
markets<br />
Source: <strong>Danske</strong> Markets<br />
198 | 13 April 2011<br />
www.danskeresearch.com
<strong>Scandi</strong> Handbook<br />
Liquidity<br />
Statoil’s liquidity situation is somewhat stretched. In its 2010 report, Statoil demonstrated<br />
cash & equivalents of NOK30bn. In addition to this Statoil produced some<br />
NOK80.8bn in cash flow from operations last year. Given the elevated level of the<br />
current Brent oil prices, it is likely that Statoil will be able to reproduce or even surpass<br />
such a level in 2011. This, however, is offset by short-term debt maturities of<br />
NOK11.7bn, projected capex of NOK87.2bn and a dividend payment of NOK19.9bn.<br />
Adding these sources and drags on short-term liquidity, Statoil’s short term liquidity<br />
profile doesn’t look overly solid. We would hence not be surprised to see Statoil in the<br />
primary market during 2011. The most likely issuance currency is the US dollar as we<br />
see it, as most of Statoil’s income is in US dollars through oil & gas sales.<br />
Relieving short-term funding pressure somewhat is Statoil’s USD3bn revolving credit<br />
facility. This was agreed late-2010 and matures in five years with options for a twoyear<br />
extension. However, we expect that Statoil considers this as an emergency facility<br />
and hence we expect it to borrow in the primary market.<br />
Current performance drivers<br />
Mixed 2010 numbers from Statoil<br />
Statoil reported a 4% reduction in equity production y/y in its 2010 annual report,<br />
with a production of 1,888m BOE. Rising liquids prices of 32% on average, more<br />
than offset the lower production and a 10% fall in gas prices y/y. This caused revenues<br />
to grow 14% y/y to NOK529.6bn. The production cost per barrel of oil equivalent<br />
increased to NOK42.8, from NOK38.4 in 2009. In spite of this, group EBITDA<br />
still rose 7% taking group EBITDA margins to 35.5% from 37.7% in 2009. The<br />
increase in production cost is mainly related to lower equity production, yielding<br />
lower fixed cost coverage. On top of this Statoil also incurred several costs related to<br />
new fields coming on stream. EBIT increased to NOK137bn, up from NOK121bn<br />
y/y. Net income increased to NOK37.6bn from NOK 17.7bn the year before. The<br />
increase is mainly due to stronger net operating income and a lower net financial loss<br />
from US dollar hedges (Statoil only hedges its dollar exposure, not its oil price exposure).<br />
The tax rate for the year ended at 72.5%, down from 84.6% in 2009, partly<br />
related to a relatively lower share of income stemming from the NCS which is aggressively<br />
taxed by the Norwegian authorities.<br />
Improved cash generation<br />
Cash flow from operations in 2010 increased to NOK80.8bn from NOK73bn the year<br />
before, mainly due to higher oil price, lower tax payments and higher cash flow from<br />
underlying operations. In spite of this, a high capex level caused net debt to increase<br />
to NOK81.2bn from NOK72bn in 2009. This translated into an adjusted net<br />
debt/EBITDA of 0.8x, which is on par with the level seen in 2009. Group leverage<br />
increased slightly, as adjusted net debt to total capital rose to 47.1% from 46.5% in<br />
2009.<br />
Fuel and Retail partially spun off<br />
In 2010 Statoil decided to sell close to half of its retailing network in an IPO. Together<br />
with the divestment of parts assets in Brazil and Canada, we believe this is<br />
mildly credit positive as the positive effect on reduced net debt offset’s the partial<br />
loss of a stable, albeit low margin, asset. Statoil now has 54% stake in Statoil Fuel &<br />
Retail.<br />
Maturity profile as of end 2010<br />
NOKm<br />
70,000<br />
60,000<br />
50,000<br />
40,000<br />
30,000<br />
20,000<br />
10,000<br />
0<br />
Source: Company data and <strong>Danske</strong> Markets<br />
Profitability<br />
NOKm<br />
700,000<br />
600,000<br />
500,000<br />
400,000<br />
300,000<br />
200,000<br />
100,000<br />
0<br />
Source: Company data and <strong>Danske</strong> Markets<br />
Divisional EBIT split 2010<br />
Development<br />
&<br />
Production<br />
International<br />
9%<br />
Source: Company data and <strong>Danske</strong> Markets<br />
Financial metrics<br />
2011 12-13 14-15 2015+<br />
2006 2007 2008 2009 2010<br />
Source: Company data and <strong>Danske</strong> Markets<br />
41%<br />
40%<br />
39%<br />
38%<br />
37%<br />
36%<br />
35%<br />
34%<br />
33%<br />
32%<br />
31%<br />
30%<br />
Net sales EBITDA EBITDA margin (rhs)<br />
Marketing,<br />
Processing<br />
and<br />
Renewable<br />
energy<br />
5%<br />
NOKm<br />
250,000<br />
200,000<br />
150,000<br />
100,000<br />
50,000<br />
0<br />
2006 2007 2008 2009 2010<br />
Political risk has emerged as an important driver in the industry<br />
The BP oil spill in the Gulf of Mexico in May 2010 turned out to be the biggest environmental<br />
tragedy ever recorded in the industry’s history. The US government imposed<br />
a six-month drilling moratorium to determine the cause of the accident. Statoil<br />
and other oil companies alike have been negatively affected by the moratorium. For<br />
BP, the dire effects of the accident have been reflected in the company’s CEO having<br />
to resign, massive negative media coverage, in addition to significant economic con-<br />
Development<br />
&<br />
Production<br />
Norway<br />
86%<br />
Net debt Equity Net debt/EBITDA (rhs)<br />
X<br />
0.45<br />
0.4<br />
0.35<br />
0.3<br />
0.25<br />
0.2<br />
0.15<br />
0.1<br />
0.05<br />
0<br />
199 | 13 April 2011<br />
www.danskeresearch.com
<strong>Scandi</strong> Handbook<br />
sequences with accumulative losses of USD32bn for BP. We believe oil companies<br />
will meet stricter regulations in the form of safety and environmental requirements,<br />
which will have a financial impact through costs related to upgrades and maintenance<br />
activities. In short, we expect political risk to become a stronger driver of business<br />
risk in terms of capex requirements. We stress though, that safety requirements on<br />
the NCS, is already among the toughest in the world.<br />
Outlook and financial targets<br />
Statoil has on several occasions restated its production guidance and is now taking a<br />
more cautious stance on 2011, guiding for equity production to be on par with 2010.<br />
After 2011, Statoil guides for a 3% annual growth rate in production. Although we<br />
expect extensive maintenance work to translate into additional production, the overall<br />
trend is that NCS E&P assets are maturing and will require more maintenance, which<br />
could spell a less consistent operational profile going forward. On a positive note, a<br />
strong recovery in oil prices has a significant positive impact and offsets the impact<br />
of impaired operational performance.<br />
Founded in ambitions of increasing Statoil’s international footprint replacing depleting<br />
reserves on the NCS, the company is boosting its capital expenditures. Capex for<br />
2011 will be USD16bn, up from USD13bn in the past years. Group dividend per<br />
share for the year is NOK6.25 (NOK19.9bn) vs NOK6 in 2009 (NOK19.1bn).<br />
Statoil states that it seeks to always maintain credit metrics consistent with at least a<br />
rating in the ‘A’ category. Given Statoil’s current ratings of ‘Aa2’/’AA-’, this policy<br />
certainly allows for several notch’s downgrade worth of credit metric deterioration,<br />
which of course is a concern from a credit perspective.<br />
Rating<br />
In spite of the above mentioned drags on cash and subsequent pressure on debt metrics,<br />
we still believe Statoil has some headroom under its current rating and combined<br />
with a strong oil price, we don’t expect to see any short term rating action on<br />
Statoil. S&P requires Statoil’s adjusted FFO to adjusted net debt to be in the 55-60%<br />
area for the current rating. After 2010 this was 59%. The agency cautions, however,<br />
that Statoil’s ability to replace declining proven reserves will be a key issue for their<br />
credit quality in the medium term.<br />
Recommendation<br />
Statoil is a strong E&P player across the whole value chain, with considerable potential<br />
in the international market. Statoil is refocusing its efforts to secure international<br />
expansion and streamlining operations to become a purer upstream business. We see<br />
this as a potential cause for concern, as Statoil will end up less diversified and more<br />
exposed to the volatile exploration business. In addition, Statoil’s continued efforts<br />
on expanding internationally bear both financial and political risk. About half of<br />
Statoil’s capex budget is intended for international development that does not yield<br />
immediate cash flow. Statoil delivered a decent 2010 report, which was helped by a<br />
strong oil price. We expect 2011 to show an average Brent price somewhat above the<br />
USD100/bbl, boding well for 2011 cash generation at Statoil. However, the company<br />
continues to be haunted by technical problems and impaired performance. We fear<br />
that we have not seen the full effect of these problems and the impact it will have on<br />
operational performance going forward. We therefore continue to have a cautious<br />
view on production. The financial risk profile is still strong, with credit metrics in<br />
line with current ratings. We believe cash bonds trade tight and fear that the bond<br />
could widen on the back of capex driven credit metrics deterioration in 2011. We<br />
therefore change our recommendation on Statoil to SELL from HOLD. (See list of<br />
instrument prices at the end of this book.)<br />
200 | 13 April 2011<br />
www.danskeresearch.com
<strong>Scandi</strong> Handbook<br />
Financial data Statoil<br />
Key figures (NOKm) 2006 2007 2008 2009 2010<br />
Net Sales 518,960 522,797 656,020 465,433 529,648<br />
EBITDA 205,614 176,576 241,828 175,696 187,836<br />
EBIT 166,164 137,204 198,832 121,640 137,228<br />
Net interest expenses -615 436 -14,198 8,743 -1,424<br />
Net profit 51,847 44,641 43,270 17,715 37,647<br />
FFO [1] 93,879 93,426 106,338 68,375 91,163<br />
Capex [2] 49,365 69,006 67,260 74,355 70,651<br />
FCF [5] 39,228 24,920 35,273 -1,354 10,164<br />
RCF [4] 76,123 67,731 79,256 45,290 72,068<br />
Net Debt [6] 46,222 28,917 46,916 72,367 69,681<br />
Adjusted Net debt [7] 86,034 91,655 120,047 142,324 159,465<br />
Total Debt 54,772 50,540 75,301 104,112 111,527<br />
Equity 169,407 179,067 216,055 200,118 226,395<br />
Ratios 2005 2006 2007 2008 2009<br />
EBITDA margin 40% 34% 37% 38% 35%<br />
Net debt / EBITDA 0.2x 0.2x 0.2x 0.4x 0.4x<br />
Adjusted net debt / EBITDA 0.4x 0.5x 0.5x 0.8x 0.8x<br />
Adjusted FFO interest coverage 22.0x 18.2x 59.1x 4.8x 16.2x<br />
Adjusted FFO/net debt 1.1x 1.1x 1.0x 0.5x 0.6x<br />
Adjusted RCF/net debt 0.9x 0.8x 0.7x 0.4x 0.5x<br />
Adjusted net debt/total capital 34% 34% 36% 42% 41%<br />
(1) Cash flow from operating activities before changes in working capital. (2) Investments in tangible assets. (3) Cash flow from operating activities less capex. (4) Cash<br />
flow from operating activities less dividends but before changes in working capital. (5) Total interest-bearing debt less cash and marketable securities. (6) Net debt<br />
adjusted for contingent liabilities/contractual obligations, pension liabilities and debt in subsidiaries, which are not wholly owned and operating leases. Source: Company<br />
data and <strong>Danske</strong> Fixed Income Credit Research<br />
Source: Company data and <strong>Danske</strong> Markets<br />
Quarterly review (NOKm)<br />
Q4 09 Q1 10 Q2 10 Q3 10 Q4 10<br />
Net sales 124,369 129,715 127,417 125,809 143,286<br />
EBITDA 46,041 50,721 40,910 40,831 55,374<br />
EBITDA margin (%) 37.0% 39.1% 32.1% 32.5% 38.6%<br />
Net income 7,079 11,137 3,057 13,777 9,676<br />
Net debt 72,367 75,727 89,041 83,279 81,190<br />
Net debt/LTM EBITDA (x) 0.4x 0.4x 0.5x 0.5x 0.4x<br />
Source: Company data and <strong>Danske</strong> Markets<br />
Divisional quarterly overview (NOKm)<br />
Q4 09 Q1 10 Q2 10 Q3 10 Q4 10<br />
E&P Norway Net sales 158,663 42,119 42,990 35,630 49,989<br />
EBIT margin 66% 68% 69% 66% 68%<br />
E&P International Net sales 41,835 13,856 11,269 12,551 13,319<br />
EBIT margin 6% 35% 22% 9% 31%<br />
Natural Gas Net sales 98,613 24,336 18,694 18,233 26,258<br />
EBIT margin 19% 20% -24% 18% 19%<br />
Source: Company data and <strong>Danske</strong> Markets<br />
*in these quarter Fuel & Retail is included in Marketing & Manufacturing<br />
201 | 13 April 2011<br />
www.danskeresearch.com
<strong>Scandi</strong> Handbook<br />
TVO<br />
Company overview<br />
Teollisuuden Voima Oyj (TVO) is Finland’s largest nuclear-based power producer,<br />
producing 15.7TWh of power in 2010. The bulk of TVO’s power is produced by the<br />
Olkiluoto 1 and 2 reactors (OL1 and OL2), based near Rauma in South-West<br />
Finland, with installed capacity of 880MW and 860MW respectively. TVO also has<br />
some minor coal-fuelled power generation through the partly-owned Meri-Pori plant,<br />
with installed capacity of 257MW. The power generated at TVO’s plants comprised<br />
roughly 18% of total Finnish power production in 2010. TVO is a ‘not-for-profit’<br />
entity, whose sole purpose is to provide low-cost power to its shareholders. The<br />
shareholders buy electricity from TVO at cost price pro-rata according to their ownership<br />
stake. The owners are large Finnish industrials and utilities, the largest being<br />
Fortum and Pohjolan Voima Oy (PVO). The latter is owned by various energyintensive<br />
industrial companies including the largest Finnish pulp and paper names<br />
and municipality-owned utilities. The power produced at OL1 and OL2 is virtually<br />
non-CO 2 emitting and also has very low variable costs. As such, the power produced<br />
at TVO is very competitive in relation to the average Nordic power prices on the<br />
Nordpool. TVO plans to increase its nuclear capacity further on the OL site: OL3 is<br />
under construction and, when finished, will increase capacity by 1.6GW. This summer,<br />
the Finnish parliament approved a decision in principle for the construction of a<br />
fourth reactor at the OL site. TVO is not rated by either Moody’s or S&P, as its notfor-profit<br />
earnings structure cannot be incorporated into existing rating methodologies.<br />
Fitch assigns an ‘A-’ rating to TVO, however. The rating has a stable outlook,<br />
reflecting a benign competitive production profile and ownership situation, offsetting<br />
very poor credit metrics.<br />
Key credit considerations<br />
Credit metrics bad, but this is irrelevant<br />
The credit metrics of TVO are not good (2010 net debt to LTM EBITDA was 12.1x).<br />
We believe that this is of minor importance, however, as TVO is organised as a notfor-profit<br />
organisation, with strong contractual commitments from its owners to pay<br />
their respective shares of TVO’s cost commitments. Furthermore, should one of the<br />
owners be unable or decline to buy the power produced from TVO, it can be sold in<br />
the Finnish power market. Prices on the Nordpool are a lot higher than the cost of<br />
power produced by TVO. This is because TVO’s production profile primarily stems<br />
from low variable cost nuclear production, compared with the average producer<br />
generating through fossil fuels. Only in the very unusual scenario of prolonged multiple<br />
reactor outages, in combination with the default of several large shareholders,<br />
could one envisage a scenario in which TVO would have problems meeting interest<br />
payments and redemptions through internally-generated funds or fixed cost contributions<br />
from the remaining owners. We see the risk of this scenario as very low.<br />
Insurance schemes protect TVO in event of minor nuclear accidents<br />
According to current Finnish law, nuclear power plant operators can be found liable<br />
to a maximum of EUR342m in the event of a nuclear accident, which TVO has fully<br />
insured against. Current revisions of international conventions point to an increase in<br />
the liability to some EUR700m for the operator. The Finnish government and EU<br />
member countries are liable for EUR700m up to EUR1.5bn. Damages in excess of<br />
EUR1.5bn would be covered by the operator. The timing of this new rule is contingent<br />
on all member states implementing the law. TVO plans to insure the EUR700m<br />
potential liability. We note that TVO would face serious public and governmental<br />
scrutiny if safety standards were not optimal. A nuclear accident could very quickly<br />
shift public sentiment away from nuclear production, which could have serious adverse<br />
consequences for TVO.<br />
BUY<br />
Sector: Utility, Electric Utility<br />
Corporate ticker: TVO<br />
Equity ticker: TVOY FH<br />
Market cap: Not listed<br />
Ratings:<br />
S&P rating: NR<br />
Moodys rating: NR<br />
Fitch rating: A- / S<br />
Analyst:<br />
Jakob Magnussen, CFA<br />
Jakob.magnussen@danskebank.dk<br />
+45 45 128503<br />
Louis Landeman<br />
louis.landeman@danskebank.com<br />
+46 8 568 80524<br />
Key credit issues<br />
Strengths:<br />
• Largest nuclear producer in<br />
Finland.<br />
• Low marginal costs secure competitiveness<br />
relative to Nordpool<br />
prices.<br />
• Strong track record of low level of<br />
nuclear outages relative to peers.<br />
• Debt supported by solid Finnish<br />
industrial and utility players.<br />
Challenges:<br />
• Not-for-profit organisation yields<br />
very poor credit metrics.<br />
• Risk of negative outcome of<br />
Areva/Siemens court battle on<br />
OL3.<br />
• No rating from Moodys or S&P.<br />
• Prolonged reactor outages in<br />
combination with multiple owner<br />
default could compromise TVOs<br />
ability to meet debt obligations.<br />
Source: <strong>Danske</strong> Markets<br />
202 | 13 April 2011<br />
www.danskeresearch.com
<strong>Scandi</strong> Handbook<br />
Liquidity<br />
As TVO continues to face investment for OL3 and upgrades of OL2 in the coming<br />
year, the group’s liquidity situation is not overly comfortable. The 2010 report<br />
showed cash & equivalent of only EUR98m. As TVO’s costs are just covered by<br />
revenues, prospects for cash generation are low, evidenced by 2010 cash flow of only<br />
EUR62m. These means of cash hardly cover short-term debt maturities of EUR167m<br />
and our expectations of capex in the EUR300m area.<br />
At the end of 2010 TVO also had access to some EUR1.7bn in undrawn committed<br />
credit facilities, which matures in 2012. These back-up facilities were boosted earlier<br />
this year where TVO signed a five-year (with the option to prolong for two further<br />
years) revolving facility of EUR1.5bn. On top of this TVO also has the option to<br />
borrow up to EUR300m from its shareholders. An option that expires in 2013 and<br />
will constitute subordinated debt if exercised. We do believe, however, it is likely<br />
that TVO will engage in some opportunistic prefunding in 2011 in order to avoid<br />
using its credit facilities. This is also in line with previously stated ambitions from<br />
TVO to build out its credit curve.<br />
The relatively evenly-distributed maturity profile is in line with TVO’s policy of never<br />
having more than 25% of loans maturing within 12 months. Furthermore, TVO aims<br />
to always have at least EUR90m in cash at hand, allowing it to withstand delayed<br />
payments from shareholders or a temporary freeze from other funding sources.<br />
Current performance drivers<br />
TVOs 2010 report demonstrated stability in generation<br />
Given TVO’s business profile, it is quite meaningless to discuss developments in<br />
revenues and earnings, as the latter hover around zero, as agreed between the owners.<br />
In this context, it is far more interesting to monitor the development in TVO’s power<br />
generation, as reliability and continuous power production are important as a guarantee<br />
of cash flows should any of its shareholders default. In this respect, it is also<br />
relevant to monitor power prices on the Finnish market. If these should fall below the<br />
variable cost of production for TVO, the shareholders would likely procure their<br />
wholesale power in the market instead of through TVO, causing the group to be<br />
forced to sell its power in the market and thereby under-absorb its variable costs.<br />
However, we consider it very unlikely that Finnish power prices will fall below the<br />
variable production costs incurred by TVO, which is in the EUR4-5/MWh range.<br />
In 2010 Finnish power demand grew by 7.6%, which combined with a belowaverage<br />
year in terms of temperature and rising fossil-fuel prices, caused the price of<br />
Finnish power to balloon, making TVO’s power relatively more attractive for its<br />
owners.<br />
Future prolonged excess maintenance at TVO’s reactors could impair TVO’s attractiveness<br />
for shareholders. The turbine upgrade of the OL1 and the refuelling of OL2<br />
in 2010 with subsequent outages caused TVO’s nuclear output to be slightly lower<br />
y/y. This was, however, offset by higher production from TVO’s coal-fuelled plant,<br />
causing 2010 power delivered to owner to be 15.7TWh, up 0.5TWh y/y.<br />
Group net debt at TVO rose y/y to EUR2.6bn, up 8%. Despite this, debt to total<br />
capital improved 1.7 percentage points to 73%, in line with group policy. Credit<br />
coverage metrics for TVO are very bad, but given the not-for-profit nature of the<br />
group, this is of negligible importance. The solidity of TVO’s credit profile was<br />
affirmed by The Japan Credit Rating Agency at ‘AA’ stable outlook in early-<br />
February 2011.<br />
Maturity profile end 2010<br />
EURm<br />
900<br />
800<br />
700<br />
600<br />
500<br />
400<br />
300<br />
200<br />
100<br />
0<br />
Source: <strong>Danske</strong> Markets<br />
Profitability<br />
EUR 000<br />
400,000<br />
350,000<br />
300,000<br />
250,000<br />
200,000<br />
150,000<br />
100,000<br />
50,000<br />
0<br />
11 12 13 14 15 16 17 18 19 >20<br />
Source: Company data, <strong>Danske</strong> Markets<br />
Revenue split by segment 2010<br />
Meri-Pori<br />
(Coal)<br />
18%<br />
Source: Company data, <strong>Danske</strong> Markets<br />
Debt metrics<br />
EUR 000<br />
3,000,000<br />
2,500,000<br />
2,000,000<br />
1,500,000<br />
1,000,000<br />
500,000<br />
2006 2007 2008 2009 2010<br />
Net sales EBITDA EBITDA-margin (rhs)<br />
0<br />
2006 2007 2008 2009 2010<br />
Source: Company data, <strong>Danske</strong> Markets<br />
70%<br />
60%<br />
50%<br />
40%<br />
30%<br />
20%<br />
10%<br />
0%<br />
OL 1 & 2<br />
(Nuclear)<br />
82%<br />
x<br />
90<br />
80<br />
70<br />
60<br />
50<br />
40<br />
30<br />
20<br />
10<br />
0<br />
Net debt Equity net debt/EBITDA (rhs)<br />
In 2010, the Finnish government made a decision in principle, to allow for the construction<br />
of a fourth reactor at the Olkiluoto site. This will require cash outlays for<br />
TVO to the tune of EUR3-4bn. We stress though, that the timing of payments will be<br />
stretched out into the future and that most of the funding will be carried by TVO’s<br />
owner. Hence the credit impact should be minor.<br />
203 | 13 April 2011<br />
www.danskeresearch.com
<strong>Scandi</strong> Handbook<br />
Ownership structure secures demand<br />
TVO’s main shareholder is PVO with a 58.4% stake. PVO is a not-for-profit energyproducing<br />
entity owned by various Finnish utilities and industrial players, including<br />
many of the largest Finnish pulp and paper companies, such as UPM (43%) and Stora<br />
Enso (15%). TVO’s other large shareholders are the large utilities, Fortum (26.1%),<br />
Oy Mankala AB (8.1%) and EPV Energia (6.6%). The latter two are wholly- and<br />
7%-owned by the city of Helsinki. In general terms, TVO’s owners are spread across<br />
Industrials (44%), Fortum (26%) and Municipalities (30%), yielding quite a solid<br />
ownership base. Being an owner of TVO gives the shareholder the right to buy<br />
TVO’s produced power at cost price, proportionate to ownership. The variable cost<br />
price is the variable costs in the production (i.e. nuclear fuel). The owners are contractually<br />
committed to pay their proportionate share of fixed costs including interest<br />
payments. These fixed costs are paid one month in advance, reducing TVO’s working<br />
capital.<br />
Nuclear generation has public support... at least for now<br />
Up until the Fukushima nuclear crisis, Finnish public opinion regarding power derived<br />
from nuclear plants has generally been positive and improving. We do not have<br />
any surveys on the matter after the crisis in Japan struck, however. Up until now, it is<br />
our impression that the public reaction to the crisis has not spurred any meaningful<br />
public demand for a contraction of nuclear capacity in Finland. It is difficult to imagine<br />
just how Finland could replace the vast amounts of power generated at its nuclear<br />
plants. As the Finnish plants are top-notch in terms of security and since the geological<br />
conditions in the Nordic region are far more stable than in Japan, we deem the risk of<br />
any material negative spill-over effects from the Japan crisis as remote. However, it is a<br />
political issue that could change if things turn “uglier” in Japan.<br />
TVO in legal dispute with Areva regarding OL3<br />
The 1.6GW OL3 reactor was scheduled to be commissioned in the spring of 2009.<br />
TVO states that most of the construction work on TVO’s third reactor (OL3) is now<br />
complete and following installation work, TVO guides for reactor start-up in H2 13.<br />
TVO is still in ongoing arbitration proceedings with the construction consortium<br />
Areva/Siemens. The consortium has requested arbitration to get compensated for the<br />
cost related to the delay for which they blame TVO, with subsequent costs of<br />
EUR1.2bn for the consortium. TVO has in return sued the consortium for EUR1.4bn,<br />
as the NPV of the project is reduced due to the delayed start-up. We continue to see<br />
little risk of TVO being found liable for any damages in respect of the delayed construction.<br />
TVO is a low single A credit<br />
TVO’s strong rating is underpinned by its full cost pass-through in its ownership<br />
structure, offsetting very bad credit metrics. Fitch states that upgrade possibilities are<br />
limited due to asset concentration risk. Fitch flags possible downgrade triggers as a<br />
significant reduction in liquidity and a significant increase in the cost structure, causing<br />
TVO’s power to be more expensive than the market power price.<br />
Recommendation<br />
We perceive TVO’s credit profile as solid. TVO has strong contractual commitments<br />
from its owners to pay their respective shares of TVO’s cost. Key credit drivers are<br />
TVO’s ability to stay competitive in terms of costs and to avoid longer unplanned<br />
outages. As TVO’s nuclear power plants are among the best in the Nordic region, we<br />
are optimistic on these points. We caution that TVO’s liquidity profile is stretched<br />
and highlight that primary issuance could be an issue in 2011. Currently investors<br />
should also require a premium for the uncertainty of political response from the Japan<br />
crisis currently unfolding, although we are optimistic that the impact will be<br />
minimal. Despite the strong spread performance we maintain our Buy recommendation<br />
on TVO. (See list of instrument prices at the end of this book).<br />
204 | 13 April 2011<br />
www.danskeresearch.com
<strong>Scandi</strong> Handbook<br />
Financial data TVO<br />
Key figures (EUR 000) 2006 2007 2008 2009 2010<br />
Net Sales 230,439 232,327 257,275 305,390 362,552<br />
EBITDA 42,216 33,872 22,753 57,919 217,879<br />
EBIT -7,503 -16,439 -28,699 4,195 157,924<br />
Net interest expenses -10,314 21,357 25,181 45,586 120,642<br />
Net profit 3,619 -37,361 -53,133 -41,395 37,279<br />
FFO [1] 19,293 6,478 8,576 37,013 64,990<br />
Capex [2] 257,802 229,901 579,070 801,090 316,840<br />
FCF [3] -228,785 -228,241 -570,778 -814,832 -254,810<br />
RCF [4] 19,293 6,478 8,576 37,013 64,990<br />
Net Debt [5] 1,767,891 1,924,209 1,937,348 2,452,727 2,636,848<br />
Adjusted Net debt [6] 1,767,891 1,924,209 2,106,925 2,587,730 2,730,123<br />
Total Debt 1,856,616 2,005,707 1,952,442 2,567,815 2,734,948<br />
Equity 757,769 918,235 822,830 865,811 1,005,529<br />
Ratios<br />
EBITDA margin 18% 15% 9% 19% 60%<br />
Net debt / EBITDA 41.9x 56.8x 85.1x 42.3x 12.1x<br />
Adjusted net debt / EBITDA 41.9x 56.8x 91.8x 44.4x 12.5x<br />
Adjusted FFO interest coverage 1.5x 1.0x 1.1x 0.9x 0.6x<br />
Adjusted FFO/net debt 1% 0% 0% 1% 2%<br />
Adjusted RCF/net debt 11% 6% 5% 5% 5%<br />
Adjusted net debt/total capital 70% 68% 72% 75% 73%<br />
(1) Cash flow from operating activities before changes in working capital. (2) Investments in tangible assets. (3) Cash flow from operating activities less capex. (4) Cash<br />
flow from operating activities less dividends but before changes in working capital. (5) Total interest-bearing debt less cash and marketable securities. (6) Net debt<br />
adjusted for contingent liabilities/contractual obligations, pension liabilities and debt in subsidiaries, which are not wholly owned and operating leases. Source: Company<br />
data, <strong>Danske</strong> Fixed Income Credit Research<br />
Quarterly review (EUR 000)<br />
Q4 09 Q1 10 Q2 10 Q3 10 Q4 10<br />
Net sales 79,244 93,653 84,488 97,613 86,798<br />
EBITDA 15,846 25,294 131,646 30,725 27,214<br />
EBITDA margin (%) 20% 27% 156% 31% 31%<br />
Net income -10,957 4,537 26,075 34,091 -27,424<br />
Net debt 2,452,727 2,507,564 2,561,853 2,652,781 2,636,848<br />
Net debt/LTM EBITDA 42.3x 36.7x 12.7x 13.0x 12.3x<br />
Source: Company data, <strong>Danske</strong> Fixed Income Credit Research<br />
Divisional quarterly overview (EUR 000)<br />
PRIMARY SEGMENTS Q4 09 Q1 10 Q2 10 Q3 10 Q4 10<br />
OL 1 & 2 Net sales 65,991 73,581 70,461 85,255 68,015<br />
EBIT -6,245 6,343 -5,970 5,958 5,042<br />
EBIT margin -9.46% 8.62% -8.47% 6.99% 7.41%<br />
Meri-Pori Net sales 13,253 20,072 14,027 12,358 18,783<br />
EBIT -2,123 -1,255 -784 -506 -2,087<br />
EBIT margin -16.02% -6.25% -5.59% -4.09% -11.11%<br />
Source: Company data, <strong>Danske</strong> Markets .<br />
205 | 13 April 2011<br />
www.danskeresearch.com
<strong>Scandi</strong> Handbook<br />
Vattenfall<br />
Company overview<br />
Swedish Vattenfall is the largest utility in the Nordic region. Annual power generation<br />
of 173TWh makes the Group the fifth-largest generator in Europe. Vattenfall is well<br />
diversified in terms of geography and in terms of generation methods. Furthermore, the<br />
Group is active across the whole electricity value chain. After E.On and RWE, the<br />
group ranks third in generation in Germany. Through the acquisition of Dutch Nuon in<br />
2009, Vattenfall also has a leading position in the Dutch electricity and gas market.<br />
Vattenfall recently launched a new strategy seeking to focus on core markets Sweden,<br />
Germany and Holland. This entails divestment of fossil-fuelled power and heat plants<br />
in Denmark and Poland. While production in the Nordic countries is primarily based on<br />
nuclear and hydro plants, German and Dutch operations mainly use nuclear and fossilfuelled<br />
plants. Several of the German fossil-fuelled plants are lignite fired, where the<br />
lignite is procured from Vattenfall’s own mines. With an announced capex budget of<br />
SEK165bn during the coming five years, Vattenfall has a solid focus on building non-<br />
CO2 emitting generation assets. Vattenfall is 100% owned by the ‘AAA’ rated Swedish<br />
state. Both Moody’s and S&P factor in one notch of government support. Vattenfall is<br />
committed to maintaining at least a “A-/A3” rating.<br />
Key credit considerations<br />
Good diversification across regions and operations<br />
Vattenfall is a vertically integrated utility company with a high degree of geographical<br />
diversification within politically stable and economically healthy areas. The<br />
Swedish generation is mainly hydro and nuclear based, while the German, Danish,<br />
Polish and Dutch generation is dominated by fossil fuels, adding up to a welldiversified<br />
group in terms of generation types and income sources. Vattenfall’s generation<br />
asset base is split between 21% hydro, 25% nuclear, 52% fossil. Overall we<br />
characterize Vattenfall as a relatively low-cyclical company amongst the Nordic<br />
industrials. Furthermore, the group enjoys a credit positive natural hedge from its<br />
Nordic hydro assets with capacity inversely correlated to power prices, all other<br />
things equal. The joint hydro-nuclear portfolio constitutes a low variable cost production<br />
base that benefits particularly when fossil fuel and CO2 emission prices are high.<br />
In Germany, Vattenfall also enjoys some degree of fossil-fuel price volatility immunity<br />
as it produces its input fuels for its Eastern Germany based lignite fuelled plants<br />
through its own neighbouring mines. Vattenfall secures roughly one fifth of its earnings<br />
from regulated distribution and heating assets, which traditionally yields rather<br />
predictable cash flows. A further credit-stabilising feature comes from Vattenfall’s<br />
power price hedging, which yields low short-run earnings volatility. For 2011 some<br />
74% of generated power was hedged at EUR45/MWh in Sweden and 98% hedged at<br />
EUR55/MWh in Germany.<br />
Strategy changed from focus on growth to focus on core markets<br />
In the past couple of years M&A has been high on Vattenfall’s agenda culminating<br />
with the acquisition of Dutch Nuon for an enterprise value of EUR8.5bn. In September<br />
Vattenfall updated its strategic plans for the coming years indicating that going<br />
forward it would focus the group. In that connection Vattenfall stated that its coremarkets<br />
are Sweden, Germany and the Netherlands. Vattenfall’s exposure to other<br />
markets will be reduced in the years to come through various asset sales. Asset sales<br />
in the core markets should not be expected with minority stakes being the exception.<br />
Vattenfall further stated that it would not invest in new coal capacity until adequate<br />
CCS (carbon capture and storage) technology is in place. The new strategic plan also<br />
implies a cost-rationalization programme where Vattenfall seeks to reduce its OPEX<br />
by 11% or SEK6bn per year (fully implemented by 2014). This should be done<br />
through head-count reductions and efficiency measures.<br />
206 | 13 April 2011<br />
BUY<br />
Sector: Utility, Electric Utility<br />
Corporate ticker: VATFAL<br />
Equity ticker: VATT SS<br />
Market cap: Not listed<br />
Ratings:<br />
S&P rating: A / NO<br />
Moodys rating: A2 / S<br />
Fitch rating: A+ / NO<br />
Analyst:<br />
Jakob Magnussen, CFA<br />
jakob.magnussen@danskebank.dk<br />
+45 45 128503<br />
Louis Landeman<br />
louis.landeman@danskebank.com<br />
+46 8 568 80524<br />
Key credit issues<br />
Strengths:<br />
• Leading utility in Europe in terms<br />
of size<br />
• Focus on financial leverage reductions<br />
• Non-core asset sales and cost<br />
cutting on managements agenda<br />
• Strong diversification across regions<br />
and generation mix<br />
Challenges:<br />
• Relatively high financial leverage<br />
after Nuon acquisition<br />
• Bearish outlook on medium to long<br />
term power prices<br />
• Exposure to volatile power prices<br />
and CO2 allowance prices<br />
• Risk of Swedish state reducing its<br />
ownership which could imply a one<br />
notch downgrade<br />
Source: <strong>Danske</strong> Markets<br />
www.danskeresearch.com
<strong>Scandi</strong> Handbook<br />
Liquidity<br />
Strength of liquidity profile is not clear cut<br />
We see Vattenfall’s liquidity position as mildly stretched. In its 2010 report Vattenfall<br />
showed cash & equivalents of SEK39.2bn hardly covering some SEK34.7bn in short term<br />
debt maturities and a planned SEK6.5bn dividend payment in 2011. Vattenfall guides for<br />
some SEK42bn in capex in 2011. Whether this can be covered by cash flow generation in<br />
2011 is not a given. In 2010 Vattenfall generated some SEK41.1bn in cash flow from operations.<br />
While these numbers point to a relatively high risk of primary issuance in 2011, we<br />
stress that cash raised in connection with Vattenfall’s asset disposal ambitions in 2011 is<br />
likely to make prefunding less imminent. That said, we would certainly not rule out Vattenfall<br />
as an opportunistic issuer in 2011 although we take some comfort in a relatively small<br />
chunk of debt maturities in 2012. In Q1 2011 Vattenfall secured a 5-year revolving credit<br />
facility of EUR2.55bn adding to committed facilities of SEK16bn at end Q4.<br />
Current performance drivers<br />
Vattenfall delivered a strong Q4 2010<br />
In Q4 Vattenfall continued its stream of solid quarterly reports from a credit perspective.<br />
A solid Group Q4 power generation of 46.4TWh (up 6.7% y/y) was offset by a rising<br />
SEK and lost revenues from the divested German transmission grid. This caused Group<br />
revenues to fall 15% y/y. A strong focus on cost rationalisations was able to offset the lost<br />
revenue and yielded an unchanged EBITDA y/y. In January 2011 Vattenfall announced<br />
that it would take a Q4 2010 SEK4.3bn impairment charge on its Nuon investment. This<br />
was partly offset by a SEK1.3bn reversal on a previous impairment on Vattenfall’s divested<br />
German transmission grid. These effects caused head-line EBIT to drop 12% y/y.<br />
Excluding the impairments and other items affecting comparability, Vattenfall delivered a<br />
7% increase in EBIT. Group Q4 net income surged 17% partly due to a lower debt base.<br />
Vattenfall’s earnings are still handicapped by the loss of income from its partial ownership<br />
in its two German nuclear plants Krümmel and Brunsbüttel. In Q4 the foregone<br />
earnings are estimated to be SEK1.5bn. Currently the Krümmel and Brunsbüttel plants are<br />
among those seven German nuclear plants that have been chosen for a temporarily threemonth<br />
outage for security checks in the wake of the Fukushima nuclear incident. Several<br />
German politicians are currently suggesting that in the interest of public safety, these<br />
seven plants should never be reopened. Furthermore it is right now being debated whether<br />
the previously proposed nuclear lifetime extension in Germany should be abandoned. If<br />
this happens it will be interesting to see if the proposed German Nuclear tax, which is<br />
expected to weigh by some EUR165m in 2011 on Vattenfall will also be abandoned.<br />
From a credit perspective, one could argue that a closure of Krümmel and Brunsbüttel<br />
could be perceived as a positive if the compensation is adequate. The argument behind<br />
this is that cash on the balance sheet would be preferable relative to two assets notoriously<br />
known for unplanned outages (both have been out of service since 2007).<br />
Net debt and metrics improved to levels in line with the current rating<br />
In Q4 Vattenfall’s net debt position fell 8% sequentially to SEK144.4bn. On an adjusted<br />
basis we see this number at SEK190.9bn. This yields an adjusted net debt to EBITDA<br />
figure of 3x marking an improvement of 0.1x sequentially. Adjusted FFO to net debt<br />
improved 0.5%-point q/q to 21.9%. The Interest coverage trigger ratio which, as defined<br />
in Vattenfall’s hybrid prospectus, must be above 2.5x before its hybrid is obliged to cancel<br />
coupons, stood at comforting 7x (up from 6.2x in Q3 10).<br />
Financial targets reiterated in connection with the new strategic plan<br />
In the 2010 presentation, the CEO repeated that the current debt level in Vattenfall is<br />
too high. Apart from non-core asset sales, this will be resolved through capex budget<br />
cuts. In this context Vattenfall has reduced its 2011-2015 capex budget to SEK165bn<br />
from SEK201bn. The group maintains its financial targets, targeting a ROE of 15%<br />
(10% in 2010), CFO interest coverage of 3.5-4.5x (4.6x in 2010), a credit rating in<br />
the single ‘A’ category (Currently A2 S/A NO) and a dividend payout policy of 40-<br />
Debt maturity profile at end 2010<br />
SEKbn<br />
35<br />
30<br />
25<br />
20<br />
15<br />
10<br />
5<br />
0<br />
Source: Company data and <strong>Danske</strong> Markets<br />
Profitability<br />
SEKm<br />
250,000<br />
200,000<br />
150,000<br />
100,000<br />
50,000<br />
0<br />
Source: Company data and <strong>Danske</strong> Markets<br />
LTM EBIT by segments (2010)<br />
Benelux<br />
0%<br />
Source: Company data and <strong>Danske</strong> Markets<br />
Debt metrics<br />
SEKm<br />
180,000<br />
160,000<br />
140,000<br />
120,000<br />
100,000<br />
80,000<br />
60,000<br />
40,000<br />
20,000<br />
0<br />
Central<br />
Europe<br />
34%<br />
Hybrid bond<br />
2006 2007 2008 2009 2010<br />
Source: Company data and <strong>Danske</strong> Markets<br />
35%<br />
30%<br />
25%<br />
20%<br />
15%<br />
10%<br />
5%<br />
0%<br />
Net sales EBITDA EBITDA-margin (rhs)<br />
Supply &<br />
Trading<br />
13%<br />
Pan Europe<br />
(Nuclear,<br />
Wind)<br />
12%<br />
Nordic<br />
41%<br />
2006 2007 2008 2009 2010<br />
Net debt Equity Net debt/EBITDA (rhs)<br />
3.5x<br />
3.0x<br />
2.5x<br />
2.0x<br />
1.5x<br />
1.0x<br />
0.5x<br />
0.0x<br />
207 | 13 April 2011<br />
www.danskeresearch.com
<strong>Scandi</strong> Handbook<br />
60% (50% for 2010). This will further be facilitated through efficiency measures<br />
aimed at reducing operating costs by SEK6bn annually by 2014.<br />
Rating downgrade should be off the table following focus on deleveraging<br />
Vattenfall's Q4 2010 adj. LTM FFO/net debt of 22% should be in line with the minimum<br />
requirement for the current ‘A’ rating at S&P. In November 2010 S&P repeated<br />
its ‘A’ rating with a negative outlook fearing that squeezed margins and a high capex<br />
budget could hamper free cash flow generation while also recognizing that Vattenfall’s<br />
asset disposal programme could strengthen the Group’s debt protection measures. We<br />
expect rating pressure to fade in the quarters to come. Furthermore, we see good shortterm<br />
momentum from relatively high power prices driven by rising demand and<br />
commodities prices. We note though, that Vattenfall is only committed to a low-‘A’<br />
rating. As such a downgrade would be acceptable from both Moody’s and S&P.<br />
Currently Moody’s rates Vattenfall at A2 with stable outlook.<br />
Regulation plays a significant role for Vattenfall<br />
Vattenfall continues to face regulatory headwinds. We have seen tax increases on<br />
hydro property and nuclear capacity in Sweden. Current debates in the EU and Sweden<br />
point to a healthy rise in nuclear liabilities damages, impacting the whole industry.<br />
In Germany the government has imposed a nuclear tax for a total of EUR2.3bn<br />
for the industry. This will impact Vattenfall with a net loss of SEK2bn, pending on<br />
the resumption of operations of its German nuclear plants. Furthermore, Vattenfall is<br />
at risk of having its two partly-owned nuclear power plants shut down, compensation<br />
for which is very uncertain. On the positive side, regulation secures a steady source<br />
of income on monopoly-like operations such as distribution and heat. Going forward<br />
we fear that the regulatory environment will get tougher as excess profits in utilities<br />
are a politically feasible funding source for ailing government budgets. As the various<br />
nations are quite dependent on a well-functioning utilities sector, we believe that<br />
the extent of cash-drainage from utilities is likely to be done in a prudent manner,<br />
securing liquidity to fund necessary investments and financial stability.<br />
Vattenfall is still a candidate for partial divestment<br />
The Swedish election mid September secured the right-wing parties, who favour a<br />
partial divestment of Vattenfall, another four years. They only won a minority governmental<br />
seat, implying that they have to secure back-up for the Vattenfall divestment<br />
with competing parties. The majority of the opposition has recently made a<br />
statement opposing privatisation of Vattenfall, but one party, which could create a<br />
majority in favour of partial divestment, still remains to state its attitude in the matter.<br />
Although the prospect of a partial divestment of Vattenfall is negative, we stress<br />
that Sweden will remain a majority shareholder. Subsequently we believe that the<br />
support assumptions could be intact and hence that Vattenfall will retain its one notch<br />
uplift from rating agencies due to government support. Timing of a divestment is<br />
highly uncertain and depends on general market conditions.<br />
Recommendation<br />
We view Vattenfall as a strong and improving Nordic utility from a credit perspective.<br />
The developments of Nuon’s profitability, continued focus on cost rationalisations,<br />
asset sales and capex budget reduction will lead to further improvement of Vattenfall’s<br />
metrics in our view. We expect that Vattenfall will have its negative outlook removed<br />
by S&P in 2011. We believe that Vattenfall management will continue to run the<br />
company in a more defensive manner, as opposed to previous management which<br />
was heavily scrutinized by public opinion and politicians for increasing the business<br />
risk in Vattenfall through investments in fossil-fuelled assets in the Netherlands. We<br />
continue to see value in Vattenfall and maintain our Buy rating, preferring the 14’s<br />
and 19’s (see list of instrument prices at the end of this book).<br />
208 | 13 April 2011<br />
www.danskeresearch.com
<strong>Scandi</strong> Handbook<br />
Financial data Vattenfall<br />
Key figures (SEKm) 2006 2007 2008 2009 2010<br />
Net Sales 135,802 143,639 164,549 205,407 213,572<br />
EBITDA 43,938 45,821 45,960 51,777 60,706<br />
EBIT 27,448 28,583 29,895 27,938 29,853<br />
Net interest expenses 27,448 28,583 29,895 27,938 29,853<br />
Net profit 19,858 20,686 17,763 13,448 13,185<br />
FFO [1] 29,781 26,442 22,669 29,720 34,797<br />
Capex [2] 16,387 18,964 42,296 102,989 41,794<br />
FCF [3] 18,820 13,367 -6,102 -56,743 -563<br />
RCF [4] 29,781 26,442 22,669 29,720 34,797<br />
Net Debt [5] 56,941 56,626 74,579 156,554 144,404<br />
Adjusted Net debt [6] 85,965 76,085 103,842 195,897 186,393<br />
Total Debt 71,575 67,189 107,347 213,494 188,277<br />
Equity 107,674 124,132 140,886 142,404 133,621<br />
Ratios<br />
EBITDA margin 32% 32% 28% 25% 28%<br />
Net debt / EBITDA 1.3x 1.2x 1.6x 3.0x 2.4x<br />
Adjusted net debt / EBITDA 1.9x 1.6x 2.2x 3.7x 3.0x<br />
Adjusted FFO interest coverage 11.5x 11.0x 8.1x 5.2x 6.7x<br />
Adjusted FFO/net debt 42% 46% 30% 19% 22%<br />
Adjusted RCF/debt 30% 31% 17% 12% 15%<br />
Adjusted debt/total capital 48% 41% 49% 64% 63%<br />
(1) Cash flow from operating activities before changes in working capital. (2) Investments in tangible assets. (3) Cash flow from operating activities less capex. (4)<br />
Cash flow from operating activities less dividends but before changes in working capital. (5) Total interest-bearing debt less cash and marketable securities. (6) Net<br />
debt adjusted for contingent liabilities/contractual obligations, pension liabilities and debt in subsidiaries, which are not wholly owned and operating leases. Source:<br />
Company data and <strong>Danske</strong> Fixed Income Credit Research<br />
Quarterly review (SEKm)<br />
Q4 09 Q1 10 Q2 10 Q3 10 Q4 10<br />
Net sales 65,405 70,657 49,713 37,665 55,537<br />
EBITDA 15,360 20,799 13,867 10,685 15,355<br />
EBITDA margin 23% 29% 28% 28% 28%<br />
Net income 2,110 3,787 5,185 1,749 2,464<br />
Net debt 156,554 167,398 152,893 145,489 144,404<br />
Net debt/LTM EBITDA 3.0x 3.0x 2.6x 2.4x 2.4x<br />
Divisional quarterly overview (SEKm)<br />
PRIMARY SEGMENTS Q4 09 Q1 10 Q2 10 Q3 10 Q4 10<br />
Business Group Nordic Net sales 11,736 12,618 10,215 9,639 13,176<br />
EBIT 3,346 6,592 2,964 2,516 4,726<br />
Business Group Central Europe Net sales 44,489 44,751 33,611 16,650 29,727<br />
EBIT 4,715 5,399 3,622 2,548 2,086<br />
Business Group Pan Europe Net sales 5,488 5,399 6,358 2,018 7,217<br />
EBIT 230 995 2,228 621 987<br />
Business Group Benelux Net sales 14,842 16,333 9,398 6,792 15,058<br />
EBIT 168 162 -195 -403 112<br />
Supply & Trading Net sales 26,319 22,413 18,589 2,652 26,885<br />
EBIT 1,166 2,164 824 624 1,488<br />
Source: Company data and <strong>Danske</strong> Markets<br />
209 | 13 April 2011<br />
www.danskeresearch.com
<strong>Scandi</strong> Handbook<br />
Vestas<br />
Company overview<br />
Danish-based Vestas Wind Systems A/S was redefined in 1986 as a pure wind power<br />
company. Vestas is the global market leader in wind turbines. With more than 23,000<br />
employees, the group is active in development, production, operation and maintenance<br />
of wind technology. With wind technology being the sole business area, Vestas’ product<br />
diversification is very narrow. However, this is partly offset by strong geographical<br />
diversification, with presence in a broad host of countries spread across the globe.<br />
Vestas produces a large part of its components itself at production facilities with close<br />
proximity to the factories. This reduces reliance on sub-suppliers and transportation<br />
costs. Vestas is one of the leaders of the wind segment in terms of technology. The<br />
group offers turbine capacity of up to 3MW and expects to offer turbines with up to<br />
7MW in the near future. Vestas is well positioned in terms of cost per capacity, which<br />
we see as a vital competitive edge in an increasingly tough marketplace for wind technology.<br />
Vestas’ shares are in free float with the largest shareholder owning some 5%.<br />
Vestas is not rated by any of the rating agencies, but we see it as a ‘BBB-’ entity on<br />
senior unsecured level.<br />
Key credit considerations<br />
Market leader in a competitive environment<br />
According to BTM Consult, Vestas is the global leader in wind power technology,<br />
with a 2010 market share of 14.8% followed by Chinese Sinovel (11.1%), US-based<br />
GE Wind (9.6%) and Chinese Goldwin (8.5%). The fast rise of several Asian windturbine<br />
producers previously had a negative impact on Vestas’ market share, as evidenced<br />
by a drop in Vestas’ global market share of 7.4 percentage points (pp) from<br />
2008 to 2009. However, as a result of a strong 2010 order book, Vestas reclaimed<br />
some 2.3pp, landing at the current 14.8% market share. In both China and the US<br />
market, there has been tremendous order growth in 2010. According to AWEA,<br />
Vestas’ market share in terms of installations in the US has dropped to 4.3% in 2010<br />
from 15% in 2009. However, a high US order intake in 2010 is likely to boost Vestas’<br />
market share in the US going forward. Vestas’ ability to defend its marketleading<br />
position is founded on its strong track record of delivering high-quality, lowcost<br />
wind turbines. Vestas expects strong growth in the offshore wind segment in<br />
which it holds an accumulated market share of 45% (40% in 2009). This market,<br />
however, only comprises some 3% of Vestas’ total delivered installed capacity (2%<br />
in 2009). However, as appropriate onshore locations for wind turbines are becoming<br />
increasingly scarce and as the achieved load factors are higher offshore, we expect<br />
the offshore market to grow significantly in importance in the coming years.<br />
Macro themes support Vestas business<br />
Being a non-CO2 emitting power generation technology provider, Vestas is comfortably<br />
aligned with the current public focus on CO2’s linkage to man-made climate<br />
change. In spite of the economic crisis, we still believe there is global political will to<br />
increase the price of CO2 emissions. Another important determinant of overall wind<br />
turbine demand is the price of fuel for competing power-generation technologies. As<br />
gas and coal prices increase, wind power becomes more attractive in terms of cost<br />
per MWh. While rising prices in the fuels commodities markets are positive for Vestas,<br />
rising commodities prices in the metals markets hurt group margins, as wind<br />
turbine components are produced from various metals. Finally, the Fukushima nuclear<br />
crisis is likely to dampen global demand from new nuclear capacity going forward.<br />
In some countries it even seems likely that current capacity could be reduced<br />
as a consequence of nuclear fears. This is obviously a positive theme for the windsector,<br />
being a supplier of a safe and clean power generation technology. The crisis is<br />
still unfolding, and it is still very uncertain what the final outcome in terms of policy<br />
response will be.<br />
210 | 13 April 2011<br />
SELL<br />
Sector: Industrials, Capital Goods<br />
Corporate ticker: VWSDC<br />
Equity ticker: VWS DC<br />
Market cap: DKK41.3bn<br />
Ratings:<br />
S&P rating: NR<br />
Moodys rating: NR<br />
Fitchs rating: NR<br />
Analyst:<br />
Jakob Magnussen, CFA<br />
Jakob.magnussen@danskebank.dk<br />
+45 45 128503<br />
Asbjørn Purup Anderen<br />
Asbjorn.andersen@danskebank.dk<br />
+45 45 148886<br />
Key credit issues<br />
Strengths:<br />
• Market leader in wind technology.<br />
• Proven track record of cost efficiency<br />
and innovation<br />
• Solid debt metrics, albeit declining<br />
in quality<br />
• Global diversification<br />
Challenges:<br />
• Declining credit quality on the back<br />
of high capex budget<br />
• Subsidy-dependant industry<br />
• Tough competition and high technological<br />
risks in wind-energy<br />
segment<br />
• Q1 order intake not satisfactory<br />
Source: <strong>Danske</strong> Markets<br />
www.danskeresearch.com
<strong>Scandi</strong> Handbook<br />
Liquidity<br />
Vestas’ short-term liquidity profile is very dependent on its cash generating abilities in<br />
2011. On the back of a strong order intake in 2010, in our view it is likely that we will<br />
see a dramatic improvement in cash flow from operations, as turbines ordered in 2010<br />
are installed and delivered with subsequent cash payment. Vestas guides for FOCF in<br />
2011 of around zero, marking a significant improvement from the negative FOCF of<br />
EUR730m seen in 2010. Following capex guidance of EUR850 in 2011, we think that<br />
the implied operating cash flow guidance of EUR850m looks rather ambitious, though.<br />
After 2010 Vestas’ reported cash and equivalents stood at EUR335m. Vestas also has<br />
access to committed credit facilities, the size of which it doesn’t disclose. These items<br />
easily cover short term debt maturities of EUR4m in 2011. Vestas doesn’t expect to pay<br />
out any dividends for 2011. Overall Vestas’ liquidity situation is contingent on a strong<br />
cash generation in 2011. Should Vestas disappoint in this, it is very likely that we will<br />
see the Group in the primary market in 2011.<br />
Current performance drivers<br />
2010 report a mixed bag clouded by accounting principle change<br />
On the back of increased investment activity from global utilities, Vestas was able to<br />
deliver a full year increase in revenues of 36% y/y. The European and Asian markets<br />
performed especially well with y/y top-line growth of 30% and 120%, respectively.<br />
In 2010, Vestas also reported a good order intake from the US, but these will not be<br />
booked until 2011 and 2012 when they are delivered. In Q4, Vestas changed its accounting<br />
principle, delaying revenue recognition on delivery and installation projects,<br />
making quarterly EBITDA comparisons difficult. The shift in earnings recognition<br />
made 2010 look relatively strong compared with 2009, which helped Vestas report<br />
59% growth in EBITDA y/y. It reported an EBITDA margin of 10.8% in 2010 up<br />
1.6pp y/y. However, we caution that the improved profitability is mostly a reflection<br />
of an increased capacity utilisation from a rather generous point of departure. Going<br />
forward, we fear that rising component costs and very tough competition fuelled by<br />
aggressive price undercutting by among others, Chinese turbine manufacturers, will<br />
lead to profitability erosion. This fear is partly mitigated by an upward trend in realised<br />
price per MWh in Vestas’ order book during 2010. For Q4, Vestas states that it<br />
achieved an average price in excess of EUR1.2m compared with just over EUR1m in<br />
Q1. However, for 2010 as a whole, the average price fell 5% y/y.<br />
Credit metrics<br />
In 2010, a relatively strong FFO of EUR409m was offset by increased working capital<br />
and a continued high capex level, which left the Group’s free operating cash flow<br />
at a negative EUR730m. This resulted in Vestas going from having net cash of<br />
EUR137m in 2009 to having a net debt position of EUR579m after 2010. Relative to<br />
Q3 10, this marks a net debt reduction of EUR148m. On an adjusted basis we see the<br />
net debt at EUR767m, translating into an adjusted net debt to EBITDA figure of 1x<br />
vs zero after 2009. Adjusted net debt to total capital stood at 22% after 2010 vs 0.3%<br />
after 2009.<br />
Subsidy dependant business<br />
In spite of a declining trend on the cost per MWh over the past decade, the price of<br />
producing power using wind turbines is still not competitive with other more established<br />
power generation methods. Generally the various politicians’ rhetoric around<br />
carbon emission reductions points to a strong willingness to support green industries<br />
like the wind power industry, offering subsidy schemes that make it attractive to<br />
invest in wind turbines. However, there is a potential risk of governments reducing or<br />
eliminating subsidies in the future. The current budget difficulties in southern Europe<br />
underline this risk as evidenced by Spain, which has temporarily backed down from<br />
incentives for wind turbine investments to defend its stressed public budget.<br />
Debt maturity profile<br />
EURm<br />
1,000<br />
900<br />
800<br />
700<br />
600<br />
500<br />
400<br />
300<br />
200<br />
100<br />
0<br />
Source: <strong>Danske</strong> Markets & Company data.<br />
Profitability<br />
EURm<br />
8000<br />
7000<br />
6000<br />
5000<br />
4000<br />
3000<br />
2000<br />
1000<br />
0<br />
Source: Company data, <strong>Danske</strong> Markets<br />
Revenues by segment, 2010<br />
Asia/Pacific<br />
16%<br />
Americas<br />
24%<br />
Source: Company data, <strong>Danske</strong> Markets<br />
Debt metrics<br />
EURm<br />
3,000<br />
2,500<br />
2,000<br />
1,500<br />
1,000<br />
500<br />
0<br />
-500<br />
-1,000<br />
5 years<br />
Source: Company data, <strong>Danske</strong> Markets<br />
14%<br />
12%<br />
10%<br />
8%<br />
6%<br />
4%<br />
2%<br />
0%<br />
2006 2007 2008 2009 2010<br />
Net sales EBITDA EBITDA margin (rhs)<br />
Production<br />
units<br />
0%<br />
2006 2007 2008 2009 2010<br />
Europe/<br />
Africa<br />
60%<br />
X<br />
1<br />
Net debt Equity Net debt/EBITDA (rhs)<br />
0.5<br />
0<br />
-0.5<br />
-1<br />
-1.5<br />
-2<br />
211 | 13 April 2011<br />
www.danskeresearch.com
<strong>Scandi</strong> Handbook<br />
Also, should future scientific research point to no causality between global climate<br />
change and industrially released CO2 gases, this could lead to public pressure to<br />
reduce green subsidies in an effort to lower power bills. Should government subsidies<br />
be reduced or removed, it would be seriously credit negative, as the incentive to<br />
choose wind technology over cheaper fossil-based technologies would fade.<br />
High technological risk<br />
The changing order of merit over time in terms of cost/MW and CO2 emission profile<br />
carries an inherent obsolescence risk for generation capacity producers. As Vestas<br />
carries a one stringed technology exposure it is, in our view, highly exposed to<br />
this risk. Potential new technologies include solar, tidal, pellet, geothermic, biomass,<br />
osmotic and CCS. None of these technologies are currently economically self sustaining,<br />
but with extensive research in the area, we see a clear medium- to long-term<br />
risk of an emergence of ‘better’ technologies.<br />
2011 guidance<br />
Vestas guidance for 2011 targets full year sales of EUR7bn. The Group repeated its<br />
EBIT margin guidance of 7% excluding restructuring costs, which is almost in line<br />
with the 6.8% margin achieved in 2010. Order intake guidance was repeated at 7-<br />
8GW. Fulfilment of this target got off to a slow start with only 338MW of announced<br />
orders in Q1. The big question mark is: how much margin contribution will the new<br />
turbines yield? From a credit perspective, Vestas’ 2011 guidance was disappointing.<br />
The Group hiked its capex guidance by EUR150m and is now targeting EUR850m.<br />
In spite of this, Vestas targets free cash flow around zero in 2011. Vestas also shed<br />
some additional light on its financial policy, stating that its net debt to EBITDA<br />
should not exceed 2x. With this metric currently at 0.8x (unadjusted), Vestas has<br />
additional room to lever up its balance sheet, which is obviously a concern from a<br />
credit perspective.<br />
Financial policies and indicative rating<br />
Vestas’ policy is to pay dividends of 25-30% of the profit for the year. However, the<br />
distribution of dividends is always decided once consideration has been given to the<br />
Group’s plans for growth and liquidity. The Group has not paid any dividends since<br />
2003 and it does not have a public rating. We believe Vestas’ market-leading position,<br />
strong geographical diversification and cutting-edge technology in a booming market<br />
are offset by a narrow product focus with a product characterised by high competition<br />
and high political and technological risk. When summarising Vestas’ business<br />
risk and financial risk profiles, we arrive at a ‘BBB-’ rating at the senior unsecured<br />
level.<br />
Recommendation<br />
We continue to maintain a fundamentally bearish long-term view on Vestas rooted in<br />
high political risks fuelled by ailing government budgets threatening the future levels of<br />
green energy subsidies. Furthermore, competition and component costs are on the rise,<br />
threatening the margins of the Group. In the longer term, competition and technological<br />
leaps mark a more fundamental challenge to Vestas with its very narrow product diversification.<br />
On a short-term basis, Vestas’ mixed 2011 outlook from a credit perspective<br />
combined with deteriorated y/y credit metrics gives further fuel to our negative stance<br />
on the name. We highlight that the current strong momentum of fossil fuel prices and<br />
the developing story in Fukushima could be a positive short-term driver, making wind<br />
relatively more attractive relative to conventional generation technologies.<br />
Vestas order intake<br />
MW<br />
3,500<br />
3,000<br />
2,500<br />
2,000<br />
1,500<br />
1,000<br />
500<br />
0<br />
Q1<br />
09<br />
Q2<br />
09<br />
Q3<br />
09<br />
Q4<br />
09<br />
Q1<br />
10<br />
Announced orders<br />
Required to meet guidance<br />
Q2<br />
10<br />
Q3<br />
10<br />
Q4<br />
10<br />
Q1<br />
11<br />
Source: Company data, <strong>Danske</strong> Markets<br />
Q2<br />
11<br />
Unanounced orders<br />
Q3<br />
11<br />
Q4<br />
11<br />
While the level of the Vestas’ 2015 bond currently trades favourably compared with<br />
‘BBB-’ rated industrials in the ASW+147 area, we still see medium-term downside<br />
risks as being above average for the rating category. Combining this with the illiquid<br />
nature of the bonds in combination with new issuance risk, we maintain our current Sell<br />
recommendation. (see list of instrument prices at the end of this book).<br />
212 | 13 April 2011<br />
www.danskeresearch.com
<strong>Scandi</strong> Handbook<br />
Financial data Vestas<br />
Key figures (EURm) 2006 2007 2008 2009 2010<br />
Net Sales 4,179 3,828 5,904 5,079 6,920<br />
EBITDA 331 338 749 469 747<br />
EBIT 204 202 614 251 310<br />
Net interest expenses 40 0 -46 48 72<br />
Net profit 113 104 470 125 156<br />
FFO [1] 76 594 768 357 409<br />
Capex [2] 153 265 509 833 786<br />
FCF [3] 444 436 -232 -867 -730<br />
RCF [4] 76 594 768 357 409<br />
Net Debt [5] -270 -614 -39 -137 579<br />
Adjusted Net debt [6] -254 -512 117 7 767<br />
Total Debt 174 150 123 351 914<br />
Equity 1,262 1,516 1,587 2,542 2,754<br />
Ratios<br />
EBITDA margin 8% 9% 13% 9% 11%<br />
Net debt / EBITDA -0.8x -1.8x -0.1x -0.3x 0.8x<br />
Adjusted net debt / EBITDA -0.8x -1.5x 0.1x 0.0x 1.0x<br />
Adjusted FFO interest coverage 1.7x 26.9x 40.1x 5.2x 4.3x<br />
Adjusted FFO/net debt -0.3x -1.2x 6.8x 55.3x 0.6x<br />
Adjusted RCF/net debt -0.3x -1.1x 6.8x 55.2x 0.6x<br />
Adjusted debt/total capital -25% -51% 7% 0% 22%<br />
1) Cash flow from operating activities before changes in working capital. 2) Investments in tangible assets. 3) Cash flow from operating activities less capex. 4) Cash<br />
flow from operating activities less dividends but before changes in working capital. 5) Total interest-bearing debt less cash and marketable securities. 6) Net debt<br />
adjusted for contingent liabilities/contractual obligations, pension liabilities and debt in subsidiaries, which are not wholly owned and operating leases. Source:<br />
Company Data and <strong>Danske</strong> Fixed Income Credit Research<br />
Quarterly review (EURm)<br />
Q4 09 Q1 10 Q2 10 Q3 10 Q4 10<br />
Net sales 1,474 849 1,032 1,916 3,123<br />
EBITDA -85 13 -101 342 493<br />
EBITDA margin (%) 5% 7% 1% 0% 7%<br />
Net income -70 -39 -143 187 151<br />
Net debt -137 404 896 727 579<br />
Net debt/LTM EBITDA -0.3x 1.1x 6.7x 4.3x 0.8x<br />
Source: Company data and <strong>Danske</strong> Markets<br />
Divisional quarterly overview (EURm)<br />
Q4 09 Q1 10 Q2 10 Q3 10 Q4 10<br />
Europe Net sales 1,113 455 486 678 2,537<br />
EBIT 35 8 36 13 113<br />
EBIT-margin 3% 2% 7% 2% 4%<br />
Americas Net sales 350 138 418 753 317<br />
EBIT -3 -3 2 36 14<br />
EBIT-margin -1% -2% 0% 5% 4%<br />
Asia/Pacific Net sales 441 162 100 289 581<br />
EBIT -16 -6 -16 -21 -40<br />
EBIT-margin -4% -4% -16% -7% -7%<br />
Source: Company data and <strong>Danske</strong> Markets<br />
213 | 13 April 2011<br />
www.danskeresearch.com
<strong>Scandi</strong> Handbook<br />
214 | 13 April 2011<br />
www.danskeresearch.com
<strong>Scandi</strong> Handbook<br />
Appendix<br />
215 | 13 April 2011<br />
www.danskeresearch.com
<strong>Scandi</strong> Handbook<br />
Instrument price list - Financials<br />
Comparable EUR issues<br />
Name Ticker Collat. Coupon Maturity Call Rating Indicative ASW or DM offer<br />
<strong>Danske</strong> <strong>Bank</strong> DANBNK Senior 4.75 04/06/2014 A1/A/A+ + 78<br />
<strong>Danske</strong> <strong>Bank</strong> DANBNK Senior FRN 16/09/2013 A1/A/A+ + 45<br />
<strong>Danske</strong> <strong>Bank</strong> DANBNK T1 4.878 15/05/2049 2017 Baa3/BB+/A- + 247<br />
DnB NOR DNBNOR Senior 4.5 29/05/2014 Aa3/A+/A+ + 43<br />
DnB NOR DNBNOR Senior FRN 16/01/2014 Aa3/A+/A+ +36<br />
DnB NOR DNBNOR LT2 FRN 30/05/2017 2012 A1/A/A +55<br />
DnB NOR DNBNOR T1 7.068 19/11/2049 2012 Baa3/BBB+/NR + 163<br />
Handelsbanken SHBASS Senior 4.875 25/03/2014 Aa2/AA-/AA- + 30<br />
Handelsbanken SHBASS Senior FRN 14/01/2013 Aa2/AA-/AA- + 18<br />
Handelsbanken SHBASS LT2 FRN 19/10/2017 2012 Aa3/A+/A+ + 70<br />
Handelsbanken SHBASS T1 4.194 16/12/2049 2015 Baa2/A-/A +197<br />
Jyske <strong>Bank</strong> JYBC Senior FRN 04/04/2012 A1/A/NR + 45<br />
Nordea NBHSS Senior 4.5 12/05/2014 Aa2/AA-/AA- + 54<br />
Nordea NBHSS Senior FRN 10/12/2012 Aa2/AA-/AA- + 20<br />
Nordea NBHSS T1 8.375 25/03/2049 2015 Baa2/A-/A + 353<br />
Nykredit <strong>Bank</strong> NYKRE Senior FRN 11/03/2013 A1/A+/NR + 82<br />
Nykredit Realkredit NYKRE T1 4.901 22/09/2049 2014 Baa1/NR/NR + 300<br />
Pohjola <strong>Bank</strong> POHBK Senior 4.5 22/05/2014 Aa2/AA-/AA- + 60<br />
Pohjola <strong>Bank</strong> POHBK Senior FRN 25/02/2013 Aa2/AA-/AA- + 26<br />
Sampo Oyj SHAMPO Senior 6.339 04/10/2012 Baa2/NR/BBB + 39<br />
SBAB SBAB Senior FRN 02/03/2012 A1/A+/NR + 14<br />
SBAB SBAB Senior FRN 16/09/2013 A1/A+/NR + 51<br />
SBAB SBAB Senior 3.5 13/10/2014 A1/A+/NR + 65<br />
SEB SEB Senior 4.375 05/29/2012 A1/A/A+ + 14<br />
SEB SEB Senior 5.5 06/05/2014 A1/A/A+ + 69<br />
SEB SEB Senior FRN 21/09/2012 A1/A/A+ + 20<br />
SEB SEB LT2 FRN 28/09/2017 2012 A2/A-/A + 75<br />
SEB SEB T1 9.25 29/10/2049 2015 Ba2/BBB/A- + 370<br />
Sydbank SYDBDC Senior FRN 03/09/2012 A1/NR/NR + 86<br />
Sydbank SYDBDC T2 FRN 04/04/2015 2012 Baa1/NR/NR n.m<br />
Swedbank SWEDA Senior 3.125 04/03/2013 A2/A/NR + 52<br />
CDS Prices<br />
Bid/offer<br />
<strong>Danske</strong> <strong>Bank</strong> DANBNK Senior 5 year A1/A/A+ 102/109<br />
DnB NOR DNBNOR Senior 5 year Aa3/A+/A+ 64/71<br />
Nordea NBHSS Senior 5 year Aa2/AA-/AA- 64/69<br />
Swedbank SWEDA Senior 5 year A2/A/NR 77/87<br />
SEB SEB Senior 5 year A1/A/A+ 73/83<br />
Handelsbanken SVSKHB Senior 5 year Aa2/AA-/AA- 47/54<br />
<strong>Danske</strong> <strong>Bank</strong> DANBNK Sub 5 year Baa2/BBB/A- 143/153<br />
DnB NOR DNBNOR Sub 5 year A1/A/A 95/105<br />
Nordea NBHSS Sub 5 year Aa3/A+/A+ 96/106<br />
Swedbank SWEDA Sub 5 year A3/A-/NR 116/126<br />
SEB SEB Sub 5 year A2/A-/A 115/125<br />
Handelsbanken SVSKHB Sub 5 year Aa3/A+/A+ 80/90<br />
Note: Prices as of 11 April 2010. Source: <strong>Danske</strong> Markets<br />
216 | 13 April 2011<br />
www.danskeresearch.com
<strong>Scandi</strong> Handbook<br />
Bond Price Chart - Financials<br />
Comparable Senior Unsecured EUR issues<br />
Indicative ASW offer (bps)<br />
100<br />
80<br />
60<br />
SYDBDC '12 (NR/A1)<br />
NYKRE '13 (A+/A1)<br />
SEB '14 (A/A1)<br />
SWEDA '13 (A/A2)<br />
DANBNK '14 (A/A1)<br />
POHBK '15 (AA-/Aa2)<br />
SBAB '14 (A+/NR)<br />
SEB '15 (A/A1)<br />
NBHSS '15 (AA-/Aa2)<br />
NBHSS<br />
POHBK<br />
'14<br />
'14<br />
(AA-/Aa2)<br />
(AA-/Aa2)<br />
40<br />
20<br />
NBHSS '12 (AA-/Aa2)<br />
POHBK '12 (AA-/Aa2)<br />
DANBNK '13 (A/A1)<br />
DNBNOR '14 (A+/Aa3)<br />
DNBNOR '13 (A+/Aa3)<br />
DNBNOR '14 (A+/Aa3)<br />
SHBASS '14 (AA-/Aa2)<br />
NBHSS '13 (AA-/Aa2)<br />
DANBNK '12 (NR/A1)<br />
SHBASS '13 (AA-/Aa2)<br />
0<br />
SEB '12 (A/A1)<br />
2010 2011 2012 2013 2014 2015<br />
-20<br />
DNBNOR '12 (A+/Aa3)<br />
AAA AA+/AA/AA- A+/A/A- Not rated by S&P/Moody's<br />
Note: Prices as of 11 April 2011. Source: <strong>Danske</strong> Markets<br />
Comparable Subordinated EUR issues<br />
Indicative Z spread offer<br />
(bps)<br />
450<br />
DANBNK '17 (BB+/Baa3)<br />
400<br />
350<br />
300<br />
SEB '15 (BBB/Ba2)<br />
NYKRE '15 (BBB+/Baa1)<br />
NYKRE '14 (NR/Baa1)<br />
DANBNK '14 (BB+/Baa3)<br />
DANBNK '17 (BB+/Baa3)<br />
250<br />
DANBNK '17 (BB+/Baa3)<br />
SEB '17 (BBB/Ba2)<br />
200<br />
SHBASS '15 (A-/Baa2)<br />
DNBNOR '12 (BBB+/Baa3)<br />
150<br />
2011 2012 2013 2014 2015 2016 2017 2018<br />
AA+/AA/AA- A+/A/A- BBB+/BBB/BBB- BB+/BB/BB- Not rated by S&P/Moody's<br />
Note: Prices as of 11 April 2011. Source: <strong>Danske</strong> Markets<br />
217 | 13 April 2011<br />
www.danskeresearch.com
<strong>Scandi</strong> Handbook<br />
Instrument price list - General Industrials<br />
Comparable EUR issues<br />
Company Bond Issue rating Indicative ASW bid Indicative ASW offer<br />
ABB ABB 4.625% 06/2013 A3/A/BBB+ 40 bp 29 bp<br />
Atlas Copco ATCOA 4.750% 06/2014 A3/A/NR 24 bp 18 bp<br />
Carlsberg Breweries CARLB 6.000% 05/2014 Baa2/NR/BBB 78 bp 76 bp<br />
Carlsberg Breweries CARLB 3.375% 10/2017 Baa2/NR/BBB 90 bp 86 bp<br />
Investor INVSA 4.000% 03/2016 A1/AA/NR 59 bp 49 bp<br />
Investor INVSA 3.250% 09/2018 A1/AA/NR 71 bp 65 bp<br />
Investor INVSA 4.875% 11/2021 A1/AA/NR 85 bp 75 bp<br />
ISS Global ISSDC 4.500% 08/2014 NR/B/NR 193 bp 151 bp<br />
ISS (prev. Holding) ISSDC 8.875% 05/2016 Caa1/B/NR 466 bp 454 bp<br />
ISS Financing ISSDC 11.000% 06/2014 N/B/NR 480 bp 445 bp<br />
A.P.Moller-Maersk MAERSK 4.875% 10/2014 NR/NR/N 93 bp 89 bp<br />
A.P. Moller-Maersk MAERSK 4.375% 11/2017 NR/NR/NR 110 bp 106 bp<br />
Metso METSO 7.25% 06/2014 Baa2/BBB/NR 94 bp 88 bp<br />
Sandvik SANDVK 6.875% 02/2014 NR/BBB/NR 83 bp 77 bp<br />
Securitas SECURI 6.500% 04/2013 NR/BBB+/NR 67 bp 60 bp<br />
SKF SKF 4.250% 12/2013 A3/A/NR 38 bp 28 bp<br />
Stena AB STENA 6.125% 02/2017 Ba3/BB+/NR (Z-sprd) 380 bp (Z-sprd) 357 bp<br />
Stena AB STENA 5.875% 02/2019 Ba3/BB+/NR (Z-sprd) 409 bp (Z-sprd) 382 bp<br />
Stena AB STENA 7.875% 03/2020 Ba3/BB+/NR (Z-sprd) 438 bp (Z-sprd) 415 bp<br />
Swedish Match SWEMAT 4.625% 06/2013 Baa2/BBB/NR 57 bp 47 bp<br />
Swedish Match SWEMAT 3.875% 11/2017 Baa2/BBB/NR 90 bp 84 bp<br />
Volvo VLVY 8.000% 10/2012 Baa2/BBB/BBB (Z-sprd) 46 bp (Z-sprd) 40 bp<br />
Volvo VLVY 9.875% 02/2014 Baa2/BBB/BBB (Z-sprd) 86 bp (Z-sprd) 81 bp<br />
Volvo VLVY 5.000% 05/2017 Baa2/BBB/BBB (Z-sprd) 111 bp (Z-sprd) 105 bp<br />
Company CDS Issue rating Indicative CDS bid Indicative CDS offer<br />
ABB 5y CDS A3/A/BBB+ 61 bp 66 bp<br />
Assa Abloy 5y CDS NR/A/NR 49 bp 54 bp<br />
Atlas Copco 5y CDS A3/A/NR 49 bp 54 bp<br />
Carlsberg Breweries 5y CDS Baa2/NR/BBB 85 bp 95 bp<br />
Electrolux 5y CDS NR/BBB+/BBB 67 bp 72 bp<br />
Investor 5y CDS A1/AA/NR 57 bp 62 bp<br />
ISS Global 5y CDS NR/B/NR 145 bp 175 bp<br />
ISS (prev. Holding) 5y CDS Caa1/B/NR 160 bp 175 bp<br />
A.P. Moller-Maersk 5y CDS NR/NR/NR N/A N/A<br />
Metso 5y CDS Baa2/BBB/NR 103 bp 113 bp<br />
Sandvik 5y CDS NR/BBB/NR N/A N/A<br />
Scania 5y CDS NR/A/NR 62 bp 67 bp<br />
Securitas 5y CDS NR/BBB+/NR 80 bp 90 bp<br />
SKF 5y CDS A3/A/NR 55 bp 65 bp<br />
Stena AB 5y CDS Ba3/BB+/NR 455 bp 485 bp<br />
Swedish Match 5y CDS Baa2/BBB/NR 65 bp 70 bp<br />
Volvo 5y CDS Baa2/BBB/BBB 103 bp 108 bp<br />
Source: <strong>Danske</strong> Markets. Ratings are Moodys/Standard & Poors/ Fitch<br />
218 | 13 April 2011<br />
www.danskeresearch.com
<strong>Scandi</strong> Handbook<br />
Bond Price Charts General Industrials<br />
EUR issues - Investment Grade<br />
Indicative ASW offer (bps)<br />
120<br />
100<br />
MAERSK '17 (NR/NR)<br />
VLVY '17 (BBB-/Baa2)<br />
80<br />
METSO '14 (BBB/Baa2) MAERSK '14 (NR/NR)<br />
VLVY '14 (BBB-/Baa2)<br />
SANDVK '14 (BBB/NR) CARLB '14 (NR/Baa2)<br />
CARLB '17 (NR/Baa2)<br />
SWEMAT '17 (BBB/Baa2)<br />
INVSA '21 (AA-/A1)<br />
60<br />
SECURI '13 (BBB+/NR)<br />
INVSA '16 (AA-/A1)<br />
40<br />
20<br />
SWEMAT '13 (BBB/Baa2)<br />
VLVY '12 (BBB-/Baa2)<br />
ABB '13 (A/A3)<br />
SKF '13 (A-/A3)<br />
ATCOA '14 (A/A3)<br />
INVSA '18 (AA-/A1)<br />
0<br />
2011 2012 2013 2014 2015 2016 2017 2018 2019 2020 2021 2022<br />
AAA AA+/AA/AA- A+/A/A- BBB+/BBB/BBB- Not rated by S&P/Moody's<br />
Note: Prices as of 11 April 2011. Source: <strong>Danske</strong> Markets<br />
EUR issues - High Yield<br />
Indicative ASW offer (bps)<br />
600<br />
550<br />
NSINO '17 (B-/B2)<br />
500<br />
450<br />
400<br />
350<br />
ISSDC '14 (B/NR)<br />
ISSDC '16 (B/Caa1)<br />
STENA '17 (BB+/Ba3)<br />
STENA '19 (BB+/Ba3)<br />
STENA '20 (BB+/Ba3)<br />
300<br />
250<br />
200<br />
MESSA '13 (B-/B3)<br />
150<br />
100<br />
STERV '14 (BB/Ba2)<br />
50<br />
UPMKYM '12 (BB/Ba1)<br />
0<br />
2010 2011 2012 2013 2014 2015 2016 2017 2018 2019 2020 2021 2022<br />
BB+/BB/BB- B+/B/B- CCC+,CCC,CCC- Not rated by S&P or Moody's<br />
Note: Prices as of 11 April 2011. Source: <strong>Danske</strong> Markets<br />
219 | 13 April 2011<br />
www.danskeresearch.com
<strong>Scandi</strong> Handbook<br />
Instrument price list - Pulp & Paper<br />
Comparable EUR issues<br />
Company Bond Issue rating Indicative ASW bid Indicative ASW offer<br />
Stora Enso STERV 5.125% 2014 Ba2/BB/BB 134 bp 115 bp<br />
UPM-Kymmene UPMKYM 6.125% 2012 Ba1/BB/BB 74 bp 10 bp<br />
Norske Skog NSINO 7.000% 2017 B2/B/NR 588 bp 579 bp<br />
M-real MESSA 8.750% 2013 B3/B/NR 235 bp 209 bp<br />
Company CDS Issue rating Indicative CDS bid Indicative CDS offer<br />
Stora Enso 5Y CDS Ba2/BB/BB 210 bp 215 bp<br />
SCA 5Y CDS Baa1/BBB+/NR 63 bp 68 bp<br />
UPM-Kymmene 5Y CDS Ba1/BB/BB 215 bp 220 bp<br />
M-real 5Y CDS B3/B/NR 355 bp 365 bp<br />
Norske Skog 5Y CDS B2/B/NR 5% upfront 5.5% upfront<br />
Source: <strong>Danske</strong> Markets. Ratings are Moodys/Standard & Poors/ Fitch<br />
Bond Price Chart - Pulp & Paper<br />
EUR issues - High Yield<br />
Indicative ASW offer (bps)<br />
600<br />
550<br />
NSINO '17 (B-/B2)<br />
500<br />
450<br />
400<br />
350<br />
300<br />
250<br />
200<br />
MESSA '13 (B-/B3)<br />
150<br />
100<br />
STERV '14 (BB/Ba2)<br />
50<br />
UPMKYM '12 (BB/Ba1)<br />
0<br />
2010 2011 2012 2013 2014 2015 2016 2017 2018 2019 2020 2021 2022<br />
BB+/BB/BB- B+/B/B- CCC+,CCC,CCC- Not rated by S&P or Moody's<br />
Note: Prices as of 11 April 2011. Source: <strong>Danske</strong> Markets<br />
220 | 13 April 2011<br />
www.danskeresearch.com
<strong>Scandi</strong> Handbook<br />
Instrument price list - TMT<br />
EUR issues<br />
Issue Rating Indicative ASW offer<br />
TeliaSonera TLIASS 3.625% 2012 A3 S/ A- S/ A- S -10bp<br />
TeliaSonera TLIASS 5.125% 2014 A3 S/ A- S/ A- S 43bp<br />
TeliaSonera TLIASS 4.125% 2015 A3 S/ A- S/ A- S 46bp<br />
TeliaSonera TLIASS 4.75% 2017 A3 S/ A- S/ A- S 67bp<br />
TeliaSonera TLIASS 4.75% 2021 A3 S/ A- S/ A- S 87bp<br />
TeliaSonera TLIASS 3.875% 2025 A3 S/ A- S/ A- S 93bp<br />
Telenor TELNOR 4.5% 2014 (CoC) A3 S/A- S/BBB+ S 42bp<br />
Telenor TELNOR 4.875% 2017 A3 S/A- S/BBB+ S 71bp<br />
Telenor TELNOR 4.125% 2020 A3 S/A- S/BBB+ S 79bp<br />
TDC TDCDC 6.5% 2012 Baa2 S/ BBB S/BBB S -1bp<br />
TDC TDCDC 3.5% 2015 (CoC) Baa2 S/ BBB S/BBB S 74bp<br />
TDC TDCDC 5.875% 2015 Baa2 S/ BBB S/BBB S 107bp<br />
TDC TDCDC 4.375% 2018 (CoC) Baa2 S/ BBB S/BBB S 90<br />
Ericsson LMETEL 5% 2013 Baa1 S/BBB+ S/BBB+ S 53bp<br />
Ericsson LMETEL 5.375% 2017 Baa1 S/BBB+ S/BBB+ S 91bp<br />
Nokia NOKIA 5.5% 2014 A3 NO/A- S/BBB+ NO 68bp<br />
Nokia NOKIA 6.75% 2019 A3 NO/A- S/BBB+ NO S 114bp<br />
Elisa ELIAV 4.75% 2014 Baa2 S/ BBB S 96bp<br />
Bid/Offer<br />
TDC 5y CDS Baa2 S/ BBB S/BBB S 72/78bp<br />
Telenor 5y CDS A3 S/A- S/BBB+ S 65/68bp<br />
TeliaSonera 5y CDS A3 S/ A- S/ A- S 67/70bp<br />
Nokia 5y CDS A3 NO/A- S/BBB+ NO 113/117bp<br />
Ericsson 5y CDS Baa1 S/BBB+ S/BBB+ S 70/74bp<br />
Source: Moodys, Standard & Poors, and <strong>Danske</strong> Markets<br />
Bond Price Chart - TMT<br />
EUR issues<br />
Indicative ASW offer (bps)<br />
130<br />
120<br />
110<br />
100<br />
90<br />
80<br />
70<br />
60<br />
50<br />
40<br />
30<br />
20<br />
NOKIA '19 (A-/A3)<br />
TDCDC '15 (BBB/Baa2)<br />
ELIAV '14 (BBB/Baa2) LMETEL '17 (BBB+/Baa1)<br />
TDCDC '18 (BBB+/Baa2)<br />
TLIASS '21 (NR/A3)<br />
TELNO '20 (A-/A3)<br />
TDCDC '15 (BBB/Baa2)<br />
TELNO '17 (A-/A3)<br />
NOKIA '14 (A-/A3)<br />
TLIASS '17 (A-/A3)<br />
LMETEL '13 (BBB+/Baa1)<br />
TELNO '14 (A-/A3)<br />
TLIASS '15 (A-/A3)<br />
TLIASS '14 (A-/A3)<br />
TLIASS '25 (NR/A3)<br />
10<br />
TDCDC '12 (BBB/Baa2)<br />
0<br />
-10<br />
2011 2012 2013 2014 2015 2016 2017 2018 2019 2020 2021 2022 2023 2024 2025<br />
TLIASS '12 (A-/A3)<br />
-20<br />
AAA AA+/AA/AA- A+/A/A- BBB+/BBB/BBB- Not rated by S&P/Moody's<br />
Note: Prices as of 11 April 2011. Source: <strong>Danske</strong> Markets<br />
221 | 13 April 2011<br />
www.danskeresearch.com
<strong>Scandi</strong> Handbook<br />
Instrument price list - Utilities<br />
Comparable EUR issues<br />
Issue Rating Indicative ASW offer<br />
Fortum FRTUM 5% 2013 A2 S/A S/A S 27bp<br />
Fortum FRTUM 4.625% 2014 A2 S/A S/A S 32bp<br />
Fortum FRTUM 4.5% 2016 A2 S/A S/A S 44bp<br />
Fortum FRTUM 6% 2019 A2 S/A S/A S 68bp<br />
Vattenfall VATFAL 4.125% 2013 A2 S/A NO/A+ NO 30bp<br />
Vattenfall VATFAL 5.75% 2013 A2 S/A NO/A+ NO 35bp<br />
Vattenfall VATFAL 4.25% 2014 A2 S/A NO/A+ NO 40bp<br />
Vattenfall VATFAL 5.25% 2016 A2 S/A NO/A+ NO 51bp<br />
Vattenfall VATFAL 5% 2018 A2 S/A NO/A+ NO 67bp<br />
Vattenfall VATFAL 6.75% 2019 A2 S/A NO/A+ NO 70bp<br />
Vattenfall VATFAL 6.25% 2021 A2 S/A NO/A+ NO 63bp<br />
Vattenfall VATFAL 5.375% 2024 A2 S/A NO/A+ NO 80bp<br />
Vattenfall VATFAL 5.25% (perp.) Baa2 S/BBB NO/ A- NO 164bp (209bp*)<br />
DONG Energy DANGAS 3.5% 2012 Baa1 S/A- S/BBB+ S 21bp<br />
DONG Energy DANGAS 4.875% 2014 Baa1 S/ A- S/BBB+ S 46bp<br />
DONG Energy DANGAS 4% 2016 Baa1 S/ A- S/BBB+ S 66bp<br />
DONG Energy DANGAS 6.5% 2019 Baa1 S/ A- S/BBB+ S 91bp<br />
DONG Energy DANGAS 4.875% 2021 Baa1 S/ A- S/BBB+ S 86bp<br />
DONG Energy DANGAS 5.5% 3005 Baa3 S/ BBB S/BBB- S 188bp (234bp*)<br />
DONG Energy DANGAS 7.75% 3010 Baa2 S/ BB+ S/ BBB- S 301bp (323bp*)<br />
TVO TVO 6% 2016 NR/NR/A- S 114bp<br />
Neste Oil NESVFH 4.875% 2015 NR/NR/NR 139bp<br />
Neste Oil NESVFH 6% 2016 NR/NR/NR 163bp<br />
Statoil STOIL 4.375% 2015 Aa2 S/AA- S 27bp<br />
Statoil STOIL 5.625% 2021 Aa2 S/AA- S 42bp<br />
Vestas VWSDC 4.625% 2015 NR/NR/NR 147bp<br />
Statkraft STATK 5.5% 2015 Baa1 S/A- S/BBB+ S 56bp<br />
Statkraft STATK 4.625% 2017 Baa1 S/A- S/BBB+ S 66bp<br />
Statkraft STATK 6.625% 2019 Baa1 S/A- S/BBB+ S 77bp<br />
Bid/Offer<br />
Fortum 5Y CDS A2 S/A S/A S 59/62bp<br />
Vattenfall 5Y CDS A2 S/A NO/A+ NO 64/67bp<br />
DONG Energy 5Y CDS Baa1 S/A- S/BBB+ NO 60/64bp<br />
Statoil 5Y CDS Aa2 S/AA- S 57/61bp<br />
* Spread to bunds, Source: Moodys, Standard & Poors, and <strong>Danske</strong> Markets<br />
222 | 13 April 2011<br />
www.danskeresearch.com
<strong>Scandi</strong> Handbook<br />
Bond Price Chart - Utilities<br />
Comparable EUR issues<br />
Indicative ASW offer (bps)<br />
140<br />
NESVFH '15 (NR/NR)<br />
120<br />
TVO '16 (NR/NR)<br />
100<br />
80<br />
60<br />
STATK '15 (A-/Baa1)<br />
STATK '17 (A-/Baa1)<br />
DANGAS '16 (A-/Baa1)<br />
40<br />
20<br />
DANGAS '14 (A-/Baa1) VATFAL '16 (A/A2)<br />
FRTUM '16 (A/A2)<br />
VATFAL '14 (A/A2)<br />
VATFAL '13 (A/A2)<br />
FRTUM '14 (A/A2)<br />
VATFAL '13 (A/A2)<br />
FRTUM '13 (A/A2) STOIL '15 (AA-/Aa2)<br />
DANGAS '12 (A-/Baa1)<br />
0<br />
2010 2011 2012 2013 2014 2015 2016 2017 2018 2019<br />
AAA AA+/AA/AA- A+/A/A- BBB+/BBB/BBB- Not rated by S&P/Moody's<br />
Note: Prices as of 11 April 2011. Source: <strong>Danske</strong> Markets<br />
223 | 13 April 2011<br />
www.danskeresearch.com
<strong>Scandi</strong> Handbook<br />
Disclosures<br />
This research report has been prepared by <strong>Danske</strong> Research, a division of <strong>Danske</strong> <strong>Bank</strong> A/S ("<strong>Danske</strong><br />
<strong>Bank</strong>"). The authors of this research report (together with contact details) are listed on the inside front<br />
cover.<br />
Analyst certification<br />
Each research analyst responsible for the content of this research report certifies that the views expressed in<br />
the research report accurately reflect the research analyst’s personal view about the financial instruments<br />
and issuers covered by the research report. Each responsible research analyst further certifies that no part of<br />
the compensation of the research analyst was, is or will be, directly or indirectly, related to the specific<br />
recommendations expressed in the research report.<br />
Regulation<br />
<strong>Danske</strong> <strong>Bank</strong> is authorized and subject to regulation by the Danish Financial Supervisory Authority and is<br />
subject to the rules and regulation of the relevant regulators in all other jurisdictions where it conducts<br />
business. <strong>Danske</strong> <strong>Bank</strong> is subject to limited regulation by the Financial Services Authority (UK). Details on<br />
the extent of the regulation by the Financial Services Authority are available from <strong>Danske</strong> <strong>Bank</strong> upon<br />
request.<br />
The research reports of <strong>Danske</strong> <strong>Bank</strong> are prepared in accordance with the Danish Society of Financial<br />
Analysts’ rules of ethics and the recommendations of the Danish Securities Dealers Association.<br />
Conflicts of interest<br />
<strong>Danske</strong> <strong>Bank</strong> has established procedures to prevent conflicts of interest and to ensure the provision of high<br />
quality research based on research objectivity and independence. These procedures are documented in the<br />
research policies of <strong>Danske</strong> <strong>Bank</strong>. Employees within the <strong>Danske</strong> <strong>Bank</strong> Research Departments have been<br />
instructed that any request that might impair the objectivity and independence of research shall be referred<br />
to the Research Management and the Compliance Department. <strong>Danske</strong> <strong>Bank</strong> Research Departments are<br />
organised independently from and do not report to other business areas within <strong>Danske</strong> <strong>Bank</strong>.<br />
Research analysts are remunerated in part based on the over-all profitability of <strong>Danske</strong> <strong>Bank</strong>, which includes<br />
investment banking revenues, but do not receive bonuses or other remuneration linked to specific<br />
corporate finance or debt capital transactions.<br />
<strong>Danske</strong> <strong>Bank</strong> is a market maker and may hold positions in the financial instruments mentioned in this<br />
research report.<br />
<strong>Danske</strong> <strong>Bank</strong>, its affiliates and subsidiaries are engaged in commercial banking, securities underwriting,<br />
dealing, trading, brokerage, investment management, investment banking, custody and other financial<br />
services activities, may be a lender to the companies mentioned in this publication, and have whatever rights<br />
as are available to a creditor under applicable law and the applicable loan and credit agreements. At any<br />
time, <strong>Danske</strong> <strong>Bank</strong>, its affiliates and subsidiaries may have credit or other information regarding the companies<br />
mentioned in this publication that is not available to or may not be used by the personnel responsible<br />
for the preparation of this report, which might affect the analysis and opinions expressed in this research<br />
report.<br />
Please go to http://www-2.danskebank.com/Link/researchdisclaimer for further disclosures and information.<br />
General Disclaimer<br />
This research has been prepared by <strong>Danske</strong> Markets (a division of <strong>Danske</strong> <strong>Bank</strong> A/S). It is provided for<br />
informational purposes only. It does not constitute or form part of, and shall under no circumstances be<br />
considered as, an offer to sell or a solicitation of an offer to purchase or sell any relevant financial instruments<br />
(i.e. financial instruments mentioned herein or other financial instruments of any issuer mentioned<br />
herein and/or options, warrants, rights or other interests with respect to any such financial instruments)<br />
("Relevant Financial Instruments").<br />
The research report has been prepared independently and solely on the basis of publicly available information<br />
which <strong>Danske</strong> <strong>Bank</strong> considers to be reliable. Whilst reasonable care has been taken to ensure that its<br />
contents are not untrue or misleading, no representation is made as to its accuracy or completeness, and<br />
<strong>Danske</strong> <strong>Bank</strong>, its affiliates and subsidiaries accept no liability whatsoever for any direct or consequential<br />
loss, including without limitation any loss of profits, arising from reliance on this research report.<br />
The opinions expressed herein are the opinions of the research analysts responsible for the research report<br />
and reflect their judgment as of the date hereof. These opinions are subject to change, and <strong>Danske</strong> <strong>Bank</strong><br />
does not undertake to notify any recipient of this research report of any such change nor of any other<br />
changes related to the information provided in the research report.<br />
224 | 13 April 2011<br />
www.danskeresearch.com
<strong>Scandi</strong> Handbook<br />
This research report is not intended for retail customers in the United Kingdom or the United States.<br />
This research report is protected by copyright and is intended solely for the designated addressee. It may not<br />
be reproduced or distributed, in whole or in part, by any recipient for any purpose without <strong>Danske</strong> <strong>Bank</strong>’s<br />
prior written consent.<br />
Disclaimer related to distribution in the United States<br />
This research report is distributed in the United States by <strong>Danske</strong> Markets Inc., a U.S. registered brokerdealer<br />
and subsidiary of <strong>Danske</strong> <strong>Bank</strong>, pursuant to SEC Rule 15a-6 and related interpretations issued by the<br />
U.S. Securities and Exchange Commission. The research report is intended for distribution in the United<br />
States solely to "U.S. institutional investors" as defined in SEC Rule 15a-6. <strong>Danske</strong> Markets Inc. accepts<br />
responsibility for this research report in connection with distribution in the United States solely to “U.S.<br />
institutional investors”.<br />
<strong>Danske</strong> <strong>Bank</strong> is not subject to U.S. rules with regard to the preparation of research reports and the independence<br />
of research analysts. In addition, the research analysts of <strong>Danske</strong> <strong>Bank</strong> who have prepared this<br />
research report are not registered or qualified as research analysts with the NYSE or FINRA, but satisfy the<br />
applicable requirements of a non-U.S. jurisdiction.<br />
Any U.S. investor recipient of this research report who wishes to purchase or sell any Relevant Financial<br />
Instrument may do so only by contacting <strong>Danske</strong> Markets Inc. directly and should be aware that investing in<br />
non-U.S. financial instruments may entail certain risks. Financial instruments of non-U.S. issuers may not<br />
be registered with the U.S. Securities and Exchange Commission and may not be subject to the reporting<br />
and auditing standards of the U.S. Securities and Exchange Commission.<br />
225 | 13 April 2011<br />
www.danskeresearch.com
<strong>Danske</strong> Fixed Income Credit Research: Recommendation definitions<br />
Issuer / Specific bond<br />
Credit Trend<br />
Credit default Swaps<br />
Terminology<br />
BUY<br />
HOLD<br />
SELL<br />
Improving<br />
Stable<br />
Deteriorating<br />
BUY protection<br />
SELL protection<br />
Horizon<br />
3 months Investment recommendations are based on<br />
Credit Trend as well as relative value compared<br />
to sector and peers. A BUY/HOLD/SELL<br />
recommendation on a specific bond means that<br />
the bond is expected to outperform/perform<br />
in line/underperform bonds within the sector<br />
or peer group over a three-month period. A<br />
BUY/HOLD/SELL recommendation on a specific<br />
issuer means that the majority of the issuer’s<br />
outstanding bonds have a BUY/HOLD/SELL<br />
recommendation.<br />
6 months Underlying credit fundamentals are expected to<br />
improve/remain stable/deteriorate over the next<br />
six months.<br />
3 months A BUY/SELL recommendation on a CDS means<br />
that the CDS level is expected to widen/tighten<br />
compared to the sector, peer group, or cash<br />
bonds for the issuing entity over a three-month<br />
period.<br />
Rating Abbreviations<br />
Abbreviation Moody's Standard & Poor's Fitch<br />
“S” Stable Outlook Stable Outlook Stable Outlook<br />
“NO” Negative Outlook Negative Outlook Negative Outlook<br />
“PO” Positive Outlook Positive Outlook Positive Outlook<br />
“DO” Developing Outlook Developing Outlook Evolving Outlook<br />
“NW” Review for possible downgrade CreditWatch Negative Watch Negative<br />
“PW” Review for possible upgrade CreditWatch Positive Watch Positive<br />
“DW” Review - Direction uncertain CreditWatch Developing Watch Evolving<br />
“NR” Not rated Not rated Not rated
Gl o b a l Da n s k e Re s e a r c h<br />
H e a d o f Gl o b a l Da n s k e Re s e a r c h<br />
Thomas Thøgersen Grønkjær<br />
+45 45 12 85 02<br />
thgr@danskebank.dk<br />
C h i e f Ec o n o m i s t a t Da n s k e Ba n k<br />
Steen Bocian<br />
+45 45 12 85 31<br />
stbo@danskebank.dk<br />
I n t e r n a t i o n a l Ma c r o &<br />
F o r e i g n Ex h a n g e &<br />
F i x e d In c o m e Re s e a r c h<br />
C r e d i t Re s e a r c h<br />
I n t e r e s t Ra t e St r at e g y<br />
C o m m o d i t i e s<br />
C h i e f A n a l y s t &<br />
H e a d of<br />
Allan von Mehren<br />
+45 45 12 80 55<br />
alvo@danskebank.dk<br />
C h i e f A n a l y s t &<br />
H e a d of<br />
Arne Lohmann Rasmussen<br />
+45 45 12 85 32<br />
arr@danskebank.dk<br />
C h i e f A n a l y s t &<br />
H e a d of<br />
Thomas Thøgersen Grønkjær<br />
+45 45 12 85 02<br />
thgr@danskebank.dk<br />
C h i e f A n a l y s t &<br />
H e a d of<br />
Thomas Martin Hovard<br />
+45 45 12 85 05<br />
hova@danskebank.dk<br />
P e te r P o s s i n g A n d e r s e n<br />
+45 45 13 70 19<br />
pa@danskebank.dk<br />
Kasper Kirkegaard<br />
+45 45 13 70 18<br />
kaki@danskebank.dk<br />
Jens Peter Sørensen<br />
+45 45 12 85 17<br />
jenssr@danskebank.dk<br />
H e n r i k A r n t<br />
+45 45 12 85 04<br />
heand@danskebank.dk<br />
S i g n e P. R o e d - F r e d e r i k s e n<br />
+45 45 12 82 29<br />
sroe@danskebank.dk<br />
S v e r r e H o l b e k<br />
+45 45 14 88 82<br />
holb@danskebank.dk<br />
Gustav Bundgaard Smidth<br />
+45 45 13 07 89<br />
gusm@danskebank.dk<br />
Louis Landeman<br />
+46 8 568 80524<br />
llan @danskebank.se<br />
Frank Øland Hansen<br />
+ 4 5 4 5 1 2 8 5 2 6<br />
franh@danskebank.dk<br />
C h r i s t i n K y r m e Tu x e n<br />
+45 45 13 78 67<br />
tux@danskebank.dk<br />
Christina E. Falch<br />
+45 45 12 71 52<br />
chfa@danskebank.dk<br />
J a ko b M a g n u s s e n<br />
+45 45 12 85 03<br />
jakja@danskebank.dk<br />
Anders Møller Jørgensen<br />
+45 45 12 84 98<br />
andjrg@danskebank.dk<br />
U n i t e d Ki n g d o m<br />
Christian Riemann-Andersen<br />
+45 45 12 85 65<br />
chande@danskebank.dk<br />
Kristian Myrup Pedersen<br />
+45 45 12 85 19<br />
kripe@danskebank.dk<br />
Lars Rasmussen<br />
+ 4 5 4 5 1 2 8 5 3 4<br />
laras@danskebank.dk<br />
F l e m m i n g J e g b j æ r g N i e l s e n<br />
+45 45 12 85 35<br />
flemm@danskebank.dk<br />
Chief Analyst<br />
John Hydeskov<br />
+44 20 7410 8144<br />
johy@danskebank.dk<br />
Søren Skov Hansen<br />
+45 45 12 84 30<br />
srha@danskebank.dk<br />
Asbjørn Purup Andersen<br />
+45 45 14 88 86<br />
apu@danskebank.dk<br />
D e r i v at i v e s Re s e a r c h &<br />
E m e r g i n g Ma r k e t s<br />
D e n m a r k<br />
S w e d e n<br />
R i s k St r u c t u r i n g<br />
C h i e f A n a l y s t &<br />
H e a d of<br />
Thomas Thøgersen Grønkjær<br />
+45 45 12 85 02<br />
thgr@danskebank.dk<br />
M a r t i n D a l s ko v L i n d e r s tr ø m<br />
+45 45 12 85 20<br />
marlin@danskebank.dk<br />
Nicki S. Rasmussen<br />
+45 45 12 80 90<br />
nir@danskebank.dk<br />
Chief Analyst &<br />
H e a d of<br />
Lars Christensen<br />
+45 45 12 85 30<br />
larch@danskebank.dk<br />
Özhan Antero Atilla<br />
+45 45 12 80 04<br />
zat@danskebank.dk<br />
Stanislava Pradova<br />
+45 45 12 80 71<br />
spra@danskebank.dk<br />
Chief Economist<br />
Steen Bocian<br />
+45 45 12 85 31<br />
stbo@danskebank.dk<br />
L a s O l s e n<br />
+45 45 12 85 36<br />
laso@danskebank.dk<br />
J e n s N æ r v i g P e d e r s e n<br />
+45 45 12 80 61<br />
jenpe@danskebank.dk<br />
C h i e f A n a l y s t &<br />
H e a d of<br />
Michael Boström<br />
+46 8 568 805 87<br />
mbos@consensus.se<br />
Roger Josefsson<br />
+46 8 568 805 58<br />
rjos@consensus.se<br />
M i c h a e l G r a h n<br />
+46 8 568 807 00<br />
mika@consensus.se<br />
I r e l a n d<br />
C h i e f E c o n o m i s t<br />
Dr. Ronnie O’Toole<br />
+353 1 484 2071<br />
ron@danskebank.com<br />
Violeta Klyviene<br />
Senior Baltic Analyst<br />
+370 611 24354<br />
vkly@danskebank.dk<br />
Economist<br />
Sanna Kurronen<br />
+358 10 546 7573<br />
kurr@danskebank.com<br />
N o r w a y<br />
Chief Economist<br />
Frank Jullum<br />
+47 85 40 65 40<br />
fju@fokus.no<br />
Jens Petter Olson<br />
+47 85 40 52 05<br />
jeols@fokus.no<br />
Carl Milton<br />
+46 8 568 805 98<br />
carmi@consensus.se<br />
Marcus Söderberg<br />
+46 8 568 805 64<br />
marsd@consensus.se<br />
Stefan Mellin<br />
+46 8 568 805 92<br />
mell@consensus.se<br />
Snorre Evjen<br />
+47 85 40 84 36<br />
evj@fokus.no<br />
<strong>Danske</strong> <strong>Bank</strong>, <strong>Danske</strong> Research, Holmens Kanal 2-12, DK - 1092 Copenhagen K. Phone +45 45 12 00 00 www.danskeresearch.com