

Left Brain Right B - the DBS Vickers Securities Equities Research
Left Brain Right B - the DBS Vickers Securities Equities Research
Left Brain Right B - the DBS Vickers Securities Equities Research

Create successful ePaper yourself
Turn your PDF publications into a flip-book with our unique Google optimized e-Paper software.
Regional Equity Strategy 4Q 2009<br />
Strategy Overview: Asia Equity<br />
on <strong>the</strong>m. The fundamental checks are (1) whe<strong>the</strong>r asset price<br />
inflation will eventually start spilling over onto <strong>the</strong> CPI and (2) if<br />
<strong>the</strong>re is cost push inflation, especially from <strong>the</strong> labor market,<br />
raw materials and business costs, which will in turn compress<br />
margins. China's CPI and PPI continued to fall in August,<br />
suggesting <strong>the</strong>re is still no price pressure in China.<br />
Unemployment rate in Asia probably hasn't peaked yet. We<br />
look at <strong>the</strong> formation of bubble markets from three aspects:<br />
stock, property and credit markets. The conclusion is that<br />
<strong>the</strong>re may be premature signs of a bubble but not suggestive<br />
of an imminent burst.<br />
Stock market bubble<br />
A stock market bubble is a type of economic bubble taking<br />
place in stock markets when market participants drive stock<br />
prices above <strong>the</strong>ir value in relation to some measures of stock<br />
valuation.<br />
Valuations<br />
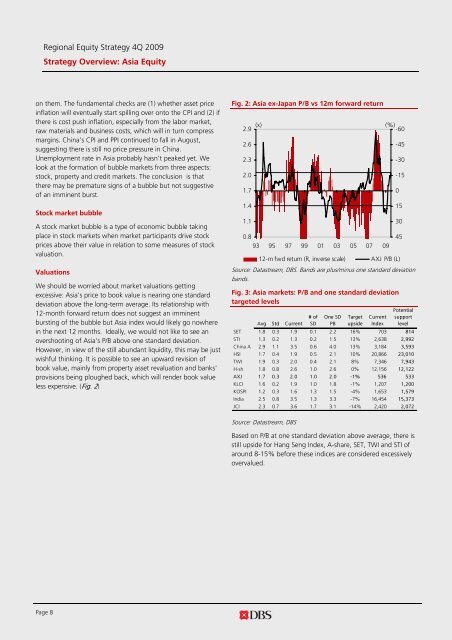
We should be worried about market valuations getting<br />
excessive: Asia's price to book value is nearing one standard<br />
deviation above <strong>the</strong> long-term average. Its relationship with<br />
12-month forward return does not suggest an imminent<br />
bursting of <strong>the</strong> bubble but Asia index would likely go nowhere<br />
in <strong>the</strong> next 12 months. Ideally, we would not like to see an<br />
overshooting of Asia's P/B above one standard deviation.<br />
However, in view of <strong>the</strong> still abundant liquidity, this may be just<br />
wishful thinking. It is possible to see an upward revision of<br />
book value, mainly from property asset revaluation and banks'<br />
provisions being ploughed back, which will render book value<br />
less expensive. (Fig. 2)<br />
Fig. 2: Asia ex-Japan P/B vs 12m forward return<br />
2.9<br />
2.6<br />
2.3<br />
2.0<br />
1.7<br />
1.4<br />
1.1<br />
(x) (%)<br />
-60<br />
0.8<br />
93 95 97 99 01 03 05 07 09<br />
12-m fwd return (R, inv erse scale) AXJ P/B (L)<br />
Source: Datastream, <strong>DBS</strong>. Bands are plus/minus one standard deviation<br />
bands.<br />
Fig. 3: Asia markets: P/B and one standard deviation<br />
targeted levels<br />
Avg Std Current<br />
# of<br />
SD<br />
One SD<br />
PB<br />
Target<br />
upside<br />
Current<br />
Index<br />
Potential<br />
support<br />
level<br />
SET 1.8 0.3 1.9 0.1 2.2 16% 703 814<br />
STI 1.3 0.2 1.3 0.2 1.5 13% 2,638 2,992<br />
China A 2.9 1.1 3.5 0.6 4.0 13% 3,184 3,593<br />
HSI 1.7 0.4 1.9 0.5 2.1 10% 20,866 23,010<br />
TWI 1.9 0.3 2.0 0.4 2.1 8% 7,346 7,943<br />
H-sh 1.8 0.8 2.6 1.0 2.6 0% 12,156 12,122<br />
AXJ 1.7 0.3 2.0 1.0 2.0 -1% 536 533<br />
KLCI 1.6 0.2 1.9 1.0 1.8 -1% 1,207 1,200<br />
KOSPI 1.2 0.3 1.6 1.3 1.5 -4% 1,653 1,579<br />
India 2.5 0.8 3.5 1.3 3.3 -7% 16,454 15,373<br />
JCI 2.3 0.7 3.6 1.7 3.1 -14% 2,420 2,072<br />
-45<br />
-30<br />
-15<br />
0<br />
15<br />
30<br />
45<br />
Source: Datastream, <strong>DBS</strong><br />
Based on P/B at one standard deviation above average, <strong>the</strong>re is<br />
still upside for Hang Seng Index, A-share, SET, TWI and STI of<br />
around 8-15% before <strong>the</strong>se indices are considered excessively<br />
overvalued.<br />
Page 8


