Left Brain Right B - the DBS Vickers Securities Equities Research
Left Brain Right B - the DBS Vickers Securities Equities Research
Left Brain Right B - the DBS Vickers Securities Equities Research
Create successful ePaper yourself
Turn your PDF publications into a flip-book with our unique Google optimized e-Paper software.
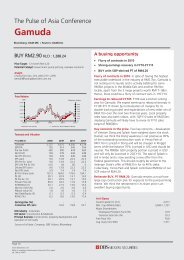
Regional Equity Strategy 4Q 2009<br />
UOB<br />
Bloomberg: UOB SP | Reuters: UOBH.SI<br />
BUY S$17.00 STI : 2,672.60<br />
Price Target : 12-month S$ 18.60<br />
Potential Catalyst: Book value recovery, room for lower provisions and<br />
ROE to normalise.<br />
Analyst<br />
Sue Lin Lim +603 2711 0971<br />
suelin@hwangdbsvickers.com.my<br />
Price Relative<br />
25.40<br />
23.40<br />
21.40<br />
19.40<br />
17.40<br />
15.40<br />
13.40<br />
11.40<br />
9.40<br />
7.40<br />
S$<br />
2005 2006 2007 2008 2009<br />
UOB (LHS) Relative STI INDEX (RHS)<br />
Forecasts and Valuation<br />
Relative Index<br />
FY Dec (S$ m) 2008A 2009F 2010F 2011F<br />
Pre-prov. Profit 3,190 3,117 3,179 3,348<br />
Net Profit 1,937 1,657 1,946 2,340<br />
Net Pft (Pre Ex.) 1,937 1,657 1,946 2,340<br />
EPS (S cts) 128.1 109.6 128.7 154.7<br />
EPS Pre Ex. (S cts) 128.1 109.6 128.7 154.7<br />
EPS Gth Pre Ex (%) (7) (14) 17 20<br />
Diluted EPS (S cts) 128.1 109.6 128.7 154.7<br />
PE Pre Ex. (X) 13.3 15.5 13.2 11.0<br />
Net DPS (S cts) 59.7 54.8 64.4 77.4<br />
Div Yield (%) 3.5 3.2 3.8 4.6<br />
ROAE Pre Ex. (%) 12.6 10.7 11.4 12.9<br />
ROAE (%) 12.6 10.7 11.4 12.9<br />
ROA (%) 1.1 0.9 1.0 1.2<br />
BV Per Share (S cts) 943 1,097 1,161 1,238<br />
P/Book Value (x) 1.8 1.6 1.5 1.4<br />
Earnings Rev (%): - - -<br />
Consensus EPS (S cts): 113.4 132.8 150.2<br />
ICB Industry : Financials<br />
ICB Sector: Banks<br />
Principal Business: Financials<br />
Source of all data: Company, <strong>DBS</strong> <strong>Vickers</strong>, Bloomberg<br />
219<br />
199<br />
179<br />
159<br />
139<br />
119<br />
99<br />
79<br />
On track for recovery<br />
• Operationally sound with selective interest in<br />
regional expansion.<br />
• ‘Normalised’ provisions levels should lift earnings<br />
and ROEs.<br />
• Key near term catalyst lies in <strong>the</strong> re-rating of its<br />
book value.<br />
Operationally sound. UOB remains operationally sound<br />
with pre-provision profits remaining robust up to 1H09<br />
despite going through a tough operating environment<br />
over <strong>the</strong> last 6-12 months. NIMs are expected to remain<br />
flattish for <strong>the</strong> rest of <strong>the</strong> year with competition reemerging<br />
and corporate and SME loan spreads peaking.<br />
Positively, specific provisions have begun to taper off and<br />
we believe NPLs would peak by year-end. UOB remains<br />
selective in its regional expansion. It has a well-established<br />
exposure in Malaysia and Indonesia, while it aims to<br />
entrench its presence in China.<br />
Conservatism in provisions will pay off. UOB remains<br />
conservative as it continues to build its collective<br />
impairment reserves for <strong>the</strong> year. However, with <strong>the</strong><br />
impending economic recovery, we believe collective<br />
impairments would not be a feature in FY10, which<br />
implies a strong earnings recovery in FY10. This would be<br />
a key re-rating for UOB’s earnings and ROEs. Our FY10-11<br />
provision charge-off rate assumptions of 74bps and 40bps<br />
may still appear high compared to UOB’s historical<br />
‘normalised’ levels of 26bps.<br />
ROE re-rating by 2011. We expect FY09 earnings to<br />
remain sluggish with collective impairment building up.<br />
But, 2010 could be a year of earnings recovery, and we<br />
believe earnings and ROEs should normalize by 2011.<br />
UOB’s sustainable ROE of 13% stacks up better than its<br />
peers. UOB’s near term catalyst lies in its book recovery.<br />
Up to 1H09, UOB’s book value has recovered by 12%<br />
since it deteriorated in 4Q08. UOB’s stronger domestic<br />
market share for loans bodes well with <strong>the</strong> economic<br />
recovery play in 2010.<br />
At A Glance<br />
Issued Capital (m shrs) 1,524<br />
Mkt. Cap (S$m/US$m) 25,909 / 18,314<br />
Major Shareholders<br />
Wee Investment (%) 7.4<br />
Wah Hin & Co Pte (%) 5.3<br />
Free Float (%) 87.3<br />
Avg. Daily Vol.(‘000) 3,493<br />
Page 62<br />
www.dbsvickers.com<br />
Refer to important disclosures at <strong>the</strong> end of this report<br />
ed: YM / sa: TW


