

Left Brain Right B - the DBS Vickers Securities Equities Research
Left Brain Right B - the DBS Vickers Securities Equities Research
Left Brain Right B - the DBS Vickers Securities Equities Research

You also want an ePaper? Increase the reach of your titles
YUMPU automatically turns print PDFs into web optimized ePapers that Google loves.
Regional Equity Strategy 4Q 2009<br />
Country Assessment<br />
2010 growth (%)<br />
While we have upgraded earnings growth from 12% to<br />
18% for 2010, EPS upgrade is slower than <strong>the</strong> region, due<br />
to 1) dilutive effect of recent rights issues and cash calls, and<br />
2) earnings for industrial sector, a late cycle play which has<br />
yet to be upgraded. Singapore earnings are highly cyclical,<br />
with 55% exposed to domestic cyclicals (Financials,<br />
consumer discretionary) and 21% externally via industrials.<br />
As such, we expect earnings upgrade curve to be steep, in<br />
line with <strong>the</strong> V shaped recovery in Singapore and <strong>the</strong> region.<br />
Following <strong>the</strong> decrease in risk aversion since March 2009,<br />
Equity Risk premium has normalized to its long term average<br />
of 4.2%. Assuming ERP at 4.2%, our sensitivity analysis<br />
points to a fur<strong>the</strong>r 2% upside for <strong>the</strong> FSSTI Index if our<br />
growth forecasts stay at 18% in FY2010. We arrive at a<br />
target of 2800 over <strong>the</strong> next 3 months, supported by price<br />
to book and average PE of 16x on FY10 earnings.<br />
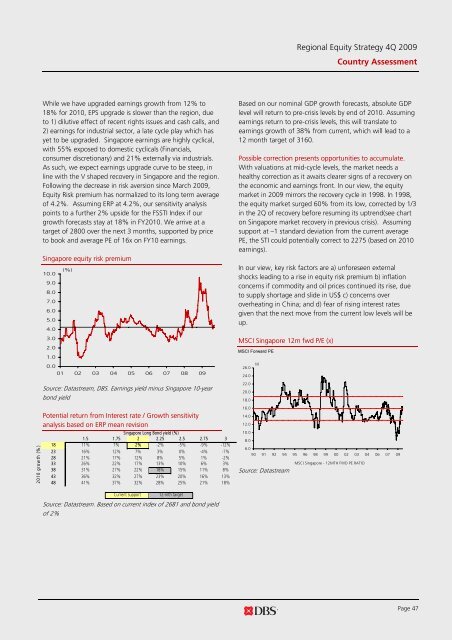
Singapore equity risk premium<br />
10.0<br />
9.0<br />
8.0<br />
7.0<br />
6.0<br />
5.0<br />
4.0<br />
3.0<br />
2.0<br />
1.0<br />
(%)<br />
0.0<br />
01 02 03 04 05 06 07 08 09<br />
Source: Datastream, <strong>DBS</strong>. Earnings yield minus Singapore 10-year<br />
bond yield<br />
Potential return from Interest rate / Growth sensitivity<br />
analysis based on ERP mean revision<br />
Singapore Long Bond yield (%)<br />
1.5 1.75 2 2.25 2.5 2.75 3<br />
18 11% 7% 2% -2% -5% -9% -12%<br />
23 16% 12% 7% 3% 0% -4% -7%<br />
28 21% 17% 12% 8% 5% 1% -2%<br />
33 26% 22% 17% 13% 10% 6% 3%<br />
38 31% 27% 22% 18% 15% 11% 8%<br />
43 36% 32% 27% 23% 20% 16% 13%<br />
48 41% 37% 32% 28% 25% 21% 18%<br />
Based on our nominal GDP growth forecasts, absolute GDP<br />
level will return to pre-crisis levels by end of 2010. Assuming<br />
earnings return to pre-crisis levels, this will translate to<br />
earnings growth of 38% from current, which will lead to a<br />
12 month target of 3160.<br />
Possible correction presents opportunities to accumulate.<br />
With valuations at mid-cycle levels, <strong>the</strong> market needs a<br />
healthy correction as it awaits clearer signs of a recovery on<br />
<strong>the</strong> economic and earnings front. In our view, <strong>the</strong> equity<br />
market in 2009 mirrors <strong>the</strong> recovery cycle in 1998. In 1998,<br />
<strong>the</strong> equity market surged 60% from its low, corrected by 1/3<br />
in <strong>the</strong> 2Q of recovery before resuming its uptrend(see chart<br />
on Singapore market recovery in previous crisis). Assuming<br />
support at –1 standard deviation from <strong>the</strong> current average<br />
PE, <strong>the</strong> STI could potentially correct to 2275 (based on 2010<br />
earnings).<br />
In our view, key risk factors are a) unforeseen external<br />
shocks leading to a rise in equity risk premium b) inflation<br />
concerns if commodity and oil prices continued its rise, due<br />
to supply shortage and slide in US$ c) concerns over<br />
overheating in China; and d) fear of rising interest rates<br />
given that <strong>the</strong> next move from <strong>the</strong> current low levels will be<br />
up.<br />
MSCI Singapore 12m fwd P/E (x)<br />
MSCI Forward PE<br />
26.0<br />
24.0<br />
22.0<br />
20.0<br />
18.0<br />
16.0<br />
14.0<br />
12.0<br />
10.0<br />
8.0<br />
6.0<br />
(x)<br />
90 91 92 94 95 96 98 99 00 02 03 04 06 07 09<br />
MSCI Singapore - 12MTH FWD PE RATIO<br />
Source: Datastream<br />
Current support 12-mth target<br />
Source: Datastream. Based on current index of 2681 and bond yield<br />
of 2%<br />
Page 47


