Left Brain Right B - the DBS Vickers Securities Equities Research
Left Brain Right B - the DBS Vickers Securities Equities Research Left Brain Right B - the DBS Vickers Securities Equities Research
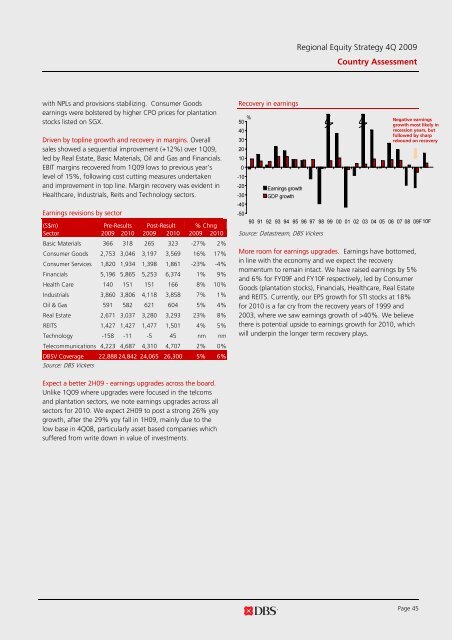
Regional Equity Strategy 4Q 2009 Country Assessment with NPLs and provisions stabilizing. Consumer Goods earnings were bolstered by higher CPO prices for plantation stocks listed on SGX. Driven by topline growth and recovery in margins. Overall sales showed a sequential improvement (+12%) over 1Q09, led by Real Estate, Basic Materials, Oil and Gas and Financials. EBIT margins recovered from 1Q09 lows to previous year’s level of 15%, following cost cutting measures undertaken and improvement in top line. Margin recovery was evident in Healthcare, Industrials, Reits and Technology sectors. Earnings revisions by sector (S$m) Pre-Results Post-Result % Chng Sector 2009 2010 2009 2010 2009 2010 Basic Materials 366 318 265 323 -27% 2% Consumer Goods 2,753 3,046 3,197 3,569 16% 17% Consumer Services 1,820 1,934 1,398 1,861 -23% -4% Financials 5,196 5,865 5,253 6,374 1% 9% Health Care 140 151 151 166 8% 10% Industrials 3,860 3,806 4,118 3,858 7% 1% Oil & Gas 591 582 621 604 5% 4% Real Estate 2,671 3,037 3,280 3,293 23% 8% REITS 1,427 1,427 1,477 1,501 4% 5% Technology -158 -11 -5 45 nm nm Telecommunications 4,223 4,687 4,310 4,707 2% 0% DBSV Coverage 22,888 24,842 24,065 26,300 5% 6% Source: DBS Vickers Recovery in earnings % Negative earnings 50 growth most likely in 40 recession years, but followed by sharp 30 rebound on recovery 20 10 0 -10 -20 Earnings growth -30 GDP growth -40 -50 90 91 92 93 94 95 96 97 98 99 00 01 02 03 04 05 06 07 08 09F10F Source: Datastream, DBS Vickers More room for earnings upgrades. Earnings have bottomed, in line with the economy and we expect the recovery momentum to remain intact. We have raised earnings by 5% and 6% for FY09F and FY10F respectively, led by Consumer Goods (plantation stocks), Financials, Healthcare, Real Estate and REITS. Currently, our EPS growth for STI stocks at 18% for 2010 is a far cry from the recovery years of 1999 and 2003, where we saw earnings growth of >40%. We believe there is potential upside to earnings growth for 2010, which will underpin the longer term recovery plays. Expect a better 2H09 - earnings upgrades across the board. Unlike 1Q09 where upgrades were focused in the telcoms and plantation sectors, we note earnings upgrades across all sectors for 2010. We expect 2H09 to post a strong 26% yoy growth, after the 29% yoy fall in 1H09, mainly due to the low base in 4Q08, particularly asset based companies which suffered from write down in value of investments. Page 45
Regional Equity Strategy 4Q 2009 Country Assessment Earnings Estimates by Sector Eanings Growth PER Sector 2008 2009F 2010F CAGR 08-10 2008 2009F 2010F Basic Materials 96.7 -8.7 20.8 5.0 13.0 14.2 11.7 Consumer Goods 83.8 6.1 16.9 11.4 16.8 15.8 13.5 Consumer Services -38.8 -40.5 103.2 10.0 22.8 38.3 18.8 Financials -13.3 -12.8 21.1 2.8 15.1 17.4 14.3 Health Care 10.0 5.5 15.4 10.3 20.0 19.0 16.5 Industrials 9.4 -20.0 -5.1 -12.9 11.4 14.2 15.0 Oil & Gas -25.0 13.7 16.0 14.9 13.1 11.6 10.0 Real Estate -1.7 22.0 5.4 13.4 18.7 15.3 14.5 REITS 33.2 2.0 3.0 2.5 15.6 15.3 14.9 Technology -74.7 Loss Loss nm 45.0 nm nm Telecommunications -6.4 10.0 9.2 9.6 14.2 12.9 11.9 DBSV Coverage (Before EI) -2.5 -6.3 15.1 3.8 15.6 16.6 14.5 DBSV Coverage (After EI) -23.2 -10.8 18.8 2.9 15.4 17.3 14.5 STI DBSV Forecast Avg (Before EI) -18.7 -18.9 18.3 -2.1 14.2 17.5 14.8 STI DBSV Forecast Avg (Aft EI) -20.7 -20.6 15.1 -4.4 13.6 16.9 14.7 STI Consensus Avg -18.7 -21.9 18.3 -3.9 13.6 17.5 14.8 Source: DBS Vickers VALUATION AND OUTLOOK DBS Economist has upgraded our 2009 and 2010 GDP forecasts to –3% and +5.2% respectively. Providing the additional kicker to GDP growth is the upcoming launch of the integrated resorts, which will add at least 1.5% to Singapore’s GDP, creating 60,000 jobs. The ripple effects are wide, ranging from gaming, property, hospitality, property to service providers such as retail, media and transport operators. Singapore 12-mth forward GDP growth and earnings growth forecast trend (%) (%) 8 40 GDP growth (L) 6 4 2 30 20 10 0 0 -2 Earnings growth (R) -10 -4 02 03 04 05 06 07 08 09 -20 Source: Consensus Economics Inc, DBS, IBES Page 46
- Page 1: Equity Strategy and Large Cap Stock
- Page 4 and 5: Regional Equity Strategy 4Q 2009 Ta
- Page 6 and 7: Regional Equity Strategy 4Q 2009 St
- Page 8 and 9: Regional Equity Strategy 4Q 2009 St
- Page 10 and 11: Regional Equity Strategy 4Q 2009 St
- Page 12 and 13: Regional Equity Strategy 4Q 2009 St
- Page 14 and 15: Regional Equity Strategy 4Q 2009 St
- Page 16 and 17: Regional Equity Strategy 4Q 2009 St
- Page 18 and 19: Regional Equity Strategy 4Q 2009 St
- Page 20 and 21: Regional Equity Strategy 4Q 2009 St
- Page 22 and 23: Regional Equity Strategy 4Q 2009 St
- Page 24 and 25: Regional Equity Strategy 4Q 2009 St
- Page 26 and 27: Regional Equity Strategy 4Q 2009 St
- Page 28 and 29: Regional Equity Strategy 4Q 2009 St
- Page 30 and 31: Regional Equity Strategy 4Q 2009 St
- Page 32 and 33: Regional Equity Strategy 4Q 2009 St
- Page 34 and 35: Regional Equity Strategy 4Q 2009 St
- Page 36 and 37: Regional Equity Strategy 4Q 2009 St
- Page 38 and 39: Regional Equity Strategy 4Q 2009 St
- Page 40 and 41: Regional Equity Strategy 4Q 2009 Re
- Page 42 and 43: Regional Equity Strategy 4Q 2009 Co
- Page 44 and 45: Regional Equity Strategy 4Q 2009 Co
- Page 48 and 49: Regional Equity Strategy 4Q 2009 Co
- Page 50 and 51: Regional Equity Strategy 4Q 2009 Co
- Page 52 and 53: Regional Equity Strategy 4Q 2009 Co
- Page 54 and 55: Regional Equity Strategy 4Q 2009 Co
- Page 56 and 57: Regional Equity Strategy 4Q 2009 Mo
- Page 58 and 59: Regional Equity Strategy 4Q 2009 Si
- Page 60 and 61: Regional Equity Strategy 4Q 2009 SP
- Page 62 and 63: Regional Equity Strategy 4Q 2009 Su
- Page 64 and 65: Income Statement (S$ m) Balance She
- Page 66 and 67: Regional Equity Strategy 4Q 2009 Co
- Page 68 and 69: Regional Equity Strategy 4Q 2009 Co
- Page 70 and 71: Regional Equity Strategy 4Q 2009 Co
- Page 72 and 73: Regional Equity Strategy 4Q 2009 Co
- Page 74 and 75: Regional Equity Strategy 4Q 2009 Co
- Page 76 and 77: Regional Equity Strategy 4Q 2009 Co
- Page 78 and 79: Regional Equity Strategy 4Q 2009 Co
- Page 80 and 81: Regional Equity Strategy 4Q 2009 Co
- Page 82 and 83: Regional Equity Strategy 4Q 2009 Ba
- Page 84 and 85: Regional Equity Strategy 4Q 2009 Ba
- Page 86 and 87: Regional Equity Strategy 4Q 2009 Ch
- Page 88 and 89: Regional Equity Strategy 4Q 2009 Ch
- Page 90 and 91: Regional Equity Strategy 4Q 2009 MT
- Page 92 and 93: Regional Equity Strategy 4Q 2009 Co
- Page 94 and 95: Regional Equity Strategy 4Q 2009 Co
Regional Equity Strategy 4Q 2009<br />
Country Assessment<br />
with NPLs and provisions stabilizing. Consumer Goods<br />
earnings were bolstered by higher CPO prices for plantation<br />
stocks listed on SGX.<br />
Driven by topline growth and recovery in margins. Overall<br />
sales showed a sequential improvement (+12%) over 1Q09,<br />
led by Real Estate, Basic Materials, Oil and Gas and Financials.<br />
EBIT margins recovered from 1Q09 lows to previous year’s<br />
level of 15%, following cost cutting measures undertaken<br />
and improvement in top line. Margin recovery was evident in<br />
Healthcare, Industrials, Reits and Technology sectors.<br />
Earnings revisions by sector<br />
(S$m) Pre-Results Post-Result % Chng<br />
Sector 2009 2010 2009 2010 2009 2010<br />
Basic Materials 366 318 265 323 -27% 2%<br />
Consumer Goods 2,753 3,046 3,197 3,569 16% 17%<br />
Consumer Services 1,820 1,934 1,398 1,861 -23% -4%<br />
Financials 5,196 5,865 5,253 6,374 1% 9%<br />
Health Care 140 151 151 166 8% 10%<br />
Industrials 3,860 3,806 4,118 3,858 7% 1%<br />
Oil & Gas 591 582 621 604 5% 4%<br />
Real Estate 2,671 3,037 3,280 3,293 23% 8%<br />
REITS 1,427 1,427 1,477 1,501 4% 5%<br />
Technology -158 -11 -5 45 nm nm<br />
Telecommunications 4,223 4,687 4,310 4,707 2% 0%<br />
<strong>DBS</strong>V Coverage 22,888 24,842 24,065 26,300 5% 6%<br />
Source: <strong>DBS</strong> <strong>Vickers</strong><br />
Recovery in earnings<br />
%<br />
Negative earnings<br />
50<br />
growth most likely in<br />
40<br />
recession years, but<br />
followed by sharp<br />
30<br />
rebound on recovery<br />
20<br />
10<br />
0<br />
-10<br />
-20<br />
Earnings growth<br />
-30 GDP growth<br />
-40<br />
-50<br />
90 91 92 93 94 95 96 97 98 99 00 01 02 03 04 05 06 07 08 09F10F<br />
Source: Datastream, <strong>DBS</strong> <strong>Vickers</strong><br />
More room for earnings upgrades. Earnings have bottomed,<br />
in line with <strong>the</strong> economy and we expect <strong>the</strong> recovery<br />
momentum to remain intact. We have raised earnings by 5%<br />
and 6% for FY09F and FY10F respectively, led by Consumer<br />
Goods (plantation stocks), Financials, Healthcare, Real Estate<br />
and REITS. Currently, our EPS growth for STI stocks at 18%<br />
for 2010 is a far cry from <strong>the</strong> recovery years of 1999 and<br />
2003, where we saw earnings growth of >40%. We believe<br />
<strong>the</strong>re is potential upside to earnings growth for 2010, which<br />
will underpin <strong>the</strong> longer term recovery plays.<br />
Expect a better 2H09 - earnings upgrades across <strong>the</strong> board.<br />
Unlike 1Q09 where upgrades were focused in <strong>the</strong> telcoms<br />
and plantation sectors, we note earnings upgrades across all<br />
sectors for 2010. We expect 2H09 to post a strong 26% yoy<br />
growth, after <strong>the</strong> 29% yoy fall in 1H09, mainly due to <strong>the</strong><br />
low base in 4Q08, particularly asset based companies which<br />
suffered from write down in value of investments.<br />
Page 45


