

Left Brain Right B - the DBS Vickers Securities Equities Research
Left Brain Right B - the DBS Vickers Securities Equities Research
Left Brain Right B - the DBS Vickers Securities Equities Research

You also want an ePaper? Increase the reach of your titles
YUMPU automatically turns print PDFs into web optimized ePapers that Google loves.
Regional Equity Strategy 4Q 2009<br />
Regional Data Monitor<br />
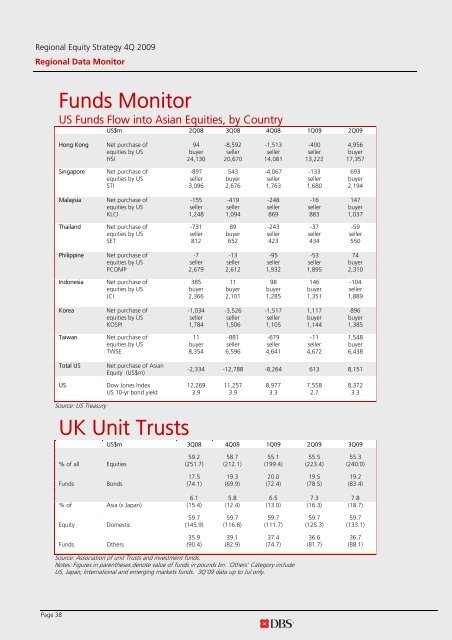
Funds Monitor<br />
US Funds Flow into Asian <strong>Equities</strong>, by Country<br />
US$m 2Q08 3Q08 4Q08 1Q09 2Q09<br />
Hong Kong Net purchase of 94 -8,592 -1,513 -400 4,956<br />
equities by US buyer seller seller seller buyer<br />
HSI 24,130 20,670 14,081 13,222 17,357<br />
Singapore Net purchase of -897 543 -4,067 -133 693<br />
equities by US seller buyer seller seller buyer<br />
STI 3,096 2,676 1,763 1,680 2,194<br />
Malaysia Net purchase of -155 -419 -248 -16 147<br />
equities by US seller seller seller seller buyer<br />
KLCI 1,248 1,094 869 883 1,037<br />
Thailand Net purchase of -731 89 -243 -37 -59<br />
equities by US seller buyer seller seller seller<br />
SET 812 652 423 434 550<br />
Philippine Net purchase of -7 -13 -95 -53 74<br />
equities by US seller seller seller seller buyer<br />
PCOMP 2,679 2,612 1,932 1,895 2,310<br />
Indonesia Net purchase of 385 11 98 146 -104<br />
equities by US buyer buyer buyer buyer seller<br />
JCI 2,366 2,101 1,285 1,351 1,889<br />
Korea Net purchase of -1,034 -3,526 -1,517 1,117 896<br />
equities by US seller seller seller buyer buyer<br />
KOSPI 1,784 1,506 1,105 1,144 1,385<br />
Taiwan Net purchase of 11 -881 -679 -11 1,548<br />
equities by US buyer seller seller seller buyer<br />
TWSE 8,354 6,596 4,641 4,672 6,438<br />
Total US<br />
Net purchase of Asian<br />
Equity (US$m)<br />
-2,334 -12,788 -8,264 613 8,151<br />
US Dow Jones Index 12,269 11,257 8,977 7,558 8,372<br />
US 10-yr bond yield 3.9 3.9 3.3 2.7 3.3<br />
Source: US Treasury<br />
UK Unit Trusts<br />
US$m 3Q08 4Q08 1Q09 2Q09 3Q09<br />
59.2 58.7 55.1 55.5 55.3<br />
% of all <strong>Equities</strong> (251.7) (212.1) (199.4) (223.4) (240.0)<br />
17.5 19.3 20.0 19.5 19.2<br />
Funds Bonds (74.1) (69.9) (72.4) (78.5) (83.4)<br />
6.1 5.8 6.5 7.3 7.8<br />
% of Asia (x Japan) (15.4) (12.4) (13.0) (16.3) (18.7)<br />
59.7 59.7 59.7 59.7 59.7<br />
Equity Domestic (145.9) (116.8) (111.7) (125.3) (133.1)<br />
35.9 39.1 37.4 36.6 36.7<br />
Funds O<strong>the</strong>rs (90.4) (82.9) (74.7) (81.7) (88.1)<br />
Source: Association of unit Trusts and investment funds.<br />
Notes: Figures in paren<strong>the</strong>ses denote value of funds in pounds bn. 'O<strong>the</strong>rs' Category include<br />
US, Japan, International and emerging markets funds. 3Q'09 data up to Jul only.<br />
Page 38


