

Left Brain Right B - the DBS Vickers Securities Equities Research
Left Brain Right B - the DBS Vickers Securities Equities Research
Left Brain Right B - the DBS Vickers Securities Equities Research

Create successful ePaper yourself
Turn your PDF publications into a flip-book with our unique Google optimized e-Paper software.
Regional Equity Strategy 4Q 2009<br />
Strategy Overview: Asia Equity<br />
(Malaysia and Thailand, mainly) deficits reached 8%-10% of<br />
GDP.<br />
That changed in mid-97. When <strong>the</strong> baht broke from its basket,<br />
capital flight ensued in earnest and deficits turned to surplus<br />
overnight. Foreigners no longer wanted to lend and locals no<br />
longer wanted to borrow. Deficits jumped to surpluses<br />
equivalent to 8% of GDP in <strong>the</strong> Asia-8 (10% in <strong>the</strong> crisis-4)<br />
and averaged about 5% for <strong>the</strong> next decade.<br />
Although China garnered <strong>the</strong> headlines, it’s important to note<br />
that Asia’s current account surpluses were just a China affair –<br />
as a percentage of GDP, Asia’s surpluses were about <strong>the</strong> same<br />
whe<strong>the</strong>r China was included in <strong>the</strong> calculations or not.<br />
So what about <strong>the</strong> conventional wisdom that Asia’s growth<br />
has relied on running surpluses? And that absent those<br />
surpluses, growth will fall?<br />
Asia’s experience says <strong>the</strong> conventional wisdom has it<br />
backwards. Asia ran big deficits in P1 and its growth was<br />
above-average. It ran big surpluses in P2 and growth was much<br />
lower. The truth is, you don’t need surpluses to generate fast<br />
growth. In fact, <strong>the</strong>y hold you down. Why? All that surplus<br />
output could be driving local investment and faster growth at<br />
home ra<strong>the</strong>r than abroad. If you want fast growth, borrow<br />
from foreigners, don’t lend to <strong>the</strong>m.<br />
Capital inflow: Asia might have run big deficits in <strong>the</strong> precrisis<br />
period but inflows more than financed <strong>the</strong>m. Foreign<br />
reserves rose in spite of <strong>the</strong> deficits and currencies faced<br />
substantial appreciation pressure.<br />
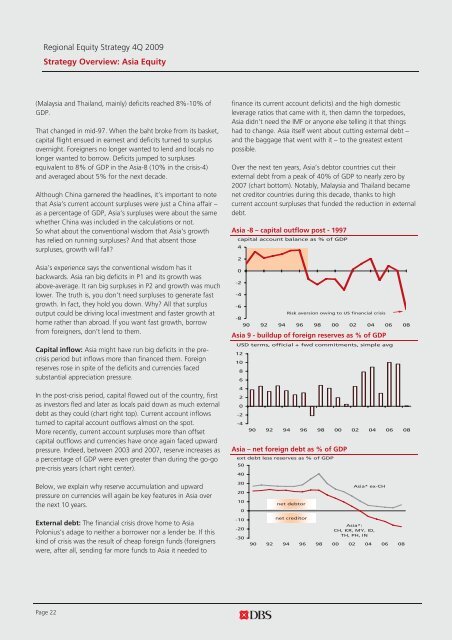
In <strong>the</strong> post-crisis period, capital flowed out of <strong>the</strong> country, first<br />
as investors fled and later as locals paid down as much external<br />
debt as <strong>the</strong>y could (chart right top). Current account inflows<br />
turned to capital account outflows almost on <strong>the</strong> spot.<br />
More recently, current account surpluses more than offset<br />
capital outflows and currencies have once again faced upward<br />
pressure. Indeed, between 2003 and 2007, reserve increases as<br />
a percentage of GDP were even greater than during <strong>the</strong> go-go<br />
pre-crisis years (chart right center).<br />
finance its current account deficits) and <strong>the</strong> high domestic<br />
leverage ratios that came with it, <strong>the</strong>n damn <strong>the</strong> torpedoes,<br />
Asia didn’t need <strong>the</strong> IMF or anyone else telling it that things<br />
had to change. Asia itself went about cutting external debt –<br />
and <strong>the</strong> baggage that went with it – to <strong>the</strong> greatest extent<br />
possible.<br />
Over <strong>the</strong> next ten years, Asia’s debtor countries cut <strong>the</strong>ir<br />
external debt from a peak of 40% of GDP to nearly zero by<br />
2007 (chart bottom). Notably, Malaysia and Thailand became<br />
net creditor countries during this decade, thanks to high<br />
current account surpluses that funded <strong>the</strong> reduction in external<br />
debt.<br />
Asia -8 – capital outflow post - 1997<br />
capital account balance as % of GDP<br />
4<br />
2<br />
0<br />
-2<br />
-4<br />
-6<br />
-8<br />
Risk aversion owing to US financial crisis<br />
90 92 94 96 98 00 02 04 06 08<br />
Asia 9 - buildup of foreign reserves as % of GDP<br />
USD terms, official + fwd commitments, simple avg<br />
12<br />
10<br />
8<br />
6<br />
4<br />
2<br />
0<br />
-2<br />
-4<br />
90 92 94 96 98 00 02 04 06 08<br />
Asia – net foreign debt as % of GDP<br />
ext debt less reserves as % of GDP<br />
50<br />
40<br />
Below, we explain why reserve accumulation and upward<br />
pressure on currencies will again be key features in Asia over<br />
<strong>the</strong> next 10 years.<br />
External debt: The financial crisis drove home to Asia<br />
Polonius’s adage to nei<strong>the</strong>r a borrower nor a lender be. If this<br />
kind of crisis was <strong>the</strong> result of cheap foreign funds (foreigners<br />
were, after all, sending far more funds to Asia it needed to<br />
30<br />
20<br />
10<br />
0<br />
-10<br />
-20<br />
-30<br />
net debtor<br />
net creditor<br />
Asia* ex-CH<br />
Asia*:<br />
CH, KR, MY, ID,<br />
TH, PH, IN<br />
90 92 94 96 98 00 02 04 06 08<br />
Page 22


