

Left Brain Right B - the DBS Vickers Securities Equities Research
Left Brain Right B - the DBS Vickers Securities Equities Research
Left Brain Right B - the DBS Vickers Securities Equities Research

Create successful ePaper yourself
Turn your PDF publications into a flip-book with our unique Google optimized e-Paper software.
Regional Equity Strategy 4Q 2009<br />
Strategy Overview: Asia Equity<br />
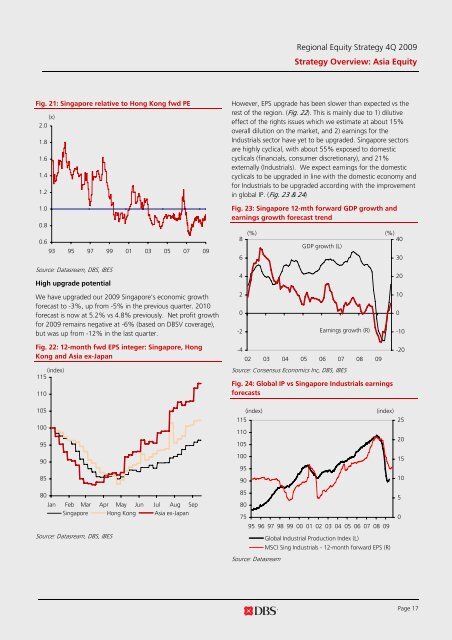
Fig. 21: Singapore relative to Hong Kong fwd PE<br />
(x)<br />
2.0<br />
1.8<br />
1.6<br />
1.4<br />
1.2<br />
1.0<br />
0.8<br />
0.6<br />
93 95 97 99 01 03 05 07 09<br />
However, EPS upgrade has been slower than expected vs <strong>the</strong><br />
rest of <strong>the</strong> region. (Fig. 22). This is mainly due to 1) dilutive<br />
effect of <strong>the</strong> rights issues which we estimate at about 15%<br />
overall dilution on <strong>the</strong> market, and 2) earnings for <strong>the</strong><br />
Industrials sector have yet to be upgraded. Singapore sectors<br />
are highly cyclical, with about 55% exposed to domestic<br />
cyclicals (financials, consumer discretionary), and 21%<br />
externally (Industrials). We expect earnings for <strong>the</strong> domestic<br />
cyclicals to be upgraded in line with <strong>the</strong> domestic economy and<br />
for Industrials to be upgraded according with <strong>the</strong> improvement<br />
in global IP. (Fig. 23 & 24)<br />
Fig. 23: Singapore 12-mth forward GDP growth and<br />
earnings growth forecast trend<br />
8<br />
6<br />
(%) (%)<br />
40<br />
GDP growth (L)<br />
30<br />
Source: Datasream, <strong>DBS</strong>, IBES<br />
High upgrade potential<br />
4<br />
20<br />
We have upgraded our 2009 Singapore's economic growth<br />
forecast to -3%, up from -5% in <strong>the</strong> previous quarter. 2010<br />
forecast is now at 5.2% vs 4.8% previously. Net profit growth<br />
for 2009 remains negative at -6% (based on <strong>DBS</strong>V coverage),<br />
but was up from -12% in <strong>the</strong> last quarter.<br />
2<br />
0<br />
-2<br />
Earnings growth (R)<br />
10<br />
0<br />
-10<br />
Fig. 22: 12-month fwd EPS integer: Singapore, Hong<br />
Kong and Asia ex-Japan<br />
(index)<br />
115<br />
110<br />
-4<br />
02 03 04 05 06 07 08 09<br />
Source: Consensus Economics Inc, <strong>DBS</strong>, IBES<br />
Fig. 24: Global IP vs Singapore Industrials earnings<br />
forecasts<br />
-20<br />
105<br />
100<br />
95<br />
(index)<br />
115<br />
110<br />
105<br />
(index)<br />
25<br />
20<br />
90<br />
85<br />
100<br />
95<br />
90<br />
15<br />
10<br />
80<br />
Jan Feb Mar Apr May Jun Jul Aug Sep<br />
Singapore Hong Kong Asia ex-Japan<br />
Source: Datasream, <strong>DBS</strong>, IBES<br />
85<br />
80<br />
75<br />
95 96 97 98 99 00 01 02 03 04 05 06 07 08 09<br />
Global Industrial Production Index (L)<br />
MSCI Sing Industrials - 12-month forward EPS (R)<br />
Source: Datasream<br />
5<br />
0<br />
Page 17


