Left Brain Right B - the DBS Vickers Securities Equities Research
Left Brain Right B - the DBS Vickers Securities Equities Research Left Brain Right B - the DBS Vickers Securities Equities Research
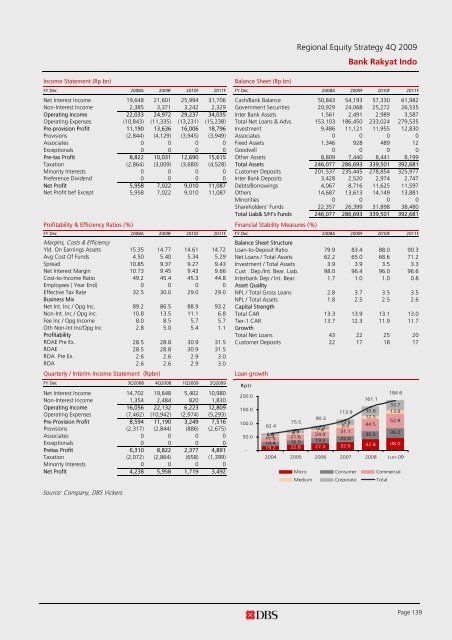
Income Statement (Rp bn) Balance Sheet (Rp bn) Regional Equity Strategy 4Q 2009 Bank Rakyat Indo FY Dec 2008A 2009F 2010F 2011F FY Dec 2008A 2009F 2010F 2011F Net Interest Income 19,648 21,601 25,994 31,706 Cash/Bank Balance 50,843 54,193 57,330 61,982 Non-Interest Income 2,385 3,371 3,242 2,329 Government Securities 20,929 24,068 25,272 26,535 Operating Income 22,033 24,972 29,237 34,035 Inter Bank Assets 1,561 2,491 2,989 3,587 Operating Expenses (10,843) (11,335) (13,231) (15,238) Total Net Loans & Advs. 153,103 186,450 233,024 279,535 Pre-provision Profit 11,190 13,636 16,006 18,796 Investment 9,486 11,121 11,955 12,830 Provisions (2,844) (4,129) (3,945) (3,949) Associates 0 0 0 0 Associates 0 0 0 0 Fixed Assets 1,346 928 489 12 Exceptionals 0 0 0 0 Goodwill 0 0 0 0 Pre-tax Profit 8,822 10,031 12,690 15,615 Other Assets 8,809 7,440 8,441 8,199 Taxation (2,864) (3,009) (3,680) (4,528) Total Assets 246,077 286,693 339,501 392,681 Minority Interests 0 0 0 0 Customer Deposits 201,537 235,445 278,854 325,977 Preference Dividend 0 0 0 0 Inter Bank Deposits 3,428 2,520 2,974 2,747 Net Profit 5,958 7,022 9,010 11,087 Debts/Borrowings 4,067 8,716 11,625 11,597 Net Profit bef Except 5,958 7,022 9,010 11,087 Others 14,687 13,613 14,149 13,881 Minorities 0 0 0 0 Shareholders' Funds 22,357 26,399 31,898 38,480 Total Liab& S/H’s Funds 246,077 286,693 339,501 392,681 Profitability & Efficiency Ratios (%) Financial Stability Measures (%) FY Dec 2008A 2009F 2010F 2011F FY Dec 2008A 2009F 2010F 2011F Margins, Costs & Efficiency Balance Sheet Structure Yld. On Earnings Assets 15.35 14.77 14.61 14.72 Loan-to-Deposit Ratio 79.9 83.4 88.0 90.3 Avg Cost Of Funds 4.50 5.40 5.34 5.29 Net Loans / Total Assets 62.2 65.0 68.6 71.2 Spread 10.85 9.37 9.27 9.43 Investment / Total Assets 3.9 3.9 3.5 3.3 Net Interest Margin 10.73 9.45 9.43 9.66 Cust . Dep./Int. Bear. Liab. 98.0 96.4 96.0 96.6 Cost-to-Income Ratio 49.2 45.4 45.3 44.8 Interbank Dep / Int. Bear. 1.7 1.0 1.0 0.8 Employees ( Year End) 0 0 0 0 Asset Quality Effective Tax Rate 32.5 30.0 29.0 29.0 NPL / Total Gross Loans 2.8 3.7 3.5 3.5 Business Mix NPL / Total Assets 1.8 2.5 2.5 2.6 Net Int. Inc / Opg Inc. 89.2 86.5 88.9 93.2 Capital Strength Non-Int. Inc / Opg inc. 10.8 13.5 11.1 6.8 Total CAR 13.3 13.9 13.1 13.0 Fee Inc / Opg Income 8.0 8.5 5.7 5.7 Tier-1 CAR 13.7 12.3 11.9 11.7 Oth Non-Int Inc/Opg Inc 2.8 5.0 5.4 1.1 Growth Profitability Total Net Loans 43 22 25 20 ROAE Pre Ex. 28.5 28.8 30.9 31.5 Customer Deposits 22 17 18 17 ROAE 28.5 28.8 30.9 31.5 ROA Pre Ex. 2.6 2.6 2.9 3.0 ROA 2.6 2.6 2.9 3.0 Quarterly / Interim Income Statement (Rpbn) FY Dec 3Q2008 4Q2008 1Q2009 2Q2009 Net Interest Income 14,702 19,648 5,402 10,980 Non-Interest Income 1,354 2,484 820 1,830 Operating Income 16,056 22,132 6,223 12,809 Operating Expenses (7,462) (10,942) (2,974) (5,293) Pre-Provision Profit 8,594 11,190 3,249 7,516 Provisions (2,317) (2,844) (886) (2,675) Associates 0 0 0 0 Exceptionals 0 0 0 0 Pretax Profit 6,310 8,822 2,377 4,891 Taxation (2,072) (2,864) (658) (1,399) Minority Interests 0 0 0 0 Net Profit 4,238 5,958 1,719 3,492 Source: Company, DBS Vickers Loan growth Rptr 200.0 150.0 100.0 50.0 - 184.6 161.1 33.7 113.9 30.8 13.8 90.3 12.5 75.5 19.8 52.9 62.4 44.5 12.0 8.4 4.7 9.9 7.4 31.1 24.4 30.5 36.2 2.9 8.5 17.5 21.6 14.4 16.5 19.2 22.0 19.2 22.8 27.3 32.6 42.8 48.0 2004 2005 2006 2007 2008 Jun-09 Micro Consumer Commercial Medium Corporate Total Page 139
Regional Equity Strategy 4Q 2009 Bukit Asam Bloomberg: PTBA IJ | Reuters: PTBA.JK BUY Rp14,800 JCI : 2,420.11 Price Target : 12-Month Rp 18,550 Potential Catalyst: Higher coal price Analyst Yusuf Winoto CFA +6221 3983 2668 yusuf.winoto@id.dbsvickers.com Domestic play • Beneficiary of rising domestic demand • Projects are underway to boost production • Plenty of reserves to support growth • BUY with Rp18,550 TP. Price Relative Rp 17,395 15,395 13,395 11,395 9,395 7,395 5,395 3,395 1,395 Relative Index 2005 2006 2007 2008 2009 Tambang Batubara (LHS) Relative JCI INDEX (RHS) Forecasts and Valuation FY Dec (Rp bn) 2008A 2009F 2010F 2011F Turnover 7,216 10,097 10,781 12,168 EBITDA 2,514 4,620 4,288 5,237 Pre-tax Profit 2,552 4,485 3,814 4,210 Net Profit 1,708 3,220 2,851 3,146 Net Pft (Pre Ex.) 1,708 3,220 2,851 3,146 EPS (Rp) 741 1,397 1,237 1,366 EPS Pre Ex. (Rp) 741 1,397 1,237 1,366 EPS Gth Pre Ex (%) 125 89 (11) 10 Diluted EPS (Rp) 741 1,397 1,237 1,366 Net DPS (Rp) 165 371 699 619 BV Per Share (Rp) 1,735 2,762 3,300 4,047 PE (X) 20.0 10.6 12.0 10.8 PE Pre Ex. (X) 20.0 10.6 12.0 10.8 P/Cash Flow (X) 19.2 10.3 11.2 9.6 EV/EBITDA (X) 12.4 6.7 7.6 6.6 Net Div Yield (%) 1.1 2.5 4.7 4.2 P/Book Value (X) 8.5 5.4 4.5 3.7 Net Debt/Equity (X) CASH CASH CASH 0.0 ROAE (%) 50.2 62.1 40.8 37.2 Earnings Rev (%): - - - Consensus EPS (Rp): 1,301 1,116 1,339 ICB Industry : Energy ICB Sector: Coal Principal Business: Coal Mining 431 381 331 281 231 181 131 81 Rising domestic demand. The 10,000MW coal-fired power plant expected to be completed by 2010 will raise coal demand by 35-40mn tons annually, on top of the current domestic consumption of c.50mn tons p.a. PTBA produces the type of coal that is suitable for use by power plants and its strong exposure to the domestic market (74% of total sales) will allow it to benefit directly from rising domestic demand. Boosting production with infrastructure and power plant projects. PTBA’s ongoing and future projects include enhancing its current transportation infrastructure (2 projects) and building up mine-mouth power plants (2 projects) that will utilize its vast coal reserves. These projects are slated for completion between 2012 and 2013, and will raise coal production by 36mn tons annually when fully completed. Note that PTBA has c.2bn tons of coal reserves and produces only 14.5m tons (FY09F) p.a. Thus, PTBA is well positioned to capture the growing domestic coal market. Reiterate BUY recommendation. Our target price for PTBA of Rp18,550 implies 15x FY10 PE. This is derived based on DCF valuation, and assuming 12.6% WACC (ERP=5%, RF=9.5%, LTG=0%). At A Glance Issued Capital (m shrs) 2,304 Mkt. Cap (Rpbn/US$m) 34,101 / 3,446 Major Shareholders Govt. of Indonesia (%) 65.0 Free Float (%) 35.0 Avg. Daily Vol.(‘000) 5,860 Source of all data: Company, DBS Vickers, Bloomberg Page 140 www.dbsvickers.com Refer to important disclosures at the end of this report ed: SGC / sa: TW
- Page 90 and 91: Regional Equity Strategy 4Q 2009 MT
- Page 92 and 93: Regional Equity Strategy 4Q 2009 Co
- Page 94 and 95: Regional Equity Strategy 4Q 2009 Co
- Page 96 and 97: Regional Equity Strategy 4Q 2009 Co
- Page 98 and 99: Regional Equity Strategy 4Q 2009 Co
- Page 100 and 101: Regional Equity Strategy 4Q 2009 Co
- Page 102 and 103: Regional Equity Strategy 4Q 2009 Co
- Page 104 and 105: Regional Equity Strategy 4Q 2009 Co
- Page 106 and 107: Regional Equity Strategy 4Q 2009 Co
- Page 108 and 109: Income Statement (RM m) Balance She
- Page 110 and 111: Regional Equity Strategy 4Q 2009 MI
- Page 112 and 113: Regional Equity Strategy 4Q 2009 Co
- Page 114 and 115: Regional Equity Strategy 4Q 2009 Co
- Page 116 and 117: Regional Equity Strategy 4Q 2009 Co
- Page 118 and 119: Regional Equity Strategy 4Q 2009 Co
- Page 120 and 121: Regional Equity Strategy 4Q 2009 Co
- Page 122 and 123: Regional Equity Strategy 4Q 2009 Co
- Page 124 and 125: Regional Equity Strategy 4Q 2009 Co
- Page 126 and 127: Regional Equity Strategy 4Q 2009 Si
- Page 128 and 129: Regional Equity Strategy 4Q 2009 Th
- Page 130 and 131: Regional Equity Strategy 4Q 2009 To
- Page 132 and 133: Regional Equity Strategy 4Q 2009 Co
- Page 134 and 135: Regional Equity Strategy 4Q 2009 Co
- Page 136 and 137: Regional Equity Strategy 4Q 2009 Co
- Page 138 and 139: Regional Equity Strategy 4Q 2009 Co
- Page 142 and 143: Income Statement (Rp bn) Balance Sh
- Page 144: Regional Equity Strategy 4Q 2009 2)
Income Statement (Rp bn)<br />
Balance Sheet (Rp bn)<br />
Regional Equity Strategy 4Q 2009<br />
Bank Rakyat Indo<br />
FY Dec 2008A 2009F 2010F 2011F FY Dec 2008A 2009F 2010F 2011F<br />
Net Interest Income 19,648 21,601 25,994 31,706 Cash/Bank Balance 50,843 54,193 57,330 61,982<br />
Non-Interest Income 2,385 3,371 3,242 2,329 Government <strong>Securities</strong> 20,929 24,068 25,272 26,535<br />
Operating Income 22,033 24,972 29,237 34,035 Inter Bank Assets 1,561 2,491 2,989 3,587<br />
Operating Expenses (10,843) (11,335) (13,231) (15,238) Total Net Loans & Advs. 153,103 186,450 233,024 279,535<br />
Pre-provision Profit 11,190 13,636 16,006 18,796 Investment 9,486 11,121 11,955 12,830<br />
Provisions (2,844) (4,129) (3,945) (3,949) Associates 0 0 0 0<br />
Associates 0 0 0 0 Fixed Assets 1,346 928 489 12<br />
Exceptionals 0 0 0 0 Goodwill 0 0 0 0<br />
Pre-tax Profit 8,822 10,031 12,690 15,615 O<strong>the</strong>r Assets 8,809 7,440 8,441 8,199<br />
Taxation (2,864) (3,009) (3,680) (4,528) Total Assets 246,077 286,693 339,501 392,681<br />
Minority Interests 0 0 0 0 Customer Deposits 201,537 235,445 278,854 325,977<br />
Preference Dividend 0 0 0 0 Inter Bank Deposits 3,428 2,520 2,974 2,747<br />
Net Profit 5,958 7,022 9,010 11,087 Debts/Borrowings 4,067 8,716 11,625 11,597<br />
Net Profit bef Except 5,958 7,022 9,010 11,087 O<strong>the</strong>rs 14,687 13,613 14,149 13,881<br />
Minorities 0 0 0 0<br />
Shareholders' Funds 22,357 26,399 31,898 38,480<br />
Total Liab& S/H’s Funds 246,077 286,693 339,501 392,681<br />
Profitability & Efficiency Ratios (%) Financial Stability Measures (%)<br />
FY Dec 2008A 2009F 2010F 2011F FY Dec 2008A 2009F 2010F 2011F<br />
Margins, Costs & Efficiency<br />
Balance Sheet Structure<br />
Yld. On Earnings Assets 15.35 14.77 14.61 14.72 Loan-to-Deposit Ratio 79.9 83.4 88.0 90.3<br />
Avg Cost Of Funds 4.50 5.40 5.34 5.29 Net Loans / Total Assets 62.2 65.0 68.6 71.2<br />
Spread 10.85 9.37 9.27 9.43 Investment / Total Assets 3.9 3.9 3.5 3.3<br />
Net Interest Margin 10.73 9.45 9.43 9.66 Cust . Dep./Int. Bear. Liab. 98.0 96.4 96.0 96.6<br />
Cost-to-Income Ratio 49.2 45.4 45.3 44.8 Interbank Dep / Int. Bear. 1.7 1.0 1.0 0.8<br />
Employees ( Year End) 0 0 0 0 Asset Quality<br />
Effective Tax Rate 32.5 30.0 29.0 29.0 NPL / Total Gross Loans 2.8 3.7 3.5 3.5<br />
Business Mix NPL / Total Assets 1.8 2.5 2.5 2.6<br />
Net Int. Inc / Opg Inc. 89.2 86.5 88.9 93.2 Capital Strength<br />
Non-Int. Inc / Opg inc. 10.8 13.5 11.1 6.8 Total CAR 13.3 13.9 13.1 13.0<br />
Fee Inc / Opg Income 8.0 8.5 5.7 5.7 Tier-1 CAR 13.7 12.3 11.9 11.7<br />
Oth Non-Int Inc/Opg Inc 2.8 5.0 5.4 1.1 Growth<br />
Profitability Total Net Loans 43 22 25 20<br />
ROAE Pre Ex. 28.5 28.8 30.9 31.5 Customer Deposits 22 17 18 17<br />
ROAE 28.5 28.8 30.9 31.5<br />
ROA Pre Ex. 2.6 2.6 2.9 3.0<br />
ROA 2.6 2.6 2.9 3.0<br />
Quarterly / Interim Income Statement (Rpbn)<br />
FY Dec 3Q2008 4Q2008 1Q2009 2Q2009<br />
Net Interest Income 14,702 19,648 5,402 10,980<br />
Non-Interest Income 1,354 2,484 820 1,830<br />
Operating Income 16,056 22,132 6,223 12,809<br />
Operating Expenses (7,462) (10,942) (2,974) (5,293)<br />
Pre-Provision Profit 8,594 11,190 3,249 7,516<br />
Provisions (2,317) (2,844) (886) (2,675)<br />
Associates 0 0 0 0<br />
Exceptionals 0 0 0 0<br />
Pretax Profit 6,310 8,822 2,377 4,891<br />
Taxation (2,072) (2,864) (658) (1,399)<br />
Minority Interests 0 0 0 0<br />
Net Profit 4,238 5,958 1,719 3,492<br />
Source: Company, <strong>DBS</strong> <strong>Vickers</strong><br />
Loan growth<br />
Rptr<br />
200.0<br />
150.0<br />
100.0<br />
50.0<br />
-<br />
184.6<br />
161.1<br />
33.7<br />
113.9 30.8 13.8<br />
90.3<br />
12.5<br />
75.5<br />
19.8<br />
52.9<br />
62.4<br />
44.5<br />
12.0 8.4<br />
4.7<br />
9.9 7.4 31.1<br />
24.4<br />
30.5<br />
36.2<br />
2.9 8.5<br />
17.5 21.6<br />
14.4 16.5 19.2 22.0<br />
19.2 22.8 27.3 32.6 42.8 48.0<br />
2004 2005 2006 2007 2008 Jun-09<br />
Micro Consumer Commercial<br />
Medium Corporate Total<br />
Page 139


