Sustainable Water Management Plan - Nillumbik Shire Council
Sustainable Water Management Plan - Nillumbik Shire Council
Sustainable Water Management Plan - Nillumbik Shire Council

You also want an ePaper? Increase the reach of your titles
YUMPU automatically turns print PDFs into web optimized ePapers that Google loves.
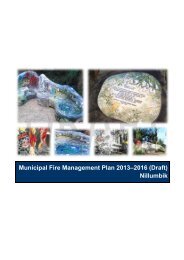
Graph 3: <strong>Council</strong>’s annual water consumption by facility type<br />
250000<br />
200000<br />
<strong>Council</strong>’s annual water consumption by facility type<br />
2000-01 2001-02 2002-03 2003-04 2004-05 2005-06<br />
Consumption (kL)<br />
150000<br />
100000<br />
5000<br />
Refer to graph 4<br />
0<br />
<strong>Water</strong> restrictions commenced in November 2001.<br />
The impact of restrictions on <strong>Council</strong>’s annual water<br />
consumption is seen in the years 2001-2002 and<br />
2004-2005 as consumption is lower than 2000-2001<br />
even though annual rainfall was lower. A very dry<br />
year in 2002-2003 resulted in an increase in water<br />
use. This is likely to be due to increased playing field<br />
maintenance.<br />
<strong>Water</strong> demand decreases over the past five years<br />
have occurred mainly in the areas of sports grounds,<br />
swimming pools and recreation centres, which are<br />
traditionally <strong>Council</strong>’s highest water consumers<br />
(Graph 3).<br />
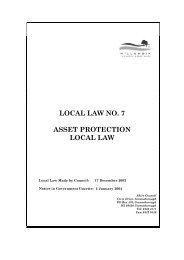
Graph 4: Annual water consumption at<br />
sportsgrounds vs rainfall<br />
Consumption (kL)<br />
160000<br />
140000<br />
120000<br />
100000<br />
8000<br />
6000<br />
4000<br />
2000<br />
0<br />
Administration<br />
Buildings<br />
sportsground<br />
(Source: Yarra Valley <strong>Water</strong>)<br />
Child Care Centres<br />
Annual consumption at sportsgrounds vs rainfall<br />
rainfall<br />
Community Centres<br />
Cultural buildings<br />
2000-01 2001-02 2002-03 2003-04 2004-05 2005-06<br />
Depots<br />
900<br />
800<br />
700<br />
600<br />
500<br />
400<br />
300<br />
200<br />
100<br />
0<br />
Rainfall (mm)<br />
Toilets<br />
Miscellaneous<br />
Nurseries<br />
Open Space<br />
Sportsgrounds<br />
Recreation Centres<br />
Graphs 3 and 4 indicate that the majority of <strong>Council</strong>’s<br />
water use occurs in sportsgrounds, swimming pools<br />
and recreation centres. Sportsgrounds are by far<br />
<strong>Council</strong>’s most significant water consumer, and have<br />
not been included in Graph 3, purely because the<br />
scale leaves trends in consumption at other facilities<br />
undetectable.<br />
The increased water consumption in 2002-2003 was<br />
due to course improvement works on six fairways at<br />
the Yarrambat Golf Course. These works required<br />
watering in of the new couch fairways.<br />
Sportsgrounds<br />
Sportsgrounds are <strong>Council</strong>’s highest water user, they<br />
were responsible for 55% of <strong>Council</strong>’s water use in<br />
2000-2001. <strong>Water</strong> use on <strong>Council</strong>’s sportsgrounds<br />
has decreased by 35,068 kilolitres or 33% over the<br />
past five years. <strong>Water</strong> required on sportsgrounds,<br />
and other open space areas, is dependant on rainfall<br />
and other climatic conditions. During the past five<br />
years, the annual rainfall dropped from 771 mm<br />
in 2000-2001 to 716.5mm in 2005-2006, which<br />
increased <strong>Council</strong>’s reliance on reticulated water<br />
for irrigation.<br />
In response to drought conditions, staged water<br />
restrictions were introduced in 2001 by the Victorian<br />
government. The impact of these restrictions on<br />
water consumption is shown clearly in Graph 3, with<br />
water consumption levels staying well below 2000-<br />
2001 levels for the following years.<br />
Residences<br />
Shopping Centres<br />
Swiiming Pools<br />
Significant water savings can be made through<br />
changes in irrigation practices, plant selection<br />
and the use of alternative water sources such as<br />
harvested stormwater.<br />
The installation of warm season grasses at the Ben<br />
Frilay playing field in Hurstbridge in 2006 will have<br />
a significant impact on reducing <strong>Council</strong>’s water use<br />
in this area. In addition, fairways at the Yarrambat<br />
Golf Course have been replaced over a three year<br />
program with warm season grass species.<br />
The <strong>Water</strong>Smart project is a significant project for<br />
sportsgrounds in <strong>Nillumbik</strong>. The project targets four<br />
playing fields and pavilions:<br />
• Coventry Oval, Diamond Creek<br />
• Eltham Central Oval<br />
• Eltham North Reserve Soccer Oval<br />
• Eltham North Oval.<br />
The <strong>Water</strong>Smart initiative involves five main<br />
components:<br />
• sportsground redevelopment<br />
• stormwater and rainwater harvesting<br />
• demonstration project/shared learning<br />
• improved ground management<br />
• promotion of water saving initiatives.<br />
The project is expected to reduce potable water<br />
consumption by 11.85 megalitres per year.<br />
Swimming pools<br />
Swimming pools are <strong>Council</strong>’s second highest water<br />
user, consuming approximately 11% of <strong>Council</strong>’s<br />
water use in 2000-2001. Maintenance of the pools<br />
through backwashing and make-up water is the main<br />
water usage at these facilities. <strong>Water</strong> use in pools<br />
has decreased from 21,662 kilolitres in 2000-2001 to<br />
16,928 kilolitres in 2005-2006, or 22% over the past<br />
five years, although use has increased over the past<br />
three years.<br />
Swimming pool facilities include the Diamond Creek<br />
Outdoor Swimming Pool and Eltham Leisure Centre.<br />
Significant water savings at Diamond Creek and<br />
Eltham Leisure Centre swimming pools have been<br />
made through changes in cleaning practices, pool<br />
maintenance procedures and the use of alternative<br />
water sources such as harvested rainwater.<br />
Recreation centres<br />
Recreation centres are <strong>Council</strong>’s third highest water<br />
using facility. <strong>Water</strong> usage in these facilities generally<br />
occurs in the showers, toilets, kitchen and bar areas.<br />
Recreation centres were responsible for 8% of<br />
<strong>Council</strong>’s water usage in 2000-2001. <strong>Water</strong> use in<br />
these facilities has decreased by 3,565 kilolitres or<br />
22% over the past five years. Buildings included are<br />
sports pavilions, bowling club rooms and sporting<br />
complexes.<br />
Significant water savings in recreation centres can<br />
be made through the installation of water saving<br />
appliances such as showerheads, AAA tap fittings,<br />
dual flush toilets, waterless urinals and the use<br />
of alternative water sources such as harvested<br />
rainwater for toilet flushing.<br />
16 <strong>Sustainable</strong> <strong>Water</strong> <strong>Management</strong> <strong>Plan</strong> <strong>Sustainable</strong> <strong>Water</strong> <strong>Management</strong> <strong>Plan</strong>