TAM III Brochure - TA Instruments
TAM III Brochure - TA Instruments
TAM III Brochure - TA Instruments

You also want an ePaper? Increase the reach of your titles
YUMPU automatically turns print PDFs into web optimized ePapers that Google loves.
<strong>TA</strong> <strong>Instruments</strong>
New Castle, DE USA<br />
Lindon, UT USA<br />
Elstree, United Kingdom<br />
Shanghai, China<br />
Beijing, China<br />
Taipei, Taiwan<br />
Tokyo, Japan<br />
Seoul, South Korea<br />
Bangalore, India<br />
Paris, France<br />
Eschborn, Germany<br />
Brussels, Belgium<br />
Etten-Leur, Netherlands<br />
Sollentuna, Sweden<br />
Milano, Italy<br />
Barcelona, Spain<br />
Melbourne, Australia<br />
Mexico City, Mexico
Isothermal Titration Calorimetry<br />
Nano ITC 3<br />
Technical Specifications 5<br />
ITC Technology 6<br />
Applications 9<br />
Differential Scanning Calorimetry<br />
Nano DSC 13<br />
Technical Specifications 15<br />
DSC Technology 16<br />
Automation 18<br />
Applications 20<br />
Isothermal Calorimetry<br />
Technical Specifications 24<br />
<strong><strong>TA</strong>M</strong> Technology 28<br />
Calorimeters 30<br />
Special Accessories 36<br />
<strong><strong>TA</strong>M</strong> Ampoules 40<br />
Applications 42<br />
Multi Cell DSC<br />
MC DSC 48<br />
Technical Specifications 50<br />
MC DSC Technology 52<br />
Applications 54
ISOTHERMAL TITRATION CALORIMETRY<br />
With the Nano ITC, heat effects as small as 100 nanojoules are<br />
detectable using one nanomole or less of biopolymer. The Nano ITC<br />
uses a solid-state thermoelectric heating and cooling system to<br />
precisely control temperature, and a unique removable syringe<br />
assembly for efficient and accurate delivery of titrant. The true isothermal<br />
power compensation design of the Nano ITC delivers ultra fast response<br />
times.<br />
The <strong>TA</strong> <strong>Instruments</strong> Nano ITC is engineered specifically for binding and<br />
kinetics studies on purified dilute biological samples of limited availability
4<br />
ITC SPECIFICATIONS
Specs Standard Volume Low Volume<br />
Temperature Range 2 to 80 °C 2 to 80 °C<br />
Temperature Stability ±0.0002 °C @ 25 °C ±0.0002 °C @ 25 °C<br />
Minimum detectable heat 0.1 μJ 0.05 μJ<br />
Maximum detectable heat 5,000 μJ 3,000 μJ<br />
Baseline Stability ±0.02 μW/hr ±0.02 μW/hr<br />
Noise Level 2.5 nW 1.4 nW<br />
Response Time 13 Seconds* 11 Seconds<br />
Cell Volume 1.0 ml 190 µL<br />
Cell Configuration Fixed-in-place, Cylindrical Fixed-in-place, Cylindrical<br />
Cell Material 24K Gold* or Hastelloy 24K Gold<br />
Injection Syringe Volumes 100 μL and 250 μL 50 μL<br />
5
ITC TECHNOLOGY<br />
Life Science professionals know that the thermodynamic driving<br />
forces of macro-molecular interactions are critical parameters for<br />
the design of effective biomedical and pharmaceutical treatments.<br />
Calorimetry has become the method of choice for characterizing<br />
the thermodynamic driving forces of critical molecular interactions<br />
and defining molecular stabilities. Calorimetric analyses are<br />
based on accurately measuring the rate of heat absorbed<br />
or evolved when the biomolecule of interest interacts specifically<br />
or nonspecifically with another macromolecule or ligand (binding<br />
studies). The <strong>TA</strong> <strong>Instruments</strong> Nano ITC Standard Volume or Nano<br />
ITC Low Volume instruments are powerful tools to accurately and<br />
efficiently perform these important measurements.<br />
The Nano ITC instruments are designed to improve laboratory<br />
productivity and efficiency by performing high-sensitivity analyses<br />
on nanomolar quantities of biomolecule. This is accomplished<br />
through a combination of a high sensitivity calorimeter, accurate<br />
and stable temperature control, and efficient titrant delivery.<br />
6
The unique removable syringe assembly contains a mechanical paddle stirrer<br />
at the end, the speed of which is easily adjusted to accommodate the<br />
physical properties of the sample. The integrated titration assembly of the<br />
Nano ITC ensures quick-filling, simple cleaning and accurate titrations.<br />
The Nano ITC Standard Volume is available with sample cells made from<br />
99.999 % Gold or Hastelloy C to allow for the widest range of reagent<br />
chemistry. The Nano ITC Low Volume is available with sample cell cells made<br />
from 99.999 % Gold.<br />
The true isothermal power compensation design and the choice of sample<br />
cell volumes of the Nano ITC instruments provides the highest sensitivity and<br />
flexibility for an ultrasensitive ITC analyzing biological samples in-solution.<br />
Thermoelectric Devices<br />
Cell Access Tubes<br />
Thermal Shield<br />
Sample/Reference Cells<br />
7
The Nano ITC instrument is available in two sample cell sizes. The<br />
Nano ITC Standard Volume sample cell volume is 1.0 ml. The Nano<br />
ITC Low Volume offers the lowest cell volume at 190 uL, to minimize<br />
sample consumption and at the same time provides sensitivity levels<br />
over two times better than previously achievable. Heat effects as small<br />
as 50 nanojoules are detectable in the Nano ITC Low Volume with a<br />
short term noise level of 1.4 nanowatts. Both Nano ITC instruments<br />
use cylindrical-shaped cells to make cleaning easy, solid state<br />
thermoelectric heating and cooling systems to precisely control<br />
temperature, and have the same flexible injection syringe assemblies<br />
for efficient and accurate delivery of titrant.<br />
Advantages<br />
The Nano ITC Low Volume requires substantially less sample and can<br />
reduce the time required to complete a titration by one-half. The 2X<br />
improvement in sensitivity of the Nano ITC Low Volume ensures that<br />
with 80% less sample the instrument will generate accurate and<br />
reproducible results.<br />
Nano ITC Low Volume:<br />
Sample Cell = KHCO 3 ; 0.36 mM<br />
Injection Syringe = HCl; 4.2 mM<br />
Injection volume = 1.4 μL<br />
Injection interval = 175 sec<br />
Nano ITC Standard Volume:<br />
Sample Cell = KHCO 3 ; 0.36 mM<br />
Injection Syringe = HCl; 5.6 mM<br />
Injection volume = 5 μL<br />
Injection interval = 300 sec<br />
Raw Heat Rate µJ/s<br />
-146<br />
-148<br />
-150<br />
-152<br />
-154<br />
-156<br />
Nano ITC Low Volume<br />
Total Titration Time: 2500 sec<br />
Nano ITC Standard Volume<br />
Total Titration Time: 5500 sec<br />
8<br />
-158<br />
0 1000 2000 3000 4000 5000 6000<br />
Time/s<br />
Low Volume<br />
Standard Volume
ITC APPLICATIONS<br />
-124<br />
Characterizing Binding Interactions by ITC<br />
All binding events are accompanied by the evolution or absorption<br />
of heat (a change in enthalpy, ΔH). In a single ITC experiment a full<br />
thermodynamic characterization of the binding reactions can be<br />
obtained. With the appropriate experimental design, fundamental<br />
information about the molecular interactions driving the process, as<br />
well as the stoichiometry of binding (n) and the binding constant<br />
(Ka) is generated. The first figure shows a typical incremental<br />
titration (20, 5 μL injections) of an inhibitor, 2’-CMP, titrated into<br />
RNase A; n = 1, K a = 1.69 x 10 6 M -1 , and ΔH = -58 kJ mol -1 .<br />
The second figure shows the same experiment, plotting the individual<br />
integrated peak areas vs the ratio of the two binding molecules.<br />
As the binding sites become saturated, the amount of heat produced<br />
with individual injections decreases. The resulting titration curve<br />
reveals valuable information on the enthalpy (ΔH), entropy (ΔS) and<br />
overall Gibbs free energy (ΔG) of the reaction taking place in the<br />
calorimeter. ITC is a powerful analytical tool and considered the<br />
most sensitive assay technique for characterizing the fundamental<br />
driving forces of molecular binding reactions.<br />
Raw Heat Rate (µJ)<br />
Area Data (µJ)<br />
-126<br />
-128<br />
-130<br />
-132<br />
-134<br />
-136<br />
0<br />
-50<br />
-100<br />
-150<br />
-200<br />
-250<br />
K= 1.69x10 6 M -1<br />
ΔH= -58.5 kJ mol -1<br />
n= 1.09<br />
exo<br />
0 1000 2000 3000 4000 5000 6000<br />
time /s<br />
-300<br />
-350<br />
-400<br />
0.0 0.2 0.4 0.6 0.8 1.0 1.2 1.4 1.6 1.8 2.0<br />
Ratio<br />
9
ITC APPLICATIONS<br />
-1<br />
Protein Interactions<br />
When two proteins interact and bind, conformational changes<br />
in the proteins, and rearrangement of the solvent in the vicinity<br />
of the binding site, result in the absorption or generation of<br />
heat. Quantification of this reaction heat by ITC provides a<br />
complete thermodynamic description of the binding interaction,<br />
the stoichiometry of binding, and the association constant. This<br />
figure contains the titration data of porcine pancreatic trypsin into<br />
soybean trypsin inhibitor using a Nano ITC. Twenty, 5 μL aliquots<br />
of ligand were titrated into the sample cell while the temperature<br />
of the system was maintained at 25 °C. Top panel: The signal<br />
(heat) produced following each addition of protein to the<br />
inhibitor. Bottom panel: Integration of the heats over the time<br />
course of the experiment; the μJ in each peak are plotted against<br />
the mole ratio of the titrant to inhibitor.<br />
Heat Rate (µJ/s)<br />
Peak Area (µJ)<br />
-0.8<br />
-0.6<br />
EXO<br />
-0.4<br />
-0.2<br />
0<br />
0 1000 2000 3000 4000 5000 6000<br />
Time(S)<br />
35<br />
30<br />
K a<br />
= 1.4 x 10 -7 M -1<br />
25<br />
ΔH= 135 kJ mol -1<br />
n = 1.15<br />
20<br />
15<br />
10<br />
5<br />
0<br />
0<br />
0.5 1 1.5 2 2.5<br />
[Trypsin] / [Soybean Trypsin Inhibitor]<br />
10
Characterization of Enzyme Kinetics<br />
Every reaction generates or absorbs heat, so every reaction can in<br />
principle be studied by calorimetry. In practice it has been shown<br />
that representative enzymes from every EC classification can be<br />
analyzed kinetically using ITC. In addition, ITC analyses are rapid,<br />
precise, nondestructive, compatible with both physiological and<br />
synthetic substrates, and are as sensitive as spectroscopic techniques<br />
but do not require a spectroscopic label or chemical tag. Importantly,<br />
ITC analyses of enzyme kinetics are also straightforward. The figure<br />
shows the hydrolysis of a single 10 μL injection of trypsin into a<br />
solution of BAEE in the absence (blue) and presence (red) of<br />
benzamidine, a competitive inhibitor. The area under both curves<br />
(representing the total heat output for complete conversion of<br />
substrate to product) is the same either in the presence or absence<br />
of inhibitor, allowing the KM and kcat of the reaction under both<br />
conditions to be calculated, as well as the inhibition constant.<br />
Continuous Single Injection<br />
Continuous single injection titration is an attractive alternative to the<br />
traditional incremental titration ITC for samples exhibiting very rapid<br />
binding reactions. These continuous injection experiments can be<br />
completed in less total time than normally required for a full set of<br />
incremental titrations. This technique provides accurate determinations<br />
of stoichiometry (n) and enthalpy (ΔH) for a wide range of<br />
binding constants. Continuous injection and incremental injection<br />
experiments can be performed in both the Nano ITC standard<br />
volume and low volume instruments with no alterations in hardware<br />
or software supplied with the instruments.<br />
Heat Rate / µW<br />
Heat Rate (µJ)<br />
2.5<br />
2<br />
1.5<br />
1<br />
0.5<br />
0<br />
10<br />
9<br />
8<br />
7<br />
6<br />
5<br />
4<br />
3<br />
2<br />
1<br />
0 500 1000 1500 2000 2500 3000<br />
Time/s<br />
Raw Data<br />
Fit<br />
K a<br />
= 1.12 x 10 6 M -1<br />
ΔH = -73.4 kJ mol -1<br />
n = 1.04<br />
3500 4000<br />
0<br />
200 300 400 500 600 700 800 900 1000<br />
Time (seconds)<br />
11
DIFFERENTIAL SCANNING CALORIMETRY<br />
The Nano DSC is specifically designed to determine<br />
the thermal stability and heat capacity of proteins<br />
and other macro-molecules in dilute solution, with<br />
the versatility and precision to perform molecular<br />
stability screening, ligand binding and pressure<br />
perturbation measurements.<br />
The <strong>TA</strong> <strong>Instruments</strong> Nano Series calorimeters represent<br />
the highest sensitivity and unmatched performance for<br />
the investigation of biological samples.
14<br />
DSC SPECIFICATIONS
Nano DSC Specifications<br />
Short-term Noise<br />
0.015 μWatts<br />
Baseline Stability<br />
±0.028 μWatts<br />
Response Time<br />
7 seconds<br />
Operating Temperature -10 °C to 130 °C or 160 °C<br />
Temperature Scan Rate<br />
0.05 °C to 2°C/minute<br />
Pressurization Perturbation<br />
Built-in up to 6 atmospheres<br />
Cell Volume<br />
0.30 ml<br />
Cell Geometry<br />
Fixed capillary<br />
Cell Composition<br />
Platinum<br />
Heat Measurement Type<br />
Power Compensation<br />
Automation Specifications<br />
Sample capacity<br />
Sample tray temperature control range<br />
Available Wash / Rinse Buffer Ports<br />
2 standard plates x 96 wells x 1000 μL / well<br />
4 °C to Ambient<br />
4 for Sample/Reference Cells; 2 for Sample Handling Syringe<br />
15
NANO DSC TECHNOLOGY<br />
The Nano DSC differential scanning calorimeter is designed to measure the amount of heat absorbed or released by dilute in-solution bio-molecules as they are<br />
heated or cooled. Macromolecules such as proteins respond to heating or cooling by unfolding at a characteristic temperature. The more intrinsically stable the<br />
biopolymer, the higher the midpoint temperature of the unfolding transition. As these processes often exchange microjoule levels of heat, the sensitivity of the<br />
Nano DSC is critical for successful investigation of the reaction.<br />
The Nano DSC obtains data with less sample than competitive designs and produces unmatched short term noise (±15 nanowatts) and baseline reproducibility<br />
(±28 nanowatts). Solid-state thermoelectric elements are used to precisely control temperature and a built-in precision linear actuator maintains constant or controlled<br />
variable pressure in the cell. Increased sample throughput is realized by adding on the Nano DSC Autosampler. It provides true walk-away capability for up to<br />
96 samples. With convenient USB connectivity, built-in pressure perturbation capability and capillary cell design, the Nano DSC provides maximum flexibility with<br />
a cell design that minimizes sample aggregation and precipitation, resulting in high quality data.<br />
Capillary Cell<br />
Cylindrical Cell<br />
16
Pressure Ring<br />
Nano DSC Capillary Cell<br />
The capillary design of the Nano DSC provides<br />
unparalleled sensitivity, accuracy and precision.<br />
Many structurally unstable samples that show<br />
aggregation and precipitation during a scan on<br />
competitive designs can be routinely analyzed<br />
on the Nano DSC.<br />
The Nano DSC employs solid-state thermoelectric<br />
elements to accurately and precisely<br />
control the temperature of the sample. This<br />
powerful temperature control and heat sensing<br />
architecture enables active control of both<br />
heating and cooling scans.<br />
The unique and innovative built-in high-pressure<br />
piston and pressure ring provides the highest<br />
flexibility with user-selectable functions for<br />
standard constant pressure experiments and<br />
pressure perturbation calorimetry (PPC)<br />
experiments with no extra hardware or software<br />
accessories required.<br />
The Nano DSC’s combination of a robust<br />
capillary cell design and state-of-the-art<br />
temperature control and sensor technology<br />
provides a reliable, flexible and easy-to-use<br />
calorimeter for in-solution biological samples.<br />
Top Plate<br />
Capillary Sample/Reference Cells<br />
Thermoelectric Device<br />
Thermal Shield<br />
17
NANO DSC AUTOMATION<br />
The Nano DSC Autosampler system enables true “start and walk away” capability<br />
without sacrificing either sensitivity or reliability. The autosampler stores samples and<br />
the matching buffers/solvents in a 96-well plate format at temperatures ranging from<br />
4°C to ambient room temperature. Four (4) wash/rinse solvents are accessible through<br />
programmable ports on the autosampler interface. Two (2) exit ports enable the<br />
collection of sample and matching buffer/solvent solutions from both the sample or<br />
reference cell of the Nano DSC.<br />
For molecular stability testing applications that require high sample throughput, the<br />
Nano DSC Autosampler system is a reliable sample handling system that increases<br />
the productivity of the most sensitive DSC on the market with true walk-away capability<br />
and proven reliability.<br />
The figure shows overlapping plots of DSC scans of duplicate samples of five different<br />
Lysozyme sample concentrations when converted to Molar Heat Capacity. The Nano<br />
DSC Autosampler system produces superior data reproducibility and precision at<br />
low sample concentrations with no detectable sample-to-sample carry-over or sample<br />
degradation.<br />
Molar Heat Capacity (kcal/mol-K)<br />
18<br />
16<br />
14<br />
12<br />
10<br />
8<br />
6<br />
44 46 48 50 52 54 56<br />
Temperature ˚C<br />
58 60 62 64<br />
18
Nano DSC Applications<br />
How much Protein is Required<br />
for a DSC Scan?<br />
Determining the thermodynamic parameters of a protein by<br />
differential scanning calorimetry (DSC) using the Nano DSC<br />
requires about the same amount of protein as surface<br />
plasmon resonance or fluorescence studies. Because of the<br />
Nano DSC’s extreme sensitivity and baseline reproducibility,<br />
and the sample cell’s small volume (300 μL), a complete,<br />
interpretable, accurate scan can be obtained on essentially<br />
any protein of interest. The sensitivity and accuracy of the<br />
Nano DSC is demonstrated by this data. Hen egg white<br />
lysozyme (in pH 4.0 glycine buffer) was prepared at various<br />
concentrations. As little as 2 μg of lysozyme in the capillary<br />
cell is sufficient to provide quality data yielding accurate<br />
values of all four thermodynamic parameters!<br />
Molar Heat Capacity<br />
2 µg<br />
5 µg<br />
10 µg<br />
25 µg<br />
50 µg<br />
100 µg<br />
400 µg<br />
55 60 65 70 75 80 85 90 90<br />
Temperature (˚C)<br />
Lysozyme Calorimetric van’t Hoff<br />
in cell (μg) ΔH (kJ mol -1 ) ΔS (kJ K -1 mol -1 ) T m (°C) ΔH (kJ mol -1 )<br />
400 512 1.46 78.0 515<br />
100 512 1.46 78.0 509<br />
50 517 1.47 77.9 513<br />
25 513 1.46 77.8 513<br />
10 515 1.47 78.0 515<br />
5 490 1.40 78.0 510<br />
2 503 1.43 77.8 499<br />
19
NANO DSC APPLICATIONS<br />
Characterization of Protein Stability<br />
Analyzing the stability of a protein in dilute solution involves<br />
determining changes in the partial molar heat capacity of the<br />
protein at constant pressure (ΔCp). The contribution of<br />
the protein to the calorimetrically measured heat capacity<br />
(its partial Cp) is determined by subtracting a scan of a buffer<br />
blank from the sample data prior to analysis. Heating the<br />
protein sample initially produces a slightly increasing<br />
baseline but as heating progresses, heat is absorbed by the<br />
protein and causes it to thermally unfold over a temperature<br />
range characteristic for that protein, giving rise to an<br />
endothermic peak. Once unfolding is complete, heat<br />
absorption decreases and a new baseline is established.<br />
After blank subtraction, the data can be analyzed to provide<br />
a complete thermodynamic characterization of the unfolding<br />
process.<br />
Characterization of Protein Structure<br />
Heat Flow / µW<br />
2<br />
1<br />
0<br />
-1<br />
-2<br />
-3<br />
-4<br />
-5<br />
-6<br />
baseline scans<br />
-7<br />
barnase scans<br />
-8<br />
30 40 50 60 70 80<br />
Temperature (˚C)<br />
exo<br />
DSC can be used to characterize both the specific binding<br />
of a ligand (for example, a drug to a receptor binding site),<br />
or nonspecific binding (for example, detergents binding to<br />
hydrophobic patches on a protein surface). In some instances<br />
ligand binding, even if to a specific receptor site, results in<br />
long-range protein structural rearrangements that destabilize<br />
the entire complex. The figure shows DSC scans of Ca 2+<br />
saturated bovine a-lactalbumin at various protein:Zn 2+ ratios<br />
scanned at 1 °C/min. The midpoint of the thermal unfolding<br />
of the protein decreases from 65 °C in the absence of Zn 2+<br />
to 35 °C at a protein:Zn 2+ ratio of 1:70. The enthalpy of<br />
unfolding is also decreased substantially by high Zn 2+<br />
concentrations.<br />
Excess Heat Capacity<br />
No zinc<br />
1:3.5<br />
1:14<br />
1:70<br />
30 40 50 60 70 80 90<br />
Temperature (˚C)<br />
20
Investigation of Protein-Ligand Binding<br />
DSC is a valuable tool for studying binding between a biological<br />
macromolecule and a ligand such as another biopolymer or a<br />
drug. Unlike ITC, DSC allows the thermo-dynamics that drive<br />
binding to be correlated with conformational changes in the<br />
macromolecule caused by the binding reaction. DSC is<br />
particularly useful for characterizing very tight or slow binding<br />
interactions. DSC also allows characterization of binding<br />
reactions that are incompatible with the organic solvent<br />
requirements of some ITC experiments (i.e., where ligand<br />
solubility for an ITC experiment requires concentrations of<br />
organic solvent not tolerated by the protein). The data shows<br />
DSC scans of RNase A bound with increasing concentrations of<br />
2’-CMP, showing that the protein is stabilized by higher<br />
concentrations of the inhibitor. Essentially identical data were<br />
obtained in the presence of 5% DMSO, verifying that organic<br />
solvents are compatible with the DSC technique.<br />
Nano DSC Capillary Cell Advantages<br />
This figure shows two DSC scans of matched samples of human<br />
IgG 1 at 0.5 mg/ml in physiological buffer. The data from<br />
the DSC with a “coin” shaped sample cell shows the easily<br />
recognizable exothermic aggregation/precipitation event at<br />
approx 89-90 °C, while the data collected on the Nano DSC<br />
with a capillary sample cell shows a stable post-transition<br />
baseline that will enable complete and accurate determinations<br />
of transition temperatures (Tm) and enthalpy (ΔH).<br />
Cp (kcal/K-mol)<br />
Heat Rate / µJ s -1<br />
18<br />
16 0 mM<br />
14<br />
12<br />
10<br />
8<br />
6<br />
4<br />
2<br />
0.05 mM<br />
0.075 mM<br />
0.15 mM<br />
0.3 mM<br />
0.75 mM<br />
1 mM<br />
1.25 mM<br />
1.5 mM<br />
0<br />
-2<br />
35 40 45 50 55 60 65 70 75 80 85<br />
Temperature<br />
50<br />
40<br />
30<br />
20<br />
10<br />
0<br />
Nano DSC with a Continuous Capillary Sample Cell<br />
DSC with a "coin" Shaped Sample Cell<br />
Precipitating Protein after unfolding<br />
Stable baseline<br />
after unfolding<br />
-10<br />
40 50 60 70 80 90 100 110<br />
Temperature (˚C)<br />
21
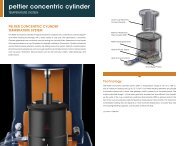
<strong><strong>TA</strong>M</strong> ISOTHERMAL MICROCALORIMETRY<br />
<strong><strong>TA</strong>M</strong> represents an ultra-sensitive heat flow measurement which is<br />
complementary to <strong>TA</strong> <strong>Instruments</strong> differential scanning calorimeters.<br />
Based on the pioneering Thermometric technology, <strong><strong>TA</strong>M</strong> offers<br />
maximum sensitivity, flexibility, and productivity. It can be used<br />
with the most sensitive microcalorimeters and a wide variety of<br />
accessories to control the experimental conditions.
<strong><strong>TA</strong>M</strong> lll SPECIFICATIONS<br />
<strong><strong>TA</strong>M</strong> <strong>III</strong> is the new generation, multi-channel, microcalorimetric<br />
system from <strong>TA</strong> <strong>Instruments</strong>. <strong><strong>TA</strong>M</strong> offers maximum sensitivity,<br />
flexibility, and performance. It can be used with the most<br />
sensitive microcalorimeters and a wide variety of accessories<br />
to precisely control the experimental conditions. Up to four<br />
independent calorimeters can be used simultaneously with<br />
<strong><strong>TA</strong>M</strong> <strong>III</strong>, to perform repetitive or different types of experiments.<br />
<strong><strong>TA</strong>M</strong> <strong>III</strong> is totally modular and enables multiple calorimeters<br />
to be added to increase sample capacity or functionality. With<br />
the addition of a multicalorimeter holding six independent<br />
minicalorimeters, the sample throughput is substantially<br />
increased. <strong><strong>TA</strong>M</strong> <strong>III</strong> employs patented thermostat technology<br />
to precisely control the liquid bath temperature to within<br />
0.0001 °C, and can be operated in isothermal, step-isothermal<br />
or temperature-scanning mode.<br />
24
Thermostat Specifications<br />
Thermal Media<br />
Oil<br />
Calorimeter Positions 1 - 4<br />
Temperature Range<br />
15 to 150 ˚C<br />
Accuracy < ± 0.1 °C<br />
Long Term Stability<br />
< ± 100 μK/24h<br />
Short Term Stability<br />
< ± 10 μK (p-p)<br />
Scanning Rate<br />
< ± 2 °C/h (between 20 - 150 °C)<br />
Step-wise Change of Temperature<br />
Heating 15°C/h at 15 °C - 2°C/h at 150 °C<br />
Cooling 15 °C/h at 150 °C - 1.5 °C/h at 15 °C<br />
Calorimeter Specifications<br />
CALORIMETER SHORT TERM NOISE BASELINE DRIFT ACCURACY PRECISION<br />
Nanocalorimeter < ± 10 nW < 40 nW/24 h < 2% ± 100 nW<br />
Minicalorimeter / Multi 4ml < ± 100 nW < 200 nW/24 h < 5% ± 200 nW<br />
Microcalorimeter 20ml < ± 100 nW < 200 nW/24 h < 2% ± 100 nW<br />
Minicalorimeter/Multi 20 ml < ± 300 nW 1 μW/ 24 h < 2% ± 300 nW<br />
Macrocalorimeter 100 J:0.02%<br />
Q < 50 J:
<strong><strong>TA</strong>M</strong> 48 SPECIFICATIONS<br />
The <strong><strong>TA</strong>M</strong> 48 is a special version of the <strong><strong>TA</strong>M</strong> <strong>III</strong> thermostat with unique features designed to<br />
maximize sample throughput without sacrificing data quality. Up to 48 independent<br />
minicalorimeters can be operated simultaneously with the <strong><strong>TA</strong>M</strong> 48, to perform different<br />
experiments in each of the 48 calorimeters or to perform repeat experiments simultaneously.<br />
The design accommodates minicalorimeters in batches of 12. The <strong><strong>TA</strong>M</strong> 48 employs patented<br />
thermostat technology to precisely control the liquid bath temperature to within 0.0001 °C,<br />
and can be operated in isothermal, step-isothermal or temperature-scanning mode.<br />
26
Thermostat Specifications<br />
Thermal Media<br />
Oil<br />
Calorimeter Positions 1 - 48<br />
Temperature Range<br />
15 to 150 ˚C<br />
Accuracy < ± 0.1 °C<br />
Long Term Stability<br />
< ± 100 μK/24h<br />
Short Term Stability<br />
< ± 10 μK (p-p)<br />
Scanning Rate<br />
< ± 2°C/h (between 20 - 150 °C)<br />
Step-wise Change of Temperature<br />
Heating 15°C/h at 15 °C - 2°C/h at 150 °C<br />
Cooling 15°C/h at 150 °C - 1.5°C/h at 15 °C<br />
Calorimeter Specifications<br />
CALORIMETER SHORT TERM NOISE BASELINE DRIFT ACCURACY PRECISION<br />
Minicalorimeter / Multi < ± 100 nW < 200 nW/24 h < 5% ± 200 nW<br />
27
<strong><strong>TA</strong>M</strong> TECHNOLOGY<br />
Thermal Activity Monitor<br />
All chemical, physical and biological processes result in either heat production or heat consumption. Microcalorimetry is a<br />
versatile technique for studying this thermal activity in terms of heat, heat flow and heat capacity. <strong><strong>TA</strong>M</strong> <strong>III</strong> offers unmatched<br />
sensitivity, long-term stability and high measuring capacity. The modular design, coupled with a wide range of accessories<br />
and auxiliary equipment, offers unrivaled flexibility.<br />
Microcalorimetry can be completely nondestructive and non-invasive to the sample. It seldom requires any prior sample<br />
treatment nor does it limit analysis to a physical state of the sample. Solids, liquids and gases can all be investigated.<br />
Microcalorimetry does not require that a sample has a particular characteristic to enable measurement like FTIR, UV-Vis,<br />
NMR etc. Microcalorimetry is a direct and continuous measurement of the process under study. Unlike other analytical<br />
techniques that give “snapshots” of data, microcalorimetry gives real-time data continuously as the process proceeds.<br />
Heat Flow<br />
All of the calorimeters available for <strong><strong>TA</strong>M</strong> <strong>III</strong> are of the heat flow type except for the solution calorimeter, which is a semiadiabatic<br />
calorimeter. A heat flow calorimeter works by channeling the heat produced or consumed by a reaction in the<br />
sample through heat flow sensors comprised of thermoelectric modules. When a temperature gradient is imposed across<br />
the thermoelectric module, a voltage is created in accordance with the Seebeck effect. This voltage is proportional to the<br />
heat flow through the thermoelectric module and hence proportional to the rate of heat production or consumption by the<br />
sample. One side of the thermoelectric module is in contact with the sample and the other is kept isothermal by a heat sink<br />
which is in contact with the <strong><strong>TA</strong>M</strong> <strong>III</strong> thermostat. Because of the excellent stability of the <strong><strong>TA</strong>M</strong> <strong>III</strong> thermostat, even over long<br />
periods of time, <strong><strong>TA</strong>M</strong> <strong>III</strong> maintains outstanding sensitivity. All the heat flow calorimeters are of the twin type, consisting of<br />
both a sample and a reference side. The measured property is the difference in heat flow between sample and reference.<br />
The twin principle reduces baseline noise by eliminating any small fluctuations of the thermostat.<br />
Power Compensation<br />
<strong><strong>TA</strong>M</strong> <strong>III</strong> can also operate in a power compensation mode. A constant electrical power is applied to the calibration heaters<br />
of the sample and reference sides of the calorimeter. If the temperature of the sample increases or decreases due to a reaction<br />
or physical event, the heater on the sample side is compensated to keep the sample and reference at the same temperature.<br />
The power compensation mode results in a much faster response time making the calorimeters ideal for high resolution<br />
while monitoring rapid processes. (Power compensation mode is not currently available with the minicalorimeter).<br />
Nanocalorimeter<br />
28
Sample Side<br />
Heat Detectors<br />
Heat Sink<br />
Intermediate Heat Sink<br />
Reference Side<br />
High Performance Temperature Control and Stability<br />
The <strong><strong>TA</strong>M</strong> <strong>III</strong> thermostat is a liquid-based system, utilizing a mineral oil to<br />
quickly dissipate heat and minimize temperature gradients in the system.<br />
Efficient circulation of the liquid also permits precise temperature changes<br />
to be made. Temperature is controlled by a unique, patented regulation<br />
system. The average temperature fluctuation of <strong><strong>TA</strong>M</strong> <strong>III</strong> is better than<br />
± 10 μK over the range 15 to 150 °C. The drift over 24 hours is within<br />
±100 μK. The unmatched stability of the <strong><strong>TA</strong>M</strong> <strong>III</strong> thermostat contributes<br />
to a perfect environment for isothermal and temperature scanning<br />
measurements (minicalorimeter). The thermostat is controlled by the<br />
software dedicated to <strong><strong>TA</strong>M</strong> <strong>III</strong> – <strong><strong>TA</strong>M</strong> Assistant.<br />
Isothermal<br />
This is the classical mode for microcalorimetric experiments. The liquid<br />
thermostat is maintained at constant temperature for the duration of the<br />
experiment. Any heat generated or absorbed by the sample due to<br />
a chemical or physical process is continuously measured. Isothermal<br />
measurements give quantitative and continuous data reflecting the rate of<br />
the process under study.<br />
Step Isothermal<br />
Step isothermal experiments can be performed on the same sample at<br />
different temperatures. During the isothermal phases, the same signal<br />
stability and sensitivity is achieved as with conventional isothermal<br />
experiments. During the temperature transition phases, heat flow<br />
is recorded to monitor how the sample is affected by the change in<br />
temperature. This mode is useful for the study of heat capacity and<br />
temperature dependence of chemical reactions.<br />
29
NANOCALORIMETER<br />
Heat Detector System of the Nanocalorimeter<br />
The Nanocalorimeter contains two heat detectors (thermoelectric modules) on<br />
the sample side and two on the reference side. The heat detectors are positioned<br />
on the inner side of the ampoule holder in between the ampoule holder and a<br />
surrounding heat sink (aluminum).<br />
A foil heater is surrounding two alternate sides and the bottom of the ampoule<br />
holder and is used for calibration and power compensation. A known electrical<br />
power can be produced and controlled by <strong><strong>TA</strong>M</strong> <strong>III</strong>.<br />
Active heat sink control is used in order to reduce the time constant of the<br />
calorimeter and reduce the time needed to reach thermal equilibrium after a<br />
change in temperature.<br />
Nanocalorimeter<br />
The Nanocalorimeter is the most sensitive calorimeter for <strong><strong>TA</strong>M</strong> <strong>III</strong>, and is typically<br />
used in the isothermal mode. It combines high sensitivity with excellent baseline<br />
stability which makes it ideal for isothermal titration calorimetry (ITC) in studying<br />
molecular interactions. The nanocalorimeter holds all closed ampoules up to<br />
5 ml. For highest sensitivity it is used with the 1 ml titration ampoule and a similar<br />
ampoule as reference. This reference ampoule contains an inert substance,<br />
(e.g. water or sand) in order to balance the heat capacity of the two sides.<br />
30
MICROCALORIMETER<br />
Microcalorimeter – 20 ml<br />
The 20 ml Microcalorimeter is a heat flow calorimeter of twin type. It has been<br />
designed to hold large samples, (e.g. batteries) and for experiments requiring a<br />
large gas phase above the sample. The microcalorimeter can be used with all<br />
20 ml static ampoules and the 20 ml micro reaction system including titration<br />
facilities and control of the relative humidity during measurement.<br />
The 20 ml Microcalorimeter is also the only calorimeter that can be used with<br />
the micro solution ampoule. This ampoule is designed for dissolution of very small<br />
amounts of solids (a few mg) in different solvents and is ideal for dissolution of<br />
slowly soluble substances. The heat of dissolution and the kinetics of dissolution<br />
can be studied.<br />
31
MINICALORIMETER<br />
Minicalorimeter – 4 ml<br />
The Minicalorimeter is a 4 ml Microcalorimeter with a special design to reduce<br />
the space occupied by the calorimeter inside the thermostat. The reference is<br />
positioned below the sample ampoule which allows up to 48 Minicalorimeters<br />
to be positioned in the thermostat.<br />
The Minicalorimeter is used in the Multicalorimeter and in the <strong><strong>TA</strong>M</strong> 48 thermostat.<br />
It has been designed for increased sample throughput and is recommended for<br />
compatibility and stability testing.<br />
Minicalorimeter – 20 ml<br />
The 20 ml minicalorimeter is of similar design as the 4 ml minicalorimeter to<br />
allow for larger samples to be measured. The 20 ml minicalorimeter is used in a<br />
20 ml multicalorimeter in the <strong><strong>TA</strong>M</strong> <strong>III</strong>.<br />
32
MULTICALORIMETER<br />
Multicalorimeter – 4 ml<br />
The <strong><strong>TA</strong>M</strong> Multicalorimeter contains six Minicalorimeters. It is intended for use<br />
with the <strong><strong>TA</strong>M</strong> <strong>III</strong> thermostat to increase the sample throughput. The <strong><strong>TA</strong>M</strong> <strong>III</strong><br />
thermostat can hold up to 24 individual calorimeters, as well as other types of<br />
calorimeters such as a Nanocalorimeter or a Precision Solution Calorimeter.<br />
These combinations offer the highest flexibility by combining high sensitivity<br />
with high sample throughput. It can be used for all applications designed for<br />
individual Minicalorimeters.<br />
Multicalorimeter – 20 ml<br />
The 20 ml multicalorimeter consists of three individual 20 ml minicalorimeters.<br />
The multicalorimeter occupies one position in a <strong><strong>TA</strong>M</strong> <strong>III</strong>. It is an alternative to the<br />
20 ml microcalorimeter offering higher sample throughput, with three individual<br />
calorimeters. This is the only calorimeter to be used with the 20 ml vacuum/<br />
pressure ampoule, in which simultaneous measurements of heat flow and<br />
pressure in the ampoule could be performed.<br />
33
MACROCALORIMETER<br />
The Macrocalorimeter is a high sensitivity large volume calorimeter. The<br />
cylindrical sample chamber will accommodate 125 mL screw-cap, glass<br />
ampoules for liquid or solid samples, as well as a wide variety of battery<br />
fixtures for accurate and reproducible static discharge and charge-discharge<br />
heat flow measurements. Similar in design to the single sample-abovereference<br />
minicalorimeter, the Macrocalorimeter has baseline stability and<br />
short term noise performance that will ensure the widest application flexibility<br />
with the possibility to match the reference with the sample for optimum<br />
performance.<br />
34
MACROCALORIMETER APPLICATIONS<br />
Open-Circuit Discharge Thermogram<br />
for Li-ion 18650 Battery<br />
The open-circuit heat rate for a 2600mAh Li-Ion 18650 3.7V battery<br />
(Blue) and Blank-Control (Black) at 25°C. The fit to calculate mean<br />
and standard deviation for the Li-Ion 18650 Battery and Blank-<br />
Control is overlaid with each raw data set (straight line).<br />
The variation in the Blank-Control data is caused by variation in<br />
room temperature. Data and graphic analysis performed with the<br />
<strong><strong>TA</strong>M</strong> Assistant software package.<br />
Heat Flow (µ W)<br />
60<br />
40<br />
20<br />
0<br />
Li-Ion 18650 Battery<br />
Average Heat Rate: 54.3 µ w<br />
Standard Deviation: 0.74 µ w<br />
Blank-Control<br />
Average Heat Rate: 0.8 µ w<br />
Standard Deviation: 2.09 µ w<br />
14<br />
16 18 20 22 24 26<br />
Time (h)<br />
Static Self Discharge of Batteries<br />
in Macrocalorimeter<br />
Battery quality and stability is easily evaluated in a <strong><strong>TA</strong>M</strong> <strong>III</strong><br />
Macrocalorimeter by conducting an isothermal calorimetric<br />
evaluation of the heat rate during static discharge. Cell 1 shows the<br />
50 μW heat rate generated from an intact good battery during static<br />
discharge. Cell 2 shows the 180 μW heat rate from a bad battery<br />
during a static discharge. Two calibration pulses of 50 μW and<br />
200 μW were performed immediately following the battery testing.<br />
The reproducibility and accuracy of this data is critical when<br />
evaluating battery component compatibility, overall battery<br />
characteristics and accurate predictions of shelf life stability.<br />
Heat Flow (µ W)<br />
250<br />
200<br />
150<br />
100<br />
50<br />
0<br />
-50<br />
Cell 1<br />
Cell 2<br />
Baseline<br />
Calibration<br />
Set 199.9 µ W<br />
Calibration<br />
Set 50.8 µ W<br />
0 10 20 30 40 50 60<br />
Time (h)<br />
35
ITC ACCESSORY<br />
Titration Calorimetry<br />
Isothermal Titration Calorimetry requires the highest level of calorimetric<br />
sensitivity and stability, efficient titrant delivery, and a user-friendly<br />
platform which facilitates easy cleanup and rapid turnaround.<br />
Employing unique and proprietary technology, the <strong><strong>TA</strong>M</strong> <strong>III</strong> is the ideal<br />
system for Isothermal Titration Calorimetry as well as for the study of<br />
drug effect on living cells, i.e. using microcalorimetry as a bioassay.<br />
The <strong><strong>TA</strong>M</strong> Isothermal Titration Calorimetry (<strong><strong>TA</strong>M</strong> ITC) system consists of<br />
a nanocalorimeter, 1 ml removable titration ampoule with stirring<br />
facilities, and a precision syringe pump for efficient titrant delivery.<br />
Titration calor imeters with 4 and 20ml removable titration ampoules<br />
are also available. The <strong>TA</strong> <strong>Instruments</strong> nanocalorimeter is the most<br />
sensitive calorimeter available for <strong><strong>TA</strong>M</strong> <strong>III</strong>, and can readily detect<br />
microjoule level heat flow. In power compensation mode, the response<br />
time of the calorimeter is optimized, and the temperature of the sample<br />
is held virtually isothermal.<br />
36
Titration Ampoule<br />
The removable ampoules offer a level of flexibility unmatched in the<br />
industry. Ampoules are easily removed and cleaned outside of the<br />
instrument. It allows visual inspection before and after an experiment.<br />
The open vessels of <strong><strong>TA</strong>M</strong> ITC ampoules also allows solid suspensions,<br />
solid matrixes with attached living cells, macromolecules, etc. to be<br />
loaded into the reaction vessel. This allows ligand binding to the solid<br />
system to be measured. There is no possibility for this kind of matrix<br />
experiment to be run on fixed-cell instruments.<br />
In <strong><strong>TA</strong>M</strong> ITC different sizes of syringes ranging from 100 μL to 2.5 ml<br />
are available. The injections volumes/flow are controlled by a<br />
high precision syringe pump. Each pump can support two syringes.<br />
In addition, two pumps can be attached to one titration ampoule<br />
which is useful for studying enzyme kinetics. This option is not<br />
available in competitive designs.<br />
37
PERFUSION CALORIMETRY<br />
Perfusion Ampoule<br />
The perfusion ampoule is the simplest micro reaction system available, and is<br />
typically used with the Nanocalorimeter. A liquid or gas is perfused through the<br />
ampoule and out through an exit tube. Gases are perfused using a mass flow<br />
controller that is controlled by <strong><strong>TA</strong>M</strong> Assistant software. Liquids are perfused<br />
using a peristaltic pump. The perfusion ampoule can be used to measure either<br />
the heat production rate from a flowing gas/liquid or the effect of the gas/liquid<br />
on a sample placed in the perfusion ampoule. The perfusion ampoule is available<br />
in 1, 4 and 20 ml versions.<br />
RH Perfusion Ampoule<br />
The RH perfusion ampoule perfuses a gas of defined relative humidity over a<br />
sample and out through an exit tube. The relative humidity is controlled using<br />
two mass flow controllers, one of which passes gas directly to the sample and<br />
the other passes gas through two humidifying chambers prior to the sample. <strong><strong>TA</strong>M</strong><br />
Assistant software controls both the relative humidity and the total flow rate<br />
over the sample. The software is also used to change the humidity in a linear<br />
ramp or stepwise. The RH perfusion ampoule is available in 1, 4 and 20 ml<br />
versions. It is possible to use solvents other than water in the humidifying<br />
chambers which allows a gas of varying vapor pressure of a solvent to be passed<br />
over a sample.<br />
Perfusion Ampoule<br />
RH Perfusion Ampoule<br />
38
PRECISION SOLUTION CALORIMETRY<br />
Solution Calorimetry refers to the determination of the heat of dissolution when<br />
a solid is dissolved in a liquid, or two liquids are mixed.<br />
The <strong><strong>TA</strong>M</strong> Precision Solution Calorimeter is a single-position, semi-adiabatic<br />
calorimeter for high precision measurements of the heat generated or consumed<br />
when a solid or liquid sample is dissolved or diluted into a solvent. The instrument<br />
is designed for highest accuracy and precision and is used in general thermodynamic<br />
investigations as well as for quantitative analytical measurements of<br />
various solid state phases. It is available with a 25 ml or 100 ml vessel, and is<br />
intended for use with the <strong><strong>TA</strong>M</strong> <strong>III</strong> thermostat up to 80 °C.<br />
39
<strong><strong>TA</strong>M</strong> AMPOULES<br />
<strong><strong>TA</strong>M</strong> Ampoules are used to contain the sample in the calorimeter during<br />
measurement. The ampoules are of two basic types; Closed and Open. In the<br />
Closed ampoules, no manipulation to the sample is done during the measurement.<br />
In the Open ampoules, also referred to as the Micro Reaction System,<br />
the sample can be manipulated after insertion into the calorimeter.<br />
Disposable Crimp Seal Ampoules<br />
Disposable ampoules are the most convenient to use since they can be thrown<br />
away after use and no cleaning is required. The crimp seal ampoule is perfect<br />
for experiments at lower temperature ranges. They are available in 3, 4 and<br />
20 ml sizes.<br />
Stainless Steel Ampoules<br />
Available in regular stainless steel or hastelloy, these ampoules are used for<br />
samples that either react with glass, are to be investigated at high temperatures,<br />
or where it is suspected that a gas will be evolved during the experiment which<br />
increases the pressure in the ampoule. Ampoule lids are screw top and are<br />
available in 4 and 20 ml sizes.<br />
Vacuum/Pressure Ampoules<br />
These steel ampoules in stainless are designed to hold vacuum or pressure up<br />
to 10 bar. The pressure in the ampoule can be monitored at the same time heat<br />
flow is measured. This is ideal for the study of samples generating gaseous<br />
products during a reaction. The ampoule is available in 4 and 20 ml sizes.<br />
Heat Seal Ampoules<br />
The heat seal ampoules are sealed by melting the glass at the top of the<br />
ampoule. These are recommended when rubber caps would be affected by<br />
gases or liquids involved in a reaction. The reactants are completely surrounded<br />
by glass. They are available for a maximum sample volume of 5 ml.<br />
SolCal Ampoules<br />
These ampoules are used with the Precision Solution Calorimeter and are also<br />
referred to as crushing ampoules. They are made from glass with a volume of<br />
1.1 ml. The most common SolCal ampoule is the crushing ampoule with<br />
stopper. This is preferably used for solid sample dissolution into water. The<br />
ampoule is sealed with a rubber stopper and wax. Heat seal crushing<br />
ampoules can be used if reactivity is an issue.<br />
40
Stainless Steel Ampoules<br />
Disposable Crimp Seal Ampoules<br />
20ml Ampoules<br />
Heat Seal Ampoules<br />
SolCal Ampoules<br />
41
PHARMACEUTICALS APPLICATIONS<br />
Polymorph Screening<br />
An estimated 80% of pharmaceutical compounds exhibit polymorphism.<br />
Pharmaceutical scientists must be diligent to screen for<br />
potential polymorphic transformations which may affect the<br />
bioavailability of the compound. The selection of the appropriate<br />
crystalline form requires a thorough and systematic approach to<br />
polymorphism screening. While a lack of chemical change can<br />
pose a problem for many analytical probes, <strong><strong>TA</strong>M</strong> can be used<br />
to successfully monitor this type of process continually over time at<br />
or near typical storage temperature. This figure illustrates the<br />
isothermal transformation of alfa-tripalmitin to beta-tripalmitin,<br />
at 35 °C over 50 hours. The yellow line shows calculated results<br />
from powder X-ray diffraction, and the orange line shows heat flow.<br />
<strong><strong>TA</strong>M</strong> data clearly mimics the calculated data from X-ray diffraction<br />
and can do so continuously throughout the course of the reaction.<br />
Pharmaceutical Compatibility<br />
<strong><strong>TA</strong>M</strong> <strong>III</strong> is an ideal screening tool for pharmaceutical compatibility<br />
trials. Like stability screening, compatibility screening can be<br />
performed at ambient temperatures and humidities without the need<br />
to dissolve or physically alter the sample prior to analysis. An<br />
experiment typically takes only a few hours as opposed to<br />
conventional HPLC which can take many weeks or months.<br />
The data shows the response of an amine-lactose interaction at<br />
different temperatures with 20% water added. The amine and<br />
lactose are very incompatible together. Only a small response was<br />
seen at 30 °C (A) with an increasing signal as the temperature of<br />
measurement is increased to 40 °C (B) and 50 °C (C). The inset<br />
Arrhenius plot confirms that all three temperature points fall on a<br />
straight line which is a strong indication that the same process is<br />
happening in all three experiments.<br />
Heat flow (µW/g)<br />
Heat Flow (µ W/g)<br />
P (µW/g) (%)<br />
1000 100<br />
exo<br />
800<br />
80<br />
600<br />
400<br />
200<br />
60<br />
40<br />
20<br />
0<br />
0<br />
0<br />
Ln (power)<br />
4<br />
2<br />
0<br />
10<br />
-2<br />
0.00310<br />
0.00315<br />
0.00320<br />
0.00325<br />
0.0030<br />
0 20 40 60<br />
Time (h)<br />
Measurement at 35 C<br />
Heat Flow<br />
Concentration<br />
20 30 40<br />
Time (h)<br />
T= 50°C<br />
80 100<br />
C<br />
T= 40°C<br />
B<br />
T= 30°C<br />
A<br />
60<br />
40<br />
20<br />
0<br />
50<br />
42
Amorphicity & Crystallinity<br />
Micronization and processing can alter the surface properties of<br />
materials. Small amounts of amorphous material are often formed<br />
which may change the characteristics of the powder in a way that<br />
affects both processing and bioavailability. <strong><strong>TA</strong>M</strong> <strong>III</strong> is an excellent<br />
tool for investigating low levels of amorphicity in a solid.<br />
The sample is loaded into an ampoule and then exposed to a<br />
solvent (usually water) vapor. The solvent lowers the glass transition<br />
temperature of the amorphous material enough to induce<br />
recrystallization, which is monitored as an exothermic response in<br />
the microcalorimeter as shown in the figure below. By integrating<br />
the curve, the amount of amorphous material in the sample can be<br />
quantified to levels below 1%.<br />
Amorphicity & Crystallinity<br />
Solution calorimetry is an alternative to heat flow micro-calorimetry<br />
in the assessment of amorphicity. This method works by dissolving<br />
the solid material in a solvent and measuring the temperature rise<br />
or fall in the solvent as a result of dissolution. Since amorphous and<br />
crystalline materials will have a different heat of solution, Solution<br />
calorimetry can be used to quantify the amount of amorphous<br />
material in a mixture of the two. The first figure shows the solution<br />
calorimetry data for a 5% amorphous fraction of lactose. The<br />
y-axis shows temperature offset from the bath temperature which<br />
was 25 °C. The central “break” section shows the temperature<br />
decrease as a result of dissolving the sample in water. The other<br />
two steep transitions on either side are calibrations. The second<br />
figure contains a plot of amorphous content versus enthalpy of<br />
solution, and demonstrates the ability of the solution calorimeter to<br />
effectively measure amorphicity.<br />
Enthalphy of Solution (J/g)<br />
Temperature offset (mK)<br />
Heat Flow (µW/g)<br />
800<br />
600<br />
400<br />
200<br />
0<br />
40<br />
35<br />
30<br />
25<br />
20<br />
15<br />
10<br />
5<br />
56<br />
54<br />
52<br />
50<br />
48<br />
46<br />
Baseline<br />
0 40 80<br />
Time (min)<br />
Calibration<br />
Baseline<br />
0 10 20 30 40<br />
Time (min)<br />
X<br />
X<br />
X X<br />
X<br />
Break<br />
Baseline<br />
X X<br />
X<br />
120 160<br />
Calibration<br />
Baseline<br />
0 2 4 6 8<br />
Amorphous Content (%w/w)<br />
X<br />
X<br />
X<br />
10<br />
50<br />
43
MATERIAL SCIENCE APPLICATIONS<br />
Stability Testing-Detergent<br />
Sodium percarbonate is manufactured in vast quantities<br />
around the world and is a major ingredient in washing<br />
powders and detergents. Unfortunately, sodium percarbonate<br />
is thermally unstable and undergoes continuous degradation.<br />
The figure contains the results of stability tests on three<br />
separate samples using the <strong><strong>TA</strong>M</strong> <strong>III</strong> at 40 °C. This data<br />
demonstrates the relative stability of the samples based on<br />
the magnitude of the exothermic heat flow.<br />
Heat Flow (µ W/g)<br />
10<br />
5<br />
0<br />
-5<br />
Stability Testing-Energetics<br />
-10<br />
0 10<br />
20 30 40<br />
Time (h)<br />
Some energetic materials need to be stabilized to improve<br />
the thermal stability. The degradation of these type of<br />
materials is associated with an exothermic heat flow which<br />
can be detected by <strong><strong>TA</strong>M</strong> <strong>III</strong>. In the presence of an effective<br />
stabilizer degradation is prevented and the heat flow is low.<br />
This figure contains a comparison of a variety of stabilizers<br />
with an energetic plasticizer. The time to the onset of a<br />
pronounced acceleration is termed the induction time and is<br />
a measure on how effective the stabilizers are to prevent<br />
degradation. This data suggests the 2-NDPA stabilizer is most<br />
effective.<br />
Heat Flow (µ W/g)<br />
2000<br />
1500<br />
1000<br />
500<br />
DPA<br />
NPN (pure)<br />
0<br />
Acardite II<br />
NQ<br />
-500<br />
0 0.4 0.8<br />
Centralite I<br />
1.2 1.6<br />
2-NDPA<br />
2<br />
Time (d)<br />
44
Compatibility<br />
Compatibility testing is a kind of stability testing with reference<br />
to the constituents of a material. Microcalorimetry has<br />
proven to be particularly useful for compatibility testing; in<br />
some cases data is obtained after only a few hours. One example<br />
is the non-compatibility between wax and wool. The<br />
difference between the measured response and the expected<br />
response indicates incompatibility.<br />
Setting Time of Cement<br />
The <strong><strong>TA</strong>M</strong> Air calorimeter has been shown to be excellent for<br />
diagnosis of problems related to setting time and premature<br />
stiffening of cement. The blue curve in the figure below<br />
represents an industrial cement produced with too little<br />
soluble calcium sulfate. This cement suffers from early<br />
stiffening because of the aluminate reactions at 1–1.5 hours<br />
hydration. It also suffers from low early strength, because the<br />
aluminate hydrates formed retard the strength-giving silicate<br />
hydration indicated by the unusually small silicate peak at<br />
5-10 hours. When 0.5% (yellow curve) and 1.0% (orange<br />
curve) of calcium sulfate hemi-hydrate was added to the<br />
cement the undesired early peak disappeared, and<br />
the strength-giving silicate peak regained its normal shape.<br />
The results indicate that premature stiffening is caused by a<br />
lack of soluble calcium sulfate.<br />
Heat Flow (µ W/g)<br />
Heat Flow (µW/g)<br />
5000<br />
4000<br />
3000<br />
2000<br />
1000<br />
Wax & mineral wool<br />
(Measured response)<br />
Wax<br />
Wax & mineral wool<br />
(Expected response)<br />
0<br />
Mineral wool (Insulation)<br />
-1000<br />
0 5<br />
10 15<br />
Time (h)<br />
2.5<br />
1.5<br />
1.0<br />
0.5<br />
0<br />
0 5<br />
10 15 20<br />
Time (h)<br />
45
LIFE SCIENCE APPLICATIONS<br />
Drug Efficacy<br />
Microcalorimetry has proven to be a sensitive and fast bioassay in<br />
cancer research to detect disorders of cellular metabolism. The figure<br />
demonstrates a direct and dose-related effect on the heat flow after<br />
injecting a variety of concentrations of the anti-cancer drug<br />
methotrexate to cultured T-lymphoma tumour cells. Dose-response<br />
curves could be calculated for different cell lines from the<br />
thermograms. The final drug concentrations were (a) 0, (b) 0.2,<br />
(c) 0.5, (d) 1.0, (e) 2.0, (f) 4.0μM (ref 6).<br />
Heat Flow (µW/ml)<br />
25<br />
20<br />
15<br />
10<br />
5<br />
a<br />
b<br />
c<br />
d<br />
e<br />
f<br />
0<br />
0 4 8 12 16<br />
Time (h)<br />
20<br />
Isothermal Titration Calorimetry<br />
Isothermal Titration Calorimetry (ITC) can be used to study molecular<br />
reaction and binding reactions in the pharmaceutical and life<br />
sciences fields. The data in this figure contains an example of how<br />
the thermodynamic properties of the binding of Insulin Growth<br />
Factor I (IGF-I) to its receptor (IGF-I-rec) can be elucidated. The<br />
microcalorimetric titration binding measurements were performed at<br />
25 °C in saline HEPES and saline sodium phosphate buffer at<br />
pH 7.4. From this data, it is concluded that the biological response<br />
of the IGF-I-rec is due not only to the binding itself, but also to<br />
conformational changes incurred upon binding.<br />
Heat Flow (nW)<br />
200<br />
0<br />
-200<br />
-400<br />
-600<br />
-800<br />
-1000<br />
0 50 100 150 200<br />
Time/min<br />
46
Investigation of Microbial Activity<br />
Calorimetry has been called the “universal detector,”<br />
because virtually every process involves the exchange of<br />
heat. This is particularly true for the respiration of living<br />
organisms, including bacteria. The sensitivity and versatility<br />
of the <strong><strong>TA</strong>M</strong> system allows for the direct measurement of<br />
microbial activity in real time. As shown in the figure, the heat<br />
flow profiles of bacteria are very specific, and can easily be<br />
used to identify a particular species (staphylococcus aureus<br />
vs. staphylococcus epidermidis). In addition, the <strong><strong>TA</strong>M</strong> analysis<br />
provides rapid detection of growth (within hours), rapid<br />
identification, and provides an excellent platform for<br />
the analysis of anti-microbial treatments. Trampuz A et al.<br />
JCM 2006; 44: 628<br />
Heat Flow (µW)<br />
3.0x10 -4<br />
2.5x10 -4<br />
2.0x10 -4<br />
1.5x10 -4<br />
1.0x10 -4<br />
5.0x10 -5<br />
0.0<br />
0<br />
5<br />
Staphylococcus Aureus<br />
Staphylococcus Epidermidis<br />
10 15 20 25<br />
Time (h)<br />
30<br />
Microorganism Detection<br />
800<br />
Identification of microorganisms in patient blood and donated<br />
platelet concentrates is essential in clinical practice to<br />
improve patient care and safety. Currently, commercial blood<br />
culture systems (detecting microbial CO 2 production by color<br />
change) are used for microbial detection in blood and<br />
platelet concentrates. However, these techniques<br />
generally require large samples and long evaluation times.<br />
Calorimetric detection of microbial growth may be more<br />
sensitive, simple and rapid than blood culture. This data<br />
demonstrates how microcalorimetry can be used to<br />
detect metabolic activity in a platelet solution spiked with<br />
E.Coli bacteria in a variety of concentrations, over a relatively<br />
short timescale. Applying this method to all donated platelet<br />
concentrations could reduce transfusion-related infections and<br />
extend storage time.<br />
Heat Flow (µ W)<br />
700<br />
600<br />
500<br />
400<br />
300<br />
200<br />
100<br />
0<br />
-100<br />
-200<br />
500 1000<br />
Time (s)<br />
mit NaCl<br />
10^8 cfu/ml<br />
10^7 cfu/ml<br />
10^6 cfu/ml<br />
10^5 cfu/ml<br />
10^4 cfuml<br />
10^3 cfu/ml<br />
10^2 cfu/ml<br />
10^1 cfu/ml<br />
1500 2000<br />
47
MULTI CELL DIFFERENTIAL SCANNING CALORIMETRY<br />
The MCDSC is a versatile, multipurpose microcalorimeter that provides continuous temperature-scanning,<br />
step-scanning or isothermal measurements on three samples and one reference simultaneously. The one milliliter<br />
sample capacity ampoules and microwatt sensitivity ensures maximum flexibility for identifying phase transitions<br />
in chemicals and biologicals, metabolic activity in cellular organisms and thermal events occurring in complex<br />
reactions of liquids and/or solids during admixing. The superior baseline stability and short equilibration<br />
time permits faster measurements and more rapid temperature changes than is possible with other isothermal<br />
calorimeters. The availability of reusable, probe-accessible and high pressure removable ampoules allows the<br />
study of materials with experimental designs that are not compatible with other microcalorimeters.
50<br />
MC DSC SPECIFICATIONS
Sample Cells 3<br />
Reference Cells 1<br />
Temperature Range -40 to 150 °C<br />
Detection Limit<br />
0.2 μW<br />
Cell Volume<br />
1 ml<br />
Sample Volume<br />
up to 1 ml<br />
Short Term Noise Level<br />
0.2 μW<br />
Baseline Repeatability<br />
2 μW<br />
Scan Rate<br />
0 (isothermal) to 2 ºC/minute<br />
Response Time<br />
90 second time constant or 9 minutes for 99% response<br />
Heat Measurement M ethod<br />
Heat flux<br />
51
MC DSC TECHNOLOGY<br />
No other DSC on the market offers more flexibility for studying thermal<br />
stability of almost any sample as a function of temperature or time.<br />
The calorimeter exploits ultra-sensitive Peltier technology for both<br />
temperature control and as sensors to detect heat effects. Peltier<br />
cascades allow precise temperature control for isothermal operation<br />
and reproducible scan rates up to 2 ºC per minute. The Peltier sensors<br />
give true microwatt detection independent of scan rate. Equipped with<br />
four removable cells, this is truly a workhorse instrument.<br />
Top Covers<br />
The MC DSC runs one reference and three samples simultaneously<br />
in removable, Hastelloy ampoules sealed with O-rings to prevent loss<br />
of volatiles. With an extra set of ampoules there is no downtime for<br />
cleaning and separate ampoule sets are convenient for different user<br />
groups. The wide-mouth ampoule design allows easy cleaning and<br />
accommodates large pieces of solids and viscous liquids as well as<br />
suspensions and solutions. The O-ring seal provides a reliable, truly<br />
hermetic seal for pressures up to 15 atmospheres, sufficient to retain<br />
the vapor pressure of liquid water up to 200 ºC. Hastelloy ampoules<br />
are resistant to corrosion by aggressive solvents including concentrated<br />
bases, H 2 SO 4 , HCl and HNO 3 and are inert to biological materials<br />
such as proteins and lipids.<br />
Sample Well<br />
Sensors<br />
The top covers are designed for easy access to the calorimeter cells<br />
which allows operation with high pressure, batch reaction, and probe<br />
accessible ampoules for a wide range of non-traditional applications.<br />
Cascade<br />
Modules<br />
52
MC DSC AMPOULES<br />
Standard Ampoules<br />
High Pressure Ampoules<br />
Probe Accessible Ampoules<br />
Batch Reaction Ampoules<br />
Hastelloy ® , 1.0 ml volume, 11mm diameter, 5mm depth<br />
Hastelloy ® , 0.5ml volume, Kalrez ® O-rings, max pressure 6000psi<br />
Standard Ampoule with special connections for pressure measurements,<br />
and connecting to spectrophotometers, mass specs, and gas chromatographs.<br />
Special Hastelloy ® cells with two separate, sealed compartments for<br />
studying the reaction (and heat of reaction) between solids, liquids, and vapors.<br />
53
MC DSC Applications<br />
Drug-Excipient Compatibility<br />
Because of the large sample capacity and multiple cell design,<br />
the MC DSC can be used to rapidly determine the temperature<br />
dependence of rates of drug-excipient reactions. This figure shows the<br />
results from a continuous temperature scan of 155mg of a 1:1 mixture<br />
of aspirin and magnesium stearate. The rate of the endothermic reaction<br />
indicating incompatibility becomes measurable at about 50 ºC. Because<br />
of the wide-mouth (11mm) and depth (5mm) of the ampoules, whole<br />
tablets and capsules can be studied. The continuous temperature scan<br />
method is also useful for rapidly establishing useful temperatures for<br />
isothermal calorimetric measurements of stability of pure drugs and<br />
mixtures.<br />
Biofuel Production<br />
Determining reaction rates is a necessary prerequisite for understanding<br />
the mechanism of a chemical process. The MCDSC is a precision<br />
isothermal analysis tool, capable of analyzing both short- and long- term<br />
reaction kinetics. In the presence of a 3% w/v sodium hydroxide (NaOH)<br />
in ethanol solution, soybean oil undergoes transethylesterifcation to form<br />
a biofuel (biodiesel). Following the initial baseline periods (with- and<br />
without- ampoule), a sealed 1 mL ampoule containing the premixed<br />
reaction components was positioned into one of the three channels of the<br />
MCDSC equilibrated to 25 °C. The initial deflection at ~12000 s is due<br />
to the insertion of the ampoule into the MCDSC. The maximum peak for<br />
the catalysis in the reaction rate is shown at ~16000 s. Following the<br />
reaction maximum, the decreasing rate of the reaction is shown until<br />
completion. The inset shows the control experiment, whereby ethanol<br />
without NaOH was mixed with soybean oil and measured simultaneously<br />
in a second ampoule.<br />
Reaction Heat Rate (µW/mg)<br />
Raw Heat rate / µJ/s<br />
10<br />
0<br />
-10<br />
-20<br />
exo<br />
-30<br />
-40<br />
-50<br />
-60<br />
-70<br />
30 40 50 60 70 80<br />
Temperature °C<br />
12000<br />
8000<br />
4000<br />
0<br />
-4000<br />
Baseline w/Ampoule<br />
exo<br />
Catalysis<br />
Raw Heat rate / µJ/s<br />
Blank-Control<br />
6000<br />
4000<br />
2000<br />
0<br />
-2000<br />
-4000<br />
10000 30000 50000 70000 90000<br />
Time / s<br />
Completion<br />
Addition of Ampoule w/Sample<br />
Baseline w/out Ampoule<br />
10000 30000 50000 70000 90000<br />
Time / s<br />
54
Shelf-Life Prediction by Step-Scanning<br />
In the step-scan method, the calorimeter temperature is rapidly scanned<br />
to a programmed temperature and then held isothermal for sufficient<br />
time (30-45 min) to allow for equilibration to accurately measure the<br />
steady-state heat rate, then stepped to the next temperature for another<br />
measurement of the isothermal heat rate. Step-scan measurements are<br />
particularly useful for accurate determination of activation energies and<br />
temperatures at which reaction mechanisms change. The figure shows<br />
data collected by the step-scan method on 100 mg aliquots of three<br />
different brands of peroxide bleaches used for whitening teeth. 35%<br />
H 2 O 2 is shown for comparison. The higher the decomposition rate,<br />
the faster the product whitens teeth, but the shorter the working time.<br />
The method is applicable to reactions in a wide range of materials;<br />
for example, cleaning agents, drug-excipient mixtures, adhesives,<br />
cell cultures, and small organisms.<br />
Reaction Heat Rate (µW/g)<br />
2500<br />
2000<br />
1500<br />
1000<br />
500<br />
0<br />
35<br />
A<br />
exo<br />
B<br />
C<br />
35% H 2<br />
O 2<br />
45 55 65 75 85<br />
Temperature °C<br />
Polymorph & Amorphous Crystallization<br />
The batch reaction ampo ules make it particularly useful for measurement<br />
of the heat and kinetics of reactions between volatile liquids and solids.<br />
The figure shows the immediate crystallization of 30 mg of a partially<br />
amorphous lactose sample on exposure to 100% humidity. Water sorption<br />
by 30 mg of crystalline lactose is shown for comparison. The blank<br />
in dry N 2 shows the exothermic heat of opening followed by the<br />
endothermic evaporation of water. The thermodynamics and kinetics of<br />
reactions such as oxidation, decomposition, hydrolysis, and curing can<br />
be determined by similar isothermal measurements in standard<br />
ampoules. Evolution of gases and changes in solution composition can<br />
be followed by adding pressure tranducers, spectral probes or mass<br />
spectrometer inlets to the probe accessible ampoules.<br />
Heat Rate (µW)<br />
1600<br />
1400<br />
1200<br />
1000<br />
800<br />
600<br />
400<br />
200<br />
0<br />
-200<br />
exo<br />
Amorphous<br />
Crystalline<br />
Blank<br />
0 0.2 0.4 0.6 0.8 1 1.2 1.4 1.6<br />
Time (h)<br />
55
MC DSC Applications<br />
600<br />
Temperature Dependence of Metabolic Rate<br />
In many organisms, metabolic heat rate is equivalent to the oxygen uptake<br />
rate, but heat rate is much easier to measure in cell cultures, tissues,<br />
and small organisms. Data on respiration rate as a continuous function of<br />
temperature is necessary to optimize conditions for cell cultures, for<br />
prediction of the effects of climate change on organisms and ecosystems,<br />
for selection of cultivars of crop plants for optimum productivity, and<br />
for prediction of the invasive potential of exotics. The data shows a<br />
comparison of the metabolic heat rates obtained with continuous<br />
temperature scans of 50 mg samples of leaf tissue from apple and orange<br />
trees and of a tomato cell culture. Near simultaneous measurements of<br />
metabolic heat rates and CO 2 rates as functions of temperature can be<br />
done by the step-scan method.<br />
Metabolic Heat Rate (µW/g)<br />
500 exo<br />
tomato<br />
400<br />
apple<br />
orange<br />
300<br />
200<br />
100<br />
200<br />
0 10 20 30 40 50<br />
Temperature °C<br />
Characterisation of solid state drugs by calorimetry<br />
Blank<br />
Exothermic<br />
This is an example of a drug where the enantiotropic form A spontaneously<br />
converts to form B. This experiment was conducted in the step isothermal<br />
mode of the MCDSC. Samples were loaded at 60 °C and measured for<br />
1.5 hrs before the temperature was changed 10°C. The endothermic effect<br />
at 90 °C (Graph 1) is the conversion of form A to B, with an excellent<br />
reproducibility between duplicate samples. The shape of the curve indicates<br />
an autocatalytic mechanism consistent with nucleation and growth.<br />
The conversion went to completion in 10 hours. The second graph<br />
(Graph 2) shows the same reaction, but in this case a small amount of B<br />
was added as an impurity to A, and with this seeding the conversion<br />
started at a lower temperature, 80 °C, and at 90 °C the time to completion<br />
of the conversion was significantly reduced.<br />
60˚C<br />
60˚C<br />
70˚C 80˚C<br />
90˚C<br />
1 HR 0.1 mw<br />
Blank<br />
70˚C 80˚C<br />
90˚C<br />
Exothermic<br />
1 HR 0.1 mw<br />
56
Food Processing<br />
Determination of the temperature dependence of reaction rates is<br />
necessary for establishing proper storage, manufacturing, and<br />
compounding conditions for foods, drugs, cleaners, and industrial<br />
chemicals and products. The rates of reactions in diverse materials<br />
can be rapidly determined as a continuous function of temperature<br />
with the MC DSC. Continuous scanning is particularly useful for<br />
rapidly establishing the optimal temperatures for more definitive, but<br />
much slower, determinations of the identity of reactions and of rate<br />
laws by isothermal calorimetry and analytical methods. This figure<br />
shows data from continuous temperature scans of 0.5 g aliquots of<br />
pineapple juice concentrate under various conditions. Hydrolysis of<br />
sucrose in the juice produces glucose, a reducing sugar, which is<br />
then oxidized by oxygen and also undergoes Maillard reactions with<br />
amines in the juice to produce off-flavors and discoloration. Such<br />
data can be used to rapidly optimize process conditions.<br />
Heat Rate (µW)<br />
200<br />
180<br />
160<br />
140<br />
120<br />
100<br />
80<br />
60<br />
40<br />
20<br />
exo<br />
O 0.5Mpa<br />
2<br />
O 2<br />
N 2<br />
0<br />
30 40 50 60 70 80<br />
Temperature (°C)<br />
Phase Transitions in Foods<br />
Phase transitions occurring during cooking, freezing, drying, mixing,<br />
and storage of food products are important determinants of<br />
texture, taste, and quality. The large, wide-mouth ampoules, wide<br />
temperature range, high pressure capability, and multiple sample<br />
cells of the MC DSC make it a versatile calorimeter for both<br />
temperature scanning and isothermal studies of food products. The<br />
data shows temperature scans of whole grain rice after various<br />
treatments. The peak is due to gelatinization of crystalline starch<br />
remaining after partial cooking.<br />
Heat Capacity<br />
Annealed<br />
24 hrs @ 55 °C<br />
Raw<br />
75 °C 8 hrs<br />
75 °C 12 hrs<br />
75 °C 18 hrs<br />
Cooked<br />
40 50 60 70 80 90<br />
Temperature (°C)<br />
57
REFERENCES<br />
Garbett, N., DeLeeuw, L. and J.B. Chaires. MCAPN-2010-04.<br />
High-throughput DSC: A Comparison of the <strong>TA</strong> <strong>Instruments</strong> Nano DSC Autosampler System with the GE Healthcare VP-Capillary DSC (2010)<br />
Demarse, N. and L.D. Hansen. MCAPN-2010-01.<br />
Analysis of Binding Organic Compounds to Nanoparticles by Isothermal Titration Calorimetry (ITC). (2010)<br />
Quinn, C.F. MCAPN-2010-02. Analyzing ITC Data for the Enthalpy of Binding Metal Ions to Ligands. (2010)<br />
Quinn, C.F. and L.D. Hansen. MCAPN-2010-03. Pressure Perturbation Calorimetry: Data Collection and Fitting. (2010)<br />
Román–Guerrero, A.,Vernon–Carter, E.J. and N.A. Demarse. MCAPN-2010-05. Thermodynamics of Micelle Formation. (2010)<br />
<strong>TA</strong> <strong>Instruments</strong>, Microcalorimetry Technical Note MCTN-2010-02.<br />
Advantages of Using a Nano DSC when Studying Proteins that Aggregate and Precipitate when Denatured. (2010)<br />
<strong>TA</strong> <strong>Instruments</strong>, Microcalorimetry Technical Note, MCTN-2010-03. How to Choose an ITC Cell Volume. (2010)<br />
Baldoni, D., Steinhuber, A., Zimmerli, W. and A. Trampuz. Antimicrob Agents Chemother 54(1):157-63. In vitro activity of gallium maltolate against Staphylococci<br />
in logarithmic, stationary, and biofilm growth phases: comparison of conventional and calorimetric susceptibility testing methods. (2010)<br />
Choma, C.T. MCAPN-2010-01. Characterizing Virus Structure and Binding by Calorimetry. (2009)<br />
Wadsö, L. and F. G. Galindo. Food Control 20: 956–961. Isothermal calorimetry for biological applications in food science and technology. (2009)<br />
Baldoni, D., Hermann, H., Frei, R., Trampuz, A. and A. Steinhuber. J Clin Microbiol. 7(3):774-6.<br />
Performance of microcalorimetry for early detection of methicillin resistance in clinical isolates of Staphylococcus aureus. (2009)<br />
Trampuz, A., Piper, K.E., Hanssen, A.D., Osmon, D.R., Cockerill, F.R., Steckelberg, J.M. and R. Patel. J Clin Microbiol. 44(2):628-631.<br />
Sonication of explanted prosthetic components in bags for diagnosis of prosthetic joint infection is associated with risk of contamination. (2006)<br />
Microcalorimetry - A Novel Method for Detection of Microorganisms in Platelet Concentrates and Blood Cultures. Andrej Trampuz, Simone Salzmann, Jeanne<br />
Antheaume, Reno Frei, A.U. Daniels University of Basel & University Hospital Basel, Switzerland (2006)<br />
Data provided by Svensson, Bodycote Materials AB, Sweden (2003)<br />
Wingborg and Eldsater, Propellants, Explosives and Pyrotechnics, 27, 314 -319, (2002).<br />
Schmitt, E.A., Peck, K., Sun, Y. and J-M Geoffroy. Thermochimica Acta<br />
380 (2):175-184. Rapid, practical and predictive excipient compatibility screening using isothermal microcalorimetry. (2001)<br />
Schmitt, Peck, Sun & Geoffroy, Thermochim. Acta, 380, 175-183, (2001).<br />
Thermometric Application Note 22034 (2001).<br />
Hogan, S.E. & G. Buckton. Int. J. Pharm., 207, 57-64. The quantification of small degrees of disorder in lactose using solution calorimetry. (2000)<br />
Chemical & Engineering News, June 18, 2007, Page 31. Hongisto, Lehto & Laine, Thermochim. Acta, 276, 229-242, (1996).<br />
Bermudez, J., Bäckman, P. and A. Schön. Cell. Biophys. 20, 111-123.<br />
Microcalorimetric Evaluation of the Effects of Methotrexate and 6- Thioguanine on Sensitive T-Iymphoma Cells and on a Methotrexate-Resistant Subline. (1992)<br />
Bystrom, Thermometric Application Note 22004, (1990).<br />
Thermometric Appl. Note 22024.<br />
58
tainstruments.com<br />
© 2012 <strong>TA</strong> <strong>Instruments</strong>. All rights reserved. L20040.001