Northgate Exploration Limited - Minerals North
Northgate Exploration Limited - Minerals North
Northgate Exploration Limited - Minerals North

You also want an ePaper? Increase the reach of your titles
YUMPU automatically turns print PDFs into web optimized ePapers that Google loves.
Productivity<br />
> <strong>Exploration</strong> ><br />
Growth<br />
<strong><strong>North</strong>gate</strong> <strong>Exploration</strong> <strong>Limited</strong><br />
Maurice Ethier – General Manager, Kemess Mine<br />
<strong>Minerals</strong> <strong>North</strong> Conference – Smithers – April 15,<br />
2004
Presentation Outline<br />
1<br />
2<br />
3<br />
4<br />
<strong><strong>North</strong>gate</strong> Overview<br />
Kemess Mine Overview<br />
Kemess <strong>North</strong><br />
<strong>Exploration</strong>
<strong><strong>North</strong>gate</strong> Overview<br />
<strong><strong>North</strong>gate</strong> <strong>Exploration</strong> <strong>Limited</strong> is a gold and copper mining company focused<br />
on operations and opportunities in the Americas. The Corporation's principal<br />
assets are the 300,000-ounce per year Kemess South mine in north-central<br />
British Columbia and the adjacent Kemess <strong>North</strong> deposit, which contains an<br />
indicated resource of 5.4 million ounces of gold and 2 billion pounds of copper<br />
and is currently the subject of a feasibility study.
<strong><strong>North</strong>gate</strong> Overview<br />
Recent Trading Summary<br />
TSX: NGX<br />
(Cdn$)<br />
AMEX: NXG<br />
(US$)<br />
Share price $3.20 $2.40<br />
Trading Volume (million shares / day) 1.4 0.5<br />
Shares Outstanding (million) 198.6 198.6<br />
Market Capitalization (million) $635 $476<br />
Began trading on AMEX on July 11, 2003 under the symbol NXG.
<strong><strong>North</strong>gate</strong> Overview<br />
1. Strong management team with a proven track record.<br />
2. Low risk open-pit mine in Canada.<br />
3. Excellent exploration potential in proximity to existing infrastructure.<br />
4. Significant leverage to both gold and copper prices.<br />
5. Undervalued common share price compared to peers.
Financial Restructuring<br />
<strong><strong>North</strong>gate</strong> Overview<br />
<strong><strong>North</strong>gate</strong> purchased the Kemess assets in February 2000 using<br />
bridge financing provided by Brascan Financial<br />
Closed US$100 million Project loan facility in September 2001<br />
Issued 160 million shares in two separate equity issues in 2002<br />
and used proceeds to pay down 40% of long term debt<br />
Brascan sold its 41.5% interest in <strong><strong>North</strong>gate</strong> via a secondary<br />
offering which closed on November 24, 2003
Kemess Mine Overview<br />
Located in north-central British Columbia<br />
Mining rate<br />
– 140,000 tonnes / day (average)<br />
Mill throughput<br />
– 52,000 tonnes / day<br />
Life of mine profile<br />
– 300,000 oz/y gold and 75 million lbs/y copper<br />
– Cash cost US$125/oz, net Cu @ 100¢/lb<br />
US$150/oz, net Cu @ 90¢/lb<br />
US$175/oz, net Cu @ 80¢/lb<br />
Reserves & Resources (at December 31, 2003)<br />
– Reserve: 91.7 million tonnes containing 2.1 million oz of gold and 459 million lbs copper<br />
– Resource: 52.2 million tonnes containing 0.82 million oz of gold and 192 million lbs copper
<strong><strong>North</strong>gate</strong> <strong>Exploration</strong> <strong>Limited</strong><br />
Kemess Mine<br />
Original Owner – El Condor Resources/St. Phillips Resources<br />
Applied for mine development certificate in 1994<br />
Royal Oak Mines Inc. acquired all o/s shares of ECR/SPR in August<br />
1995<br />
Construction began in 1996<br />
Commercial production in 1998<br />
Royal Oak placed into receivership in April 1999<br />
Kemess South mine acquired by <strong><strong>North</strong>gate</strong> <strong>Exploration</strong> <strong>Limited</strong> in<br />
February 2000
Kemess Mine 2004 Business Plan<br />
OPERATING STATISTICS<br />
Employees<br />
Staff 85<br />
Hourly 265<br />
Total 350<br />
Summer Students 14<br />
Productivities<br />
Hours worked 764,020<br />
Shifts worked 63,669<br />
Tonnes mined per shift worked 758<br />
Tonnes milled per shift worked 300
Kemess Mine Overview<br />
Operational Improvements<br />
Mill throughput and mining efficiencies have steadily increased.<br />
Mill Throughput<br />
Mining Efficiency<br />
Tonnes ore / day<br />
55,000<br />
50,000<br />
45,000<br />
40,000<br />
35,000<br />
2000 2001 2002 2003<br />
Tonnes mined/mineshift<br />
1000<br />
800<br />
600<br />
400<br />
200<br />
2000 2001 2002 2003
Kemess Mine Overview<br />
Metallurgical Improvements<br />
Recoveries have increased even as grades have declined.<br />
Gold<br />
Copper<br />
Recovery (%)<br />
76<br />
72<br />
68<br />
64<br />
60<br />
Target: 73.5%<br />
2000 2001 2002 2003<br />
0.9<br />
0.8<br />
0.7<br />
0.6<br />
Grade (gmt)<br />
Recovery (%)<br />
88<br />
83<br />
78<br />
73<br />
68<br />
Target – 85%<br />
2000 2001 2002 2003<br />
0.28<br />
0.24<br />
0.2<br />
0.16<br />
0.12<br />
Grade (%)<br />
Recovery<br />
Grade<br />
Recovery<br />
Grade
Annual Mill Performance<br />
Performance Head Grade Recovery Throughput Concentrate Quality Metal Production<br />
Year Avail % Milled Cu % Au g/T Cu Au DMT Moist % Cu % Au g/T Cu (t) Au (oz) Ag (oz)<br />
1999 73.39 14,113,460 0.212 0.644 70.8 66.26 100,664 7.328 21.2 66.06 21,389 213,791 247,806<br />
2000 74.63 14,138,443 0.222 0.779 72.4 64.24 101,519 8.718 22.8 69.24 23,151 225,998 227,812<br />
2001 82.72 15,360,639 0.251 0.855 77.3 65.51 134,639 8.235 22.3 64.02 30,076 277,106 330,455<br />
2002 88.25 17,308,131 0.236 0.724 80.7 69.93 138,274 8.225 23.3 61.87 33,051 282,255 419,462<br />
2003 91.24 18,632,837 0.225 0.702 82.1 70.17 157,616 8.62 21.9 58.04 34,554 294,117 447,197<br />
Availability up by 26% Throughput up by 35% Cu Recovery up by 16%<br />
Au Recovery up by 9% Concentrate Production up by 57%<br />
Cu Production up by 62% Au Production up by 38% Ag Production up by 81%<br />
Costs down by 33%
Records established during 2003<br />
Gold production of 294,117 ounces<br />
Copper production of 76.2 million pounds<br />
Ex-pit production of 145,800 mt per day<br />
Mill throughput of 51,409 mt per day<br />
Copper recovery of 82%<br />
Mill availability of 91.17%
Kemess Mine Productivity<br />
900<br />
700<br />
500<br />
300<br />
100<br />
2000<br />
441<br />
180<br />
2001<br />
628<br />
439<br />
254<br />
205<br />
2002<br />
2003<br />
814<br />
758<br />
281 300<br />
2004<br />
MT mined<br />
per shift<br />
worked<br />
MT milled<br />
per shift<br />
worked
Safety and Environment<br />
Safest open pit mine in BC during 2001 (Edward Prior Award)<br />
Reclamation and Environmental Citation 2002<br />
$13 million reclamation bond increased by $1 million annually<br />
Fishery enhancement project has been successful<br />
Successful progressive reclamation program<br />
Closed circuit water use program<br />
Power Smart Partner with BC Hydro
220<br />
Kemess Mine Overview<br />
Life of Mine Cash Cost Profile<br />
Cash Cost (US$ / oz.)<br />
200<br />
180<br />
160<br />
140<br />
120<br />
100<br />
2004 2005 2006 2007 2008<br />
Years<br />
*Assumes $0.95 Cu and F/X of 1.50<br />
Full Absorption Cash Cost<br />
Gold Institute Cash Cost
Kemess Mine 2004 Business Plan<br />
Total Operating costs $128 million<br />
$10.8<br />
$11.1 $1.1<br />
$49.1<br />
$ millions<br />
$55.8<br />
Mining, engineering & geology<br />
Administration<br />
Environment<br />
Milling & power transmission<br />
Camp, HR & safety
Kemess Mine 2004 Business Plan<br />
Total Operating costs $128 million<br />
Road Maintenance $2.6<br />
Tires $4.5<br />
Admin & other $5.5<br />
Explosives $5.9<br />
Payroll $28.7<br />
Reagents $2.0<br />
Grinding Steel $13.6<br />
Mine Maintenance $17.1<br />
Property Taxes $1.8<br />
$ millions<br />
Mill Maintenance $6.7<br />
Mill Liners $4.2<br />
BC Hydro $18.6<br />
Insurance $1.3<br />
Fuel & Lubes $7.8<br />
Catering & Flights $7.3<br />
Payroll $28.7 Reagents $2.0 Grinding Steel $13.6<br />
Insurance $1.3 Fuel & Lubes $7.8 Catering & Flights $7.3<br />
BC Hydro $18.6 Mill Liners $4.2 Mill Maintenance $6.7<br />
Property Taxes $1.8 Mine Maintenance $17.1 Tires $4.5<br />
Road Maintenance $2.6 Explosives $5.9 Admin & other $5.5
Kemess Mine Overview<br />
Expenditures by location in 2003 - $123 million<br />
$12.65<br />
$6.81<br />
$3.40<br />
$29.48<br />
$11.41<br />
$16.11<br />
$ millions<br />
$21.73<br />
$16.22<br />
$3.09<br />
$1.89<br />
Prince George $29.48 Mackenzie & Ft St James $16.11<br />
BC Other $1.89 Bulkley Valley-Stikine $3.09<br />
Greater Vancouver & Sunshine Coast $16.22 Kamloops & Cariboo Districts $21.73<br />
Alberta $11.41 Quebec $12.65<br />
Ontario & rest of Canada $6.81 USA $3.40
Kemess Mine Overview<br />
Payroll Distribution 2003 - $26 million<br />
$3.61<br />
$0.36<br />
$3.22<br />
$0.51<br />
$5.02<br />
$1.06<br />
$1.08<br />
$0.96<br />
$1.53<br />
$ millions<br />
$4.14<br />
$4.46<br />
Prince George Districts $3.61 Peace River Districts $.51<br />
Bulkley Valley-Stikine $5.02 Skeena & <strong>North</strong> Coast $1.06<br />
Vancouver Island Districts $1.08 Greater Vancouver & Sunshine Coast $1.53<br />
Kamloops & Cariboo Districts $4.46 Okanagan-Kelowna & Yale-Lillooet $4.14<br />
Columbia and the Kootenays $0.96 Alberta $3.22<br />
Canada - Other $0.36
Kemess Mine Overview<br />
Payments to Gov’t & Crown Corporations in 2003 - $40 million<br />
$16.89<br />
$1.39<br />
$2.51<br />
$0.71<br />
$2.31<br />
$ millions<br />
$0.20<br />
$0.34<br />
$1.87<br />
$0.58<br />
$7.10<br />
BC Hydro<br />
BC Mineral Tax<br />
Provincial sales & fuel tax<br />
CPP, EIC, WCB<br />
Capital Taxes<br />
Provincial health insurance premiums<br />
Federal fuel tax<br />
Employee Remittances<br />
Property taxes<br />
Mines Inspection and other fees
Kemess Mine 2004 Business Plan<br />
SENSITIVITIES<br />
Effect of<br />
Impact on Net Income<br />
AUS$0.05 change in Copper price $4,653,000<br />
AUS$10.00 change in Gold price $4,264,000<br />
A $.05 change in the CAD/USD exchange rate $135,877
2004 Highlights<br />
Mine 48 million tonnes ex-pit (waste and ore)<br />
Mill 19.1 million tonnes of ore<br />
300,000 oz gold production<br />
75 million lbs copper production<br />
Cash Cost of $206/oz (US) or less ($180/oz using Gold Institute method)<br />
Complete Kemess <strong>North</strong> feasibility study early in 2 nd Quarter<br />
<strong>Exploration</strong> expenditures of $2 million in local area<br />
Speed up second SAG mill, install second Trommel magnet and complete phase II of Wemco cell<br />
retrofit<br />
Replace 23 yd Hitachi EX3500 with a 40 yd Hitachi EX5500<br />
Total Capital Expenditures of $16.9 million (incl. $6.1 million for tailings dam construction)
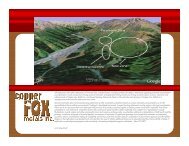
Kemess <strong>North</strong> Project
Duncan Lake<br />
Nugget<br />
Showing<br />
Kemess <strong>North</strong> Deposit<br />
Kemess East<br />
Showing<br />
Sovereign Showing
Kemess <strong>North</strong> Project<br />
Pre-feasibility Study Mine Plan<br />
Mineable Resource: 370 million tonnes @ Au 0.34 gT<br />
Cu 0.18 %<br />
- Containing 4.0 million ounces of gold<br />
and 1.4 billion pounds of copper<br />
Waste/Ore Strip Ratio 0.6:1
Kemess <strong>North</strong> Project<br />
Development Plan<br />
Mill Throughput (tonnes/day)<br />
2004-05 2006-09 2010-19<br />
Kemess South 52,000+ 30,000 0<br />
Kemess <strong>North</strong> 0 37,500 93,000+<br />
Total 52,000 67,500 93,000+<br />
When Kemess <strong>North</strong> ore is exhausted in 2019 a decision will be made on a push back to<br />
access additional higher grade ore resources at the bottom of the pit, based on<br />
prevailing metal prices.
Kemess <strong>North</strong> Project<br />
Pre-feasibility Study Summary<br />
Annual Averages<br />
2004 – 2009 2010 – 2019<br />
Production<br />
Gold – ounces 283,000 228,000<br />
Copper – million lbs 77 117<br />
Operating Parameters<br />
Mining – million tonnes 47.9 43.4<br />
Milling – million tonnes 22.0 34.0<br />
Operating Cost – Cdn$ / tonne milled 5.97 4.34<br />
Gold Cash Cost – US$ / oz (1) 173 135<br />
(1) Cu – US$0.95/lb; Cdn/US F/X 0.67
Kemess <strong>North</strong> Project<br />
Pre-feasibility Study Summary<br />
Project Capital (US$ millions)<br />
2005 53<br />
2006 73<br />
2009 27<br />
153
Kemess <strong>North</strong> Project<br />
Anticipated Schedule<br />
Feasibility Study – Q2 2004<br />
Permits – End of Q2 2005<br />
Startup – Q4 2006
<strong>Exploration</strong><br />
2003 <strong>Exploration</strong> Program<br />
Expenditures of $2.5 million.<br />
Target<br />
Metres<br />
Kemess Claims Au/Cu Porphyry 10,000<br />
Hyland Property Sediment-hosted Au 2,400<br />
Brenda Property Au/Cu Porphyry 1,500<br />
Total 13,900<br />
2004 exploration expenditures are expected to be similar to 2003
<strong>Exploration</strong><br />
<strong>Exploration</strong> Projects<br />
11 million ounces of reserves and resources
<strong>Exploration</strong> 2003<br />
Brenda<br />
Property<br />
Previous White Pass<br />
Zone Drilling<br />
SECTION 10550N<br />
View NW<br />
60% JV with Canasil<br />
Resources Inc.<br />
Monzonite<br />
161.6m @<br />
0.56 g/t Au<br />
0.08% Cu<br />
Similar mineralization<br />
to Kemess <strong>North</strong>.<br />
2003 results were<br />
encouraging and<br />
further drilling is<br />
planned in 2004.<br />
1% Chalcopyrite<br />
Monzonite<br />
BR-03-05<br />
Toodoggone Fm.<br />
Intermediate BR-03-07<br />
Volcanics<br />
Latite
2004 Expenditure of $750,000 are planned
Stewart Omineca Resource Road<br />
– ~100 Km new construction to complete connection<br />
– Estimated cost to complete $30-40 million<br />
– Significant potential to reduce shipping & handling costs of concentrate<br />
– Access to deep sea port and broader markets<br />
– Improves IRR of Kemess <strong>North</strong> Project<br />
– Improves access for exploration in northern BC<br />
– Competition with ORAR becomes tougher with time
Special thanks to all the organizers and volunteers of the 2004 <strong>Minerals</strong> <strong>North</strong> Conference!