

corrosive species and scaling in wells at olkaria ... - Orkustofnun
corrosive species and scaling in wells at olkaria ... - Orkustofnun
corrosive species and scaling in wells at olkaria ... - Orkustofnun

Create successful ePaper yourself
Turn your PDF publications into a flip-book with our unique Google optimized e-Paper software.
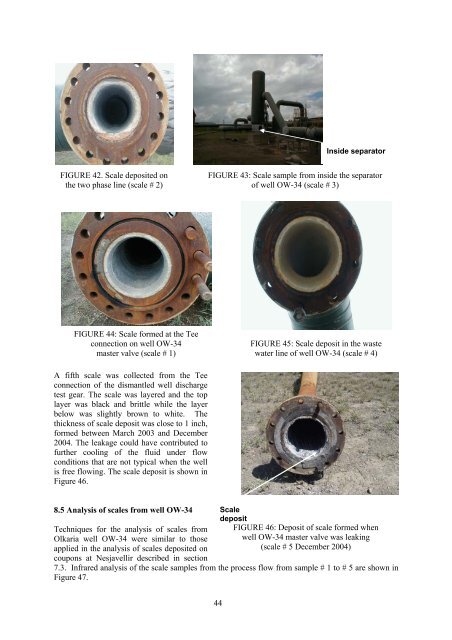
Inside separ<strong>at</strong>or<br />
FIGURE 42. Scale deposited on<br />
the two phase l<strong>in</strong>e (scale # 2)<br />
FIGURE 43: Scale sample from <strong>in</strong>side the separ<strong>at</strong>or<br />
of well OW-34 (scale # 3)<br />
FIGURE 44: Scale formed <strong>at</strong> the Tee<br />
connection on well OW-34<br />
master valve (scale # 1)<br />
FIGURE 45: Scale deposit <strong>in</strong> the waste<br />
w<strong>at</strong>er l<strong>in</strong>e of well OW-34 (scale # 4)<br />
A fifth scale was collected from the Tee<br />
connection of the dismantled well discharge<br />
test gear. The scale was layered <strong>and</strong> the top<br />
layer was black <strong>and</strong> brittle while the layer<br />
below was slightly brown to white. The<br />
thickness of scale deposit was close to 1 <strong>in</strong>ch,<br />
formed between March 2003 <strong>and</strong> December<br />
2004. The leakage could have contributed to<br />
further cool<strong>in</strong>g of the fluid under flow<br />
conditions th<strong>at</strong> are not typical when the well<br />
is free flow<strong>in</strong>g. The scale deposit is shown <strong>in</strong><br />
Figure 46.<br />
8.5 Analysis of scales from well OW-34<br />
Techniques for the analysis of scales from<br />
Olkaria well OW-34 were similar to those<br />
applied <strong>in</strong> the analysis of scales deposited on<br />
coupons <strong>at</strong> Nesjavellir described <strong>in</strong> section<br />
Scale<br />
deposit<br />
FIGURE 46: Deposit of scale formed when<br />
well OW-34 master valve was leak<strong>in</strong>g<br />
(scale # 5 December 2004)<br />
7.3. Infrared analysis of the scale samples from the process flow from sample # 1 to # 5 are shown <strong>in</strong><br />
Figure 47.<br />
44


