Package 'charm' - Bioconductor
Package 'charm' - Bioconductor
Package 'charm' - Bioconductor

Create successful ePaper yourself
Turn your PDF publications into a flip-book with our unique Google optimized e-Paper software.
30 qcReport<br />
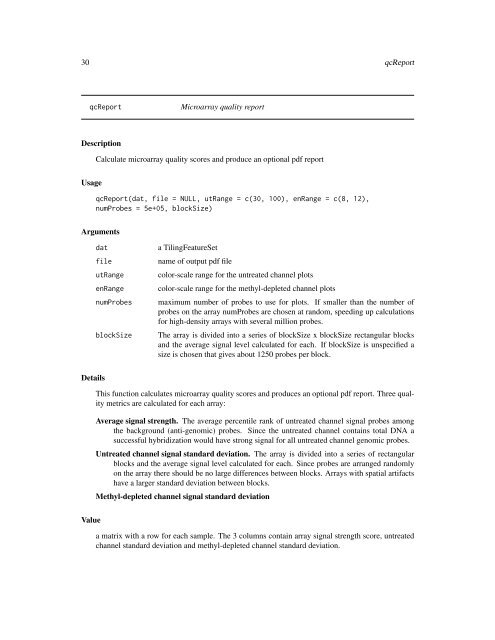
qcReport<br />
Microarray quality report<br />
Description<br />
Calculate microarray quality scores and produce an optional pdf report<br />
Usage<br />
qcReport(dat, file = NULL, utRange = c(30, 100), enRange = c(8, 12),<br />
numProbes = 5e+05, blockSize)<br />
Arguments<br />
dat<br />
file<br />
utRange<br />
enRange<br />
numProbes<br />
blockSize<br />
a TilingFeatureSet<br />
name of output pdf file<br />
color-scale range for the untreated channel plots<br />
color-scale range for the methyl-depleted channel plots<br />
maximum number of probes to use for plots. If smaller than the number of<br />
probes on the array numProbes are chosen at random, speeding up calculations<br />
for high-density arrays with several million probes.<br />
The array is divided into a series of blockSize x blockSize rectangular blocks<br />
and the average signal level calculated for each. If blockSize is unspecified a<br />
size is chosen that gives about 1250 probes per block.<br />
Details<br />
This function calculates microarray quality scores and produces an optional pdf report. Three quality<br />
metrics are calculated for each array:<br />
Average signal strength. The average percentile rank of untreated channel signal probes among<br />
the background (anti-genomic) probes. Since the untreated channel contains total DNA a<br />
successful hybridization would have strong signal for all untreated channel genomic probes.<br />
Untreated channel signal standard deviation. The array is divided into a series of rectangular<br />
blocks and the average signal level calculated for each. Since probes are arranged randomly<br />
on the array there should be no large differences between blocks. Arrays with spatial artifacts<br />
have a larger standard deviation between blocks.<br />
Methyl-depleted channel signal standard deviation<br />
Value<br />
a matrix with a row for each sample. The 3 columns contain array signal strength score, untreated<br />
channel standard deviation and methyl-depleted channel standard deviation.