Norton - Neural Networks and Machine Learning Lab - Brigham ...
Norton - Neural Networks and Machine Learning Lab - Brigham ...
Norton - Neural Networks and Machine Learning Lab - Brigham ...

Create successful ePaper yourself
Turn your PDF publications into a flip-book with our unique Google optimized e-Paper software.
Separation<br />
5.0<br />
4.5<br />
4.0<br />
3.5<br />
3.0<br />
2.5<br />
2.0<br />
1.5<br />
1.0<br />
0.5<br />
Hebbian <strong>Learning</strong> (Pathological Synchrony)<br />
R<strong>and</strong>om Updates (Pathological Synchrony)<br />
0.0<br />
0 10 20 30 40 50 60 70 80 90 100<br />
Iterations of Training<br />
Hebbian <strong>Learning</strong> (Over-Stratification)<br />
R<strong>and</strong>om Updates (Over-Stratification)<br />
Fig. 4 Separation values for four experiments given<br />
completely r<strong>and</strong>om input. Separation values are the mean<br />
reported by ten trials each with a different initial liquid. The<br />
Hebbian learning trials don’t show a significant change in<br />
separation while the r<strong>and</strong>om weight update trials show a<br />
steady drop in separation after only ten iterations.<br />
frequency cepstral coefficients (mfcc) as is common in<br />
speech applications [9]. The frame size for the Fourier<br />
transform was 256 bytes with a frame step of 128 bytes.<br />
Thirteen input neurons were used, one for each of the<br />
thirteen mfcc's. The firing rate of each of these neurons was<br />
determined with the following equation taken from [6]:<br />
mfcc<br />
i<br />
( t)<br />
Rate<br />
i<br />
( t)<br />
= ⋅ MaxRate<br />
( Ωi<br />
−ωi<br />
)<br />
where Ω represents the largest frequency for a given mfcc,<br />
ω represents the smallest frequency, <strong>and</strong> t is the time<br />
interval of a given firing rate, determined by the frame step.<br />
Hebbian <strong>Learning</strong><br />
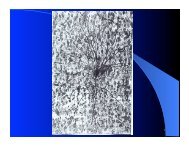
Figure 5 demonstrates how the physical structure of the<br />
liquid changes with training. The images show how the<br />
synapses (lines) connect to each of the neurons (dots). The<br />
brighter the synapse, the stronger the magnitude of the<br />
weight. We don’t differentiate between positive <strong>and</strong><br />
negative weights. Black synapses have effectively zero<br />
weight. When stimulated with r<strong>and</strong>om input, Hebbian<br />
learning eliminates many of the synapses while<br />
strengthening those that remain. R<strong>and</strong>om weight updates,<br />
on the other h<strong>and</strong>, results in overall significantly<br />
strengthened synapses after r<strong>and</strong>om stimulation.<br />
Figures 6 <strong>and</strong> 7 demonstrate how the spiking patterns of<br />
each experiment change with training. For each graph, the<br />
x-axis represents time in seconds <strong>and</strong> the y-axis the neuron<br />
ID number (there are 135 total). Hebbian learning relieves<br />
the state of pathological synchrony as seen in the reduction<br />
of firing (Fig. 6). It also overcomes over-stratification by<br />
generating denser firing patterns. R<strong>and</strong>om weight updates<br />
results in over-stratification regardless of the initial state<br />
(Fig. 7). This seems unusual since the synapses are much<br />
stronger according to the results in Figure 5. This occurs<br />
because most of the synapses become strongly inhibitory<br />
due to the mean negative weight update.<br />
B. Effects of Non-R<strong>and</strong>om input on HLSMs<br />
For this experiment, the effects of non-r<strong>and</strong>om input on an<br />
HLSM’s separation were tested in order to predict how the<br />
HLSM may behave as a complete machine learning<br />
architecture. The input for this experiment was a selection<br />
of 3519 training files from the TIDIGIT dataset [8]. These<br />
files consist of different people speaking single digits: one<br />
through nine, <strong>and</strong> zero <strong>and</strong> ‘oh’ (both for 0). To convert the<br />
files into spike trains, all silence was removed from the<br />
sound files, <strong>and</strong> they were converted into thirteen Mel<br />
Iterations<br />
of Training<br />
Iterations<br />
of Training<br />
0 1 100<br />
R<strong>and</strong>om Weight Updates<br />
0 1 100<br />
Fig. 5 The physical characteristics of the liquid can be seen<br />
before <strong>and</strong> after training. Bright colors indicate strong weights<br />
(either negative or positive), dark colors indicate weak weights.<br />
Top: Hebbian learning eliminates many of the synapses while<br />
strengthening those that remain. Bottom: R<strong>and</strong>om weight<br />
updates results in overall significantly strengthened synapses<br />
after r<strong>and</strong>om stimulation.<br />
Iterations<br />
of Training<br />
Iterations<br />
of Training<br />
Pathological Synchrony in Initial State<br />
0 1 100<br />
Over-Stratification in Initial State<br />
0 1 100<br />
Fig. 6 Spiking patterns in liquids trained with Hebbian<br />
learning. Top: the pathological synchrony state of the liquid<br />
is somewhat relieved by Hebbian learning—there are fewer<br />
neurons firing continuously <strong>and</strong> less dense patterns of firing.<br />
Bottom: Over-stratification is clearly relieved by iteration 100<br />
through the Hebbian process.