The Questions That We'd Like to Answer: - HEASARC
The Questions That We'd Like to Answer: - HEASARC
The Questions That We'd Like to Answer: - HEASARC

Create successful ePaper yourself
Turn your PDF publications into a flip-book with our unique Google optimized e-Paper software.
X-ray Timing Analysis<br />
*Michael Nowak - Chandra X-ray Science Center/MIT<br />
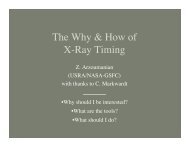
<strong>The</strong> <strong>Questions</strong> <strong>That</strong> We’d <strong>Like</strong> <strong>to</strong> <strong>Answer</strong>:<br />
Does My Source Vary?<br />
On What Time Scales Does it Vary?<br />
Are the Variations Periodic or Aperiodic?<br />
How Do Different Energy Bands Relate <strong>to</strong> One Another?<br />
*(With Some Judicious Stealing of Slides from Z. Arzoumanian’s 2003 X-ray Astronomy School Talk)
Characteristic Time Scales:<br />
≥R/V, V ≤ c, R ≥ 2 GM/c 2<br />
≥1000 sec 10 8 M . (AGN)<br />
≥100 μsec 10 M . (BHC)<br />
≥75 μsec 1.4 M . (NS)<br />
<strong>The</strong>se are the Fastest Achievable Time Scales. In Reality,<br />
<strong>The</strong>re Can be Variability on a Range of Time Scales.
X 1820-303<br />
(11 minute orbit)<br />
180 Day Superorbital Period msec QPO
Rotational Periods:<br />
msec - sec for NS/WD<br />
hr - days for Stars<br />
Accretion Time Scales:<br />
Dynamical, <strong>The</strong>rmal, Viscous<br />
Time Scales<br />
msec - days for NS/BHC<br />
minutes - years for AGN<br />
Orbital Time Scales:<br />
minutes <strong>to</strong> days for NS/BHC<br />
Suber-orbital periods:<br />
weeks <strong>to</strong> months
What are the Tools of the Trade?<br />
Spectra: XSPEC; Sherpa, ISIS - A Few Hardy Souls Run <strong>The</strong>ir Own<br />
Timing: Xronos - Which Some People Use<br />
Most People “Roll <strong>The</strong>ir Own”<br />
Cus<strong>to</strong>m Fortran/C Code<br />
IDL or MATLAB<br />
Me: Converting over <strong>to</strong> S-lang run Under ISIS/Sherpa<br />
(http://space.mit.edu/CXC/analysis/SITAR<br />
- contributions welcome!)
Timing Starts with a Lightcurve<br />
Different Spacecraft can have different<br />
<strong>to</strong>ols for creating Lightcurves<br />
f<strong>to</strong>ols, dm<strong>to</strong>ols, xselect<br />
Always choose integer multiple of<br />
“natural” time unit for binning<br />
Don’t bin any more than you have <strong>to</strong> -<br />
save it for subsequent analysis<br />
Example: dmextract infile="4u2129_chandra.fits<br />
[EVENTS] [sky=region(source.reg)][bin time=::1.14104]"<br />
outfile=4u2129_ps.fits opt=ltc1
Length & Binning Determine Limits<br />
Lowest Frequency: flong = 1/T<br />
T, N=T/t<br />
Highest Frequency: Nyquist Frequency,<br />
fNyq = 1/(2t)<br />
Basic Question, is the Variance:<br />
. σ 2 = 〈x 2 〉 − 〈x〉 2<br />
Greater than Expected from Poisson<br />
Noise?<br />
σ = Root Mean Square Variability<br />
t
Variability Test I: Excess Variance<br />
Binned Lightcurve with Values:<br />
σ 2 rms = 1<br />
Nµ 2 N ∑<br />
i=1<br />
X i ± σ i<br />
and mean:<br />
[<br />
(Xi − µ) 2 − σ 2 i<br />
]<br />
µ<br />
∆σ 2 rms = s D /(µ 2√ N)<br />
s 2 D = 1<br />
N − 1<br />
N∑<br />
i<br />
([<br />
(Xi − µ) 2 − σ 2 i<br />
]<br />
− σ<br />
2<br />
rms µ 2) 2<br />
See Turner et al. 1999, ApJ, 524, p. 667 ; Nandra et al. 1997, ApJ, 476, p. 70
Test II: Kolmogorov-Smirnov<br />
Technique for determining whether two<br />
cumulative distributions are the same.<br />
Example: Is cumulative arrival time<br />
consistent with constant rate?<br />
Could have instead done distribution of<br />
times inbetween events.<br />
Significance = 8 X 10 -5<br />
Uniform Rate<br />
Distribution<br />
Observed Arrival Time<br />
Distribution<br />
See Press et al., “Numerical Recipes”,<br />
plus lots of other better statistics books<br />
D = Maximum Deviation<br />
Only answers whether there is variability<br />
- doesn’t characterize it
Ninja Topic: Bayes Stats<br />
Bayesian Methods Don’t Require Binning<br />
(Case below: event times only!)<br />
Gregory & Loredo (1992, ApJ, 398, p.<br />
146) - Determines Optimal Uniform<br />
Binning. (Eventually a Ciao Version)<br />
t = fits_read_col("4u2129_chandra.fits",”time”);<br />
cell = sitar_make_data_cells(t,2,0.7,1.14104,min(t),max(t));<br />
ans = sitar_global_optimum(cell,3.5,2);<br />
Bayesian Blocks (J. Scargle, in prep.) -<br />
Determines Optimal Non-uniform<br />
Binning. (S-lang Version on SITAR page)<br />
Drawbacks: No ‘Frequentist’ Significance<br />
Levels. Only ‘Odds Ratios’ or ‘Penalty<br />
Fac<strong>to</strong>rs’.
{<br />
Fourier Transform Methods<br />
<strong>The</strong> Workhorse of the Timing World<br />
How is Variability Power Distributed as a Function of Frequency?
Fast Fourier Transform (FFT)<br />
X j ≡<br />
N−1<br />
∑<br />
k=0<br />
x k exp(2πijk/N) ,<br />
P j = 2|X j | 2 /(Rate 2 × T <strong>to</strong>tal )<br />
j = [−N/2, . . . , 0, . . . , N/2]<br />
(“One Sided” RMS Normalization)<br />
P j = 2|X j | 2 /(Rate × T <strong>to</strong>tal )<br />
Lightcurve with: N bins, Comprised of Counts, xi, becomes Power Spectrum, with N/2+1<br />
independent Amplitudes, and N/2-1 independent Complex Phases (for Real Inputs)<br />
Good FFTs Usually Optimized for N = Power of 2 (RXTE Clock Runs in Powers of 2!)<br />
Know Your Normalization!!! Various FFT Routines Have Different Ones!<br />
Power Spectrum is the Squared Fourier Amplitude, Properly Normalized<br />
Power Spectrum is Throwing Out Information! Not Unique!<br />
(“One Sided” Leahy Normalization)
Ninja Topic: Convolution/Cross<br />
Correlation <strong>The</strong>orem<br />
h ∗ g (t) ≡<br />
∫ ∞<br />
G(f) ≡ F [g(t)] ≡<br />
−∞<br />
∫ ∞<br />
h(τ)g(t + τ) dτ<br />
−∞<br />
F [h ∗ g] = F ∗ (f)G(f)<br />
g(t)e −2πift dt<br />
Power Spectral Density (PSD, or Power Density Spectrum/PDS) is just the Fourier<br />
Transform of the Au<strong>to</strong>-correlation Function (i.e., h(t) = g(t)).<br />
Cross Power Spectral Density (CPD) is just the Fourier Transform of the Crosscorrelation<br />
Function
FFT Normalizations<br />
Leahy: Poisson Noise Level = 2, Intrinsic Power Scales as Rate<br />
RMS: Intrinsic Power Independent of Rate, Noise Level = 2/Rate<br />
Integral of PSD is Measure of Root Mean Square Variability<br />
∫<br />
A = P rms df = ∑ Prms∆f j , ∆f = 1/T<br />
j<br />
(<br />
√ 〈x 2 〉 − 〈x〉 2 ) 1/2<br />
A = rms/mean =<br />
〈x〉 2<br />
Pulsed Fraction (Coherent Oscillation): f p =<br />
√<br />
2(PLeahy − 2)<br />
Rate<br />
PSD Normalizations are Often Plotted as (RMS) 2 /Hz
PSD Statistics<br />
Leahy Noise Level is 2 +/- 2 (Distributed as<br />
χ 2<br />
with 2 DoF)<br />
Increasing Lightcurve Length Doesn’t Help - Distributes Noise<br />
Among More Frequency Bins!<br />
“Statistically Stationary Processes” Have Power = Pj +/- Pj<br />
Reduce Noise by Averaging PSD from Individual Lightcurve<br />
Segments, as Well as Over (Usually Logarithmically Spaced)<br />
Adjacent Frequency Bins<br />
Errors Reduced by Fac<strong>to</strong>r of:<br />
√<br />
Navg
Example: Cyg X-1 (RXTE)<br />
“Band Limited Noise”<br />
White Noise<br />
Red Noise<br />
Effective Noise Level ∝ 1/ √ f<br />
Nowak et al. 1999, ApJ, 510, p. 874
With:<br />
P ′ j = (P j − P noise ) ± P j / √ N avg<br />
You Can Fit Models<br />
) 1/2<br />
( ∑<br />
Note: Total RMS = Incoherent Sum of Components, i.e.,<br />
i<br />
Advice: Fit Models that Average over Frequency Bin Widths<br />
RMS 2 i
Quasi-Periodic Oscillations (QPO)<br />
Q-value (Coherence) = f/ΔfFWHM<br />
Width Can Come From: Finite Length of Data Segment, Finite<br />
Duration of Signal, Random Walk in Phase (e.g., Damped,<br />
Driven Oscilla<strong>to</strong>rs), Random Walk in Frequency, ...
Ninja Topic: Deadtime<br />
Detec<strong>to</strong>r ‘Deadtime’ = When a Pho<strong>to</strong>n Event Prevents Subsequent Events from Being<br />
Detected (‘Paralyzable’ /‘Non-paralyzable’ is When an Event During the Deadtime<br />
Does/Does Not Increase the Length of the Deadtime), or ...<br />
When the Detec<strong>to</strong>r Does Not Take Data, e.g., during Readout (e.g., Chandra), or ...<br />
Deadtime Modifies the Power Spectrum of Poisson Noise from the Expected<br />
PLeahy = 2 (Usually <strong>to</strong> Something < 2)<br />
See: Zhang et al. 1995, ApJ, 449, p. 930; Morgan et al. 1997, 482, p. 993; Nowak<br />
et al. 1999, ApJ, 510, p. 874
Proposal Estimates<br />
Detecting Broad Band Noise at the<br />
n σ<br />
confidence level:<br />
RMS 2 limit ≈ 2n σ<br />
√<br />
∆f/<br />
√Rate 2 × T <strong>to</strong>tal<br />
Detecting Coherent Pulsations:<br />
f limit<br />
p<br />
= 4n σ /(Rate × Time)<br />
For Broad Band Timing, You Win More with Rate than Time<br />
Searches for Coherent Pulsations (e.g., Pulsars) are Best Done<br />
Unbinned
Coherent Pulsations:<br />
Barycentering the data (fxbary/axbary) important.<br />
Short Data Segments, <strong>to</strong> Search for (Binary) Orbital Variation
Ninja Topic: Aliasing!<br />
Signal Can Appear at Sum and Difference Frequencies of Primary Signals<br />
This is True Whether the Signal is “Real” or “Fake” (e.g., Sampling Periods)<br />
Beware Characteristic Times! Spacecraft orbits, dither time scale, 1 year, ...<br />
Example: RXTE-All Sky Moni<strong>to</strong>r - Many sources show periods at 24 hours +/- a small<br />
bit. This is the beating of a large power 1/Many Year Secular Change with a 24<br />
hour sample Period (e.g., from AGN moni<strong>to</strong>ring).
Ninja Topic: Phase Info<br />
<strong>The</strong>re are Statistics <strong>That</strong> Also Deal with Fourier Phase - Cross Correlations!<br />
Gives the Frequency Dependent Time-lag between Hard and Soft Components<br />
See: Vaughan & Nowak 1997, ApJ, 474, L43; Nowak et al. 1999, ApJ, 510, p. 874
Ninja Topic: Cross Correlations<br />
〈CP D〉 =<br />
〈H ∗ G〉<br />
(〈|H| 2 〉〈|G| 2 〉) 1/2 , γ 2 (f) ≡ |〈H∗ G〉| 2<br />
〈|H| 2 〉〈|G| 2 〉<br />
Complex Phase is Called the “Phase Lag”,<br />
Divided by 2πf is Called the “Time Lag”<br />
Keep track of signs! Depending upon Algorithm,<br />
and Whether You Use Forward or Backward<br />
Transform, that Can Alter the Sign. (See Nowak<br />
et al. for Associating this with Lag/Lead.)<br />
Υ 2 (f) is the “Coherence Function” (Distinct from<br />
Coherence, Q!). Measures Degree of Linear<br />
Correlation.
Epoch Folding & Period Searches<br />
Good for Non-sinusoidal Variations<br />
Good for When there are Data Gaps or Complicated Window Functions<br />
Not Good for Aperiodic Variability<br />
event = sitar_readasm("xa_x1820-303_d1",,,1.2);<br />
fld = sitar_epfold_rate(event.time,event.rate,10,500,20,2000);<br />
xlabel("Trial Period"); ylabel("L Statistic");<br />
plot(fld.prd,fld.lstat);<br />
Xronos has epoch folding, various IDL<br />
routines can be found on the web.<br />
Read the literature on significance levels!
Reiterating Words of Advice:<br />
Bin the Lightcurve on Integer Multiples of “Natural” Time Scales<br />
Do FFTs with Evenly Spaced Bins (Lomb-Scargle for Unevenly Spaced Bins), and Avoid<br />
Data Gaps (see literature if dealing with Gaps)<br />
Beware of Signals that Appear on Characteristic Time Scales (of Spacecraft, Earth, etc.)<br />
Large Literature with Many Techniques for Those with Strong Kung Fu
References for Further Reading<br />
van der Klis, M. 1989, “Fourier Techinques in X-ray Timing”, in Timing Neutron Stars,<br />
NATO ASI 282, Ögelman & van den Heuvel eds., Kluwer<br />
Press et al., “Numerical Recipes” (Discussions Only! Better Code Exists on the Web!)<br />
Leahy et al. 1983, ApJ, 266, p. 160<br />
Leahy et al. 1983, ApJ, 272, p. 256<br />
Davies 1990, MNRAS, 244, p. 93<br />
(FFT & PSD Statistics)<br />
(Epoch Folding)<br />
(Epoch Folding Statistics)<br />
Vaughan et al. 1994, ApJ, 435, p. 362 (Noise Statistics)