You also want an ePaper? Increase the reach of your titles
YUMPU automatically turns print PDFs into web optimized ePapers that Google loves.
The World’s Guide to Commercial Remote Sensing<br />
Fall 2004 Vol. 19 No. 4<br />
Gaza<br />
Strip<br />
images<br />
of<br />
destruction<br />
Hydroelectric<br />
Re-licensing<br />
Commercial Air<br />
Transportation<br />
Gains Critical<br />
New Service<br />
© 2 0 0 4 S P A C E I M A G I N G w w w . i m a g i n g n o t e s . c o m<br />
Civil Crisis<br />
Information for<br />
Humanitarian<br />
Relief<br />
S P R I N G 2 0 0 4<br />
3
contents vol.19 no.4<br />
fall 2004<br />
departments<br />
4<br />
Cover Image<br />
Merrill Pass in Alaska<br />
6 MarketScan<br />
Industry Info<br />
8<br />
31<br />
Policy Watch<br />
Fresh Water: Political and Social Tensions<br />
Events Calendar<br />
12<br />
26<br />
16<br />
features<br />
12<br />
Enhancing Commercial<br />
Air Transportation<br />
International Air Transport Association<br />
offers invaluable service<br />
16<br />
21<br />
26<br />
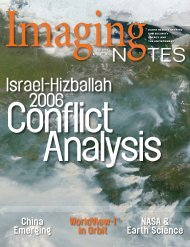
Verifying Destruction in the<br />
Gaza Strip<br />
Imagery provides objective view<br />
Civil Crisis Information<br />
Providing emergency mapping and<br />
disaster monitoring for humanitarian relief<br />
Hydroelectric Re-licensing<br />
PG&E’s use of imagery<br />
w w w . i m a g i n g n o t e s . c o m<br />
F A L L 2 0 0 4<br />
3
cover image<br />
Merrill Pass, Alaska<br />
THE WORLD’S GUIDE TO COMMERCI A L REMOTE SENSING<br />
Fall 2004 / Vol. 19 / No. 4<br />
PUBLISHER<br />
Myrna James Yoo<br />
Publishing Partnerships LLC<br />
my rna @ publishingpartnerships.com<br />
A RT DIRECTOR<br />
Jürgen Mantzke<br />
Enfineit z LLC<br />
jmant zke @ earthlink.net<br />
w w w.enfineit z.com<br />
EDITORI A L CONTRIBUTIONS<br />
<strong>Imaging</strong> <strong>Notes</strong> welcomes contributions<br />
for feature articles. We publish articles on<br />
the remote earth imaging industry, including<br />
applications, technology, and business.<br />
Please see Contributor’s Guidelines on<br />
www.imagingnotes.com, and email proposals<br />
to editor@publishingpartnerships.com.<br />
SUBSCRIPTIONS<br />
To subscribe, please go to<br />
www.imagingnotes.com, and click on ‘subscribe.’<br />
Subscriptions are free for those<br />
who qualify. For changes, please submit<br />
changes with old and new information to<br />
imagingnotes@spaceimaging.com.<br />
<strong>Imaging</strong> <strong>Notes</strong> is published quarterly by<br />
Publishing Partnerships LLC<br />
PO Box 11569, Denver CO 80211<br />
This pass was named for Russ Merrill, who in 1927 was the first pilot<br />
to cross the Alaska Range and fly over the remote Kuskokwim River. It is considered<br />
by many to be one of the most dangerous passes in the Alaska Range due to marginal<br />
weather and a multitude of box canyons surrounding it. Pilots must maintain a minimum<br />
altitude of 4,500 feet through the Pass, and in the past have had to rely on clear<br />
conditions for marginal safety.<br />
Accurate flight simulation training modules using satellite imagery and DEMs are being<br />
developed to mitigate these risks.<br />
The image is a 1-meter color IKONOS image, collected March 6, 2002.<br />
CORRECTION<br />
The editors apologize for an error in the Summer issue of <strong>Imaging</strong> <strong>Notes</strong>, within the feature<br />
story, “Renewable Energy.” Figure 3 is labeled as reflected solar energy. It actually shows<br />
strength and direction of sea-surface winds, and it was derived from the SeaWinds radar<br />
scatterometry instrument on the QuickSCAT satellite from NASA.<br />
<strong>Imaging</strong> <strong>Notes</strong> (ISSN 0896-7091)<br />
Copy right © 2004<br />
by Space <strong>Imaging</strong> LLC<br />
12076 Grant Street<br />
Thornton, CO 80241<br />
A lthough trademark and copy right sy mbols<br />
are not used in this publication, they are<br />
honored.<br />
© 2004 Space <strong>Imaging</strong> L LC<br />
w w w.imagingnotes.com<br />
<strong>Imaging</strong> <strong>Notes</strong> is printed on 20% recycled<br />
(10% post-consumer waste) paper. All inks<br />
used contain a percentage of soy base. Our<br />
printer meets or exceeds all federal<br />
Resource Conservation Recovery Act<br />
(RCRA) Standards.<br />
4 F A L L 2 0 0 4 w w w . i m a g i n g n o t e s . c o m
market scan<br />
Companies and Contracts<br />
MWH Soft, Inc. Signs<br />
New Customers<br />
MWH Soft, Inc., a global provider<br />
of water resources applications<br />
software (Broomfield, Colo.), has<br />
recently signed several contracts,<br />
including the City of Dallas Water<br />
Utilities, Orlando Utilities Commission<br />
(Florida’s second-largest<br />
municipal utility), Massachusetts<br />
Water Resources Authority,<br />
Anchorage Water and Wastewater<br />
Utility (the State of Alaska’s largest<br />
water and wastewater utility),<br />
and Mohawk Valley Water Authority<br />
in the central New York state area.<br />
In addition, the top-ranked<br />
Civil Engineering Department<br />
at Colorado State University<br />
(Fort-Collins, Colo.) is training its<br />
undergraduate students in advanced<br />
hydraulic infrastructure<br />
modeling with MWH Soft H2ONET<br />
software, the industry’s leading<br />
CAD-based water distribution<br />
systems analysis and management<br />
package.<br />
www.mwhsoft.com<br />
Industry Info<br />
Peace Parks Foundation of South Africa<br />
Acknowledged, Provides Inspiration<br />
The Peace Parks Foundation of<br />
South Africa has won the ESRI Presidential<br />
Award. The Presidential Award is<br />
presented as a special recognition by<br />
ESRI President Jack Dangermond to an<br />
organization that is a model for others<br />
to follow in implementing GIS successfully,<br />
while making a positive impact on<br />
the environment and society.<br />
The organization was selected<br />
for its leadership in establishing<br />
peace parks, which are trans-frontier<br />
conservation areas (TFCAs), large<br />
tracts of land that cross international<br />
boundaries, the purpose of which is<br />
Space <strong>Imaging</strong> Sells Federal Civil/Commercial<br />
Solutions Business Unit<br />
Geo360 Corporation (Denver, Colo.) has<br />
agreed to purchase Space <strong>Imaging</strong>’s Federal<br />
Civil/Commercial Solutions business unit.<br />
The group provides mapping and GIS services<br />
to federal, state and local government<br />
customers.<br />
Space <strong>Imaging</strong> will focus on its core business<br />
of selling commercial satellite imagery to<br />
all markets, providing geospatial solutions to<br />
defense and intelligence agencies, and in addition<br />
will continue to serve the international<br />
markets through its Regional Affiliate and<br />
International Alliance programs. The company<br />
will be increasing the scope and diversity of<br />
its defense offerings that include mapping<br />
production, R&D and system engineering<br />
services.<br />
Space <strong>Imaging</strong>’s Federal Civil/Commercial<br />
Solutions line of business was created with<br />
the March 2000 acquisition of Pacific Meridian<br />
Resources. During the last two years<br />
this line of business has exceeded revenue<br />
projections with an annual growth rate of<br />
20 percent while tripling its profitability.<br />
Geo360 is well poised to continue this aggressive<br />
growth.<br />
www.spaceimaging.com<br />
to employ conservation as a land use<br />
option to benefit local people.<br />
Peace Parks Foundation CEO Willem<br />
van Riet said, “GIS has helped fulfill<br />
the vision of peace parks because<br />
of its ability to . . . provide a common<br />
language through geography.”<br />
Professor van Riet has been involved<br />
with GIS since the early 1970s<br />
and used the technology to introduce<br />
the idea of peace parks to South African<br />
President Nelson Mandela, who<br />
founded the Peace Parks Foundation<br />
in 1997 with Dr. Anton Rupert and<br />
Prince Bernhard of the Netherlands.<br />
www.esri.com<br />
Applications<br />
Hurricane Imagery Compelling<br />
This image of Hurricane Frances<br />
was collected by OrbImage’s OrbView-2<br />
“SeaWiFS” satellite on Thursday, Sept. 2<br />
at approximately 1 p.m. EST, when it was<br />
a category 4 storm. The image shows<br />
Frances heading west-northwest over<br />
the Bahamas.<br />
Vexcel Ground Station Systems Assist in<br />
Hurricane Early Warning<br />
Vexcel (Boulder, Colo.) remote sensing<br />
systems at the Center for Southeastern<br />
Tropical Advanced Remote<br />
Sensing (CSTARS) captured and processed<br />
MODIS satellite images of Hurricane<br />
Frances as it moved in a westnorthwest<br />
path through the Bahamas<br />
and towards the Florida coastline. The<br />
images provided early information about<br />
the hurricane’s cloud and convection<br />
patterns as well as the size of the eye,<br />
allowing agencies such as the National<br />
Hurricane Center (NHC) and the National<br />
Weather Service (NWS) to monitor its<br />
size and shape in near real-time.<br />
Using satellite imagery, researchers<br />
have discovered that the size of a storm<br />
is not as important as the shape; the<br />
greater the degree of spiraling in a hurricane,<br />
the more mature and intense it is.<br />
CSTARS advanced imaging techniques<br />
assist regional engagement support for<br />
emergency planning and natural disaster<br />
response and relief. The facility’s ground<br />
system was designed by Vexcel for<br />
autonomous operation with little manual<br />
intervention, high reliability and minimal<br />
downtime.<br />
In addition to MODIS, the Vexcel<br />
system at CSTARS supports low-Earth<br />
orbiting satellites that include RADARSAT,<br />
SPOT, TERRA/AQUA, ERS-2 and Envisat,<br />
enabling the center to provide critical<br />
data for environmental monitoring of<br />
the Southeastern U.S., northern South<br />
America, Central America, the Gulf of<br />
Mexico, and the Caribbean Basin.<br />
www.vexcel.com<br />
6 F A L L 2 0 0 4 w w w . i m a g i n g n o t e s . c o m
COURTESY OF ORBIMAGE<br />
w w w . i m a g i n g n o t e s . c o m<br />
Hurricane Frances (OrbImage)<br />
Detail of Merrill Pass in Alaska (IKONOS)<br />
Alaska Aviation Safety Project Improves<br />
Navigation of Key Mountain Passes<br />
The Alaska Department of Military and<br />
Veterans Affairs (ADMVA) will work with<br />
IKONOS imagery for the new Alaska Aviation<br />
Safety Project (AASP). The ADMVA has contracted<br />
with E-Terra (Anchorage, Alaska)<br />
to use $1.6 million of IKONOS imagery in<br />
developing accurate flight simulation<br />
training modules of 12 mountain passes<br />
for the AASP. Under a Federal Grant administered<br />
by NASA, the project’s purpose is<br />
to provide the general aviation community<br />
an enhanced air navigation safety tool<br />
depicting these Alaska mountain passes<br />
in 3-D rendering. The project plan included<br />
acquisition of two types of digital imagery<br />
data sets to aid in the research and development<br />
of an aviation safety and training<br />
product for use by the Rescue Coordination<br />
Center rescue aircraft. The Medallion<br />
Foundation, a non-profit aviation safety<br />
organization that provides management<br />
resources, training and support to the<br />
commercial and private Alaskan aviation<br />
community, will also utilize the E-Terra<br />
training modules.<br />
Alaska is one of the world’s most heavily<br />
aviation-dependent regions, with approximately<br />
600 public airports and more<br />
than 3,000 airstrips. Although Alaska has<br />
approximately 10 percent of the nation’s<br />
air carriers or commercial operators, it<br />
generates 35 percent of the nation’s air<br />
carrier and commercial operator accidents.<br />
A disproportionate number of these<br />
accidents occur when pilots fly these 12<br />
mountain passes, most of which connect<br />
Anchorage with the Alaskan interior.<br />
Several types of three-dimensional<br />
visualizations were created, from animations<br />
with two and three-dimensional<br />
viewing capabilities to full free-flight<br />
simulations and cockpit control. These<br />
visualizations involved fly-through views<br />
of Lake Clark Pass and Merrill Pass. All<br />
of the three-dimensional visualizations<br />
were created by overlaying two types<br />
of remote sensing data: IKONOS satellite<br />
imagery draped over digital elevation<br />
models from IfSAR (Interferometric Synthetic<br />
Aperture Radar) aircraft-mounted<br />
sensors collected by Intermap.<br />
F A L L 2 0 0 4<br />
7
policy watch<br />
Fresh water<br />
The stuff of life<br />
and the focus of<br />
future political<br />
and social tensions<br />
Water — essential to life and to<br />
national economies; clean, fresh water is<br />
becoming increasingly difficult to obtain,<br />
especially in arid and semi-arid climates. In<br />
the near future, ensuring adequate supplies<br />
of fresh water to support all the competitive<br />
water needs is likely to be one of the most<br />
crucial and contentious issues facing global<br />
society. Governments will face tensions<br />
in the future that are now very evident in<br />
southeastern Australia, where they appear<br />
in microcosm in the disputes among the<br />
states of the Murray-Darling River Basin.<br />
The crucial need to secure fresh<br />
water sufficient to the needs of southeastern<br />
Australia is what prompted the<br />
Australian hosts of this year’s International<br />
Space University’s Summer Session<br />
Program (ISU’s SSP) in Adelaide to<br />
request a study of what space systems<br />
can bring to the management of this<br />
enormous river system. The study, one of<br />
three team projects, illustrated how satellite<br />
remote sensing can contribute to<br />
the resolution of thorny political issues.<br />
Stretching from north of Sydney westward<br />
across southeast Australia to the<br />
mouth of the Murray River near Adelaide,<br />
the Murray and Darling Rivers drain most<br />
of southeastern Australia. This river basin<br />
area makes up 40 percent of Australia’s<br />
agricultural production, and grazing income<br />
sustains some 30 percent of its population,<br />
including four of its five largest cities:<br />
Adelaide, Canberra, Melbourne, and Sydney.<br />
Sydney, Australia (IKONOS)<br />
8 F A L L 2 0 0 4 w w w . i m a g i n g n o t e s . c o m
w w w . i m a g i n g n o t e s . c o m<br />
F A L L 2 0 0 4<br />
9
policy watch<br />
Originally settled by different groups of<br />
Aboriginal Peoples from South Asia some<br />
50,000 years ago, Australia was explored<br />
and settled by Northern Europeans<br />
beginning in the 17th century. These new<br />
arrivals conquered the native groups and<br />
appropriated the best of their traditional<br />
lands, while generally ignoring the lessons<br />
that thousands of years of settlement had<br />
taught Aboriginal communities about land<br />
and water stewardship.<br />
Among the many new technologies<br />
and societal constructs that these settlers<br />
brought with them were European<br />
notions of water management to the<br />
ecologically different Murray-Darling<br />
Basin. In an effort to spur economic<br />
development and support agriculture,<br />
manufacturing, and tourism, successive<br />
federal and state governments<br />
built dams and weirs along the rivers,<br />
streams, and tributaries of the basin in<br />
an attempt to control the river.<br />
Unfortunately, these methods are often<br />
unsustainable in the Australian environment.<br />
In the process of building agriculture<br />
and other water-intensive industries, such<br />
efforts have led to increased soil salinity,<br />
loss of wild habitat, and decreased biodiversity.<br />
They have also made the basin<br />
more vulnerable to climatic changes and<br />
increased anxiety over assuring sufficient<br />
fresh water supplies to serve the nation’s<br />
major urban centers.<br />
This July and August, 37 SSP program<br />
participants took part in STREAM (Space<br />
Technologies for the Research of Effective<br />
Water Management), a detailed study of<br />
fresh water supply and demand in the<br />
region. They especially examined the contributions<br />
that space technologies could<br />
make to the assessment and management<br />
of fresh water sources and distribution.<br />
Residents of the Murray-Darling Basin<br />
face problems of securing adequate water<br />
to support their growing needs, and an<br />
uncertain future climate.<br />
Although the project focused primarily<br />
on the Murray-Darling Basin, the lessons<br />
drawn from this case study can be extrapolated<br />
to nearly every other area in the<br />
world where the supply and management of<br />
fresh water is at issue.<br />
Centered in Strasbourg, France, ISU<br />
holds a professional, graduate-level<br />
international educational program each<br />
year for professionals and students<br />
wishing to expand their knowledge of<br />
the world’s space efforts. This year, 114<br />
participants from 27 countries met in Adelaide<br />
for nine weeks to take part in an<br />
intensive, interdisciplinary, intercultural<br />
program of space studies. About onethird<br />
of that program is devoted each<br />
year to two or three team projects.<br />
Space-based remote sensing clearly<br />
provides certain advantages for monitoring<br />
Earth’s environmental systems over<br />
time. The synoptic view, repeatability and<br />
consistency of view, and digital format<br />
make space systems especially constructive.<br />
Thanks to private sector as well as<br />
government investment, the world now has<br />
sufficient operational satellites of different<br />
spatial and spectral resolutions to monitor<br />
the entire basin at different scales in order<br />
to examine vegetation health, water quality,<br />
and water distribution. A vibrant valueadded<br />
industry has emerged that can turn<br />
these data into useful information.<br />
In time, the research community will<br />
develop sensors to monitor rainfall, soil<br />
moisture, and soil salinity, which are all<br />
crucial information needs for long term<br />
water management. However, to be used<br />
for operational purposes in support of<br />
crucial environmental needs, successful<br />
sensors need to be incorporated into<br />
operational satellite systems. Increasingly,<br />
as the water shortages in the Murray-Darling<br />
Basin illustrate, large regional<br />
environments will have to be managed.<br />
Remotely-sensed data from satellites<br />
provide one of the means for doing so.<br />
Developing additional operational sensors<br />
for environmental management will<br />
require governments to admit that investments<br />
in operational satellites for public<br />
needs is part of their responsibility. The<br />
SSP04 participants hope that their study<br />
will help convince policymakers that investments<br />
in satellite-derived information<br />
will provide enormous long-term benefits.<br />
Yet potential users of the information<br />
that satellite systems provide generally<br />
do not care about the systems from which<br />
the information comes, as long as it is<br />
reliable and capable of fulfilling their information<br />
needs. The issue becomes how to<br />
convince them to invest greater resources<br />
in the use of data from space systems.<br />
Not only did the ISU report highlight<br />
the strong importance of satellite remote<br />
sensing in monitoring, assessing, and<br />
managing fresh water resources, it also<br />
underlined the enormous contributions<br />
that a dedicated set of professionals can<br />
bring to a complex subject in a short time.<br />
The study highlighted the need for<br />
the Australian government at both the<br />
federal and state levels to establish<br />
clear, integrated policies for the acquisition<br />
and distribution of satellite data in<br />
the development and delivery of water<br />
resources information. Australia did not<br />
reach its present difficult stage overnight.<br />
It will take considerable foresight<br />
and close attention to the basin’s information<br />
needs to make progress on this<br />
difficult, contentious problem.<br />
Unfortunately, the water problems<br />
experienced in the Murray-Darling Basin<br />
have become all too familiar to many other<br />
parts of the world. The study’s results are<br />
applicable to numerous regions where<br />
burgeoning populations and industrial<br />
development strain water resources — for<br />
example, the Middle East, the Southwest<br />
United States, and parts of Africa.<br />
As policymakers at all levels grow<br />
more comfortable with the use of<br />
information gathered by remote sensing<br />
satellites, they will increasingly be used<br />
to adjudicate environmental disputes<br />
such as access to clean water, clean air,<br />
and other life-sustaining components of<br />
daily life. The task before satellite data<br />
and information providers is to make this<br />
information more accessible and available<br />
to a broader range of the population<br />
— to all equities within society.<br />
RAY A. WILLIAMSON is research professor<br />
of space policy and international affairs<br />
in the Space Policy Institute of The George<br />
Washington University, Washington, D.C.<br />
10 F A L L 2 0 0 4 w w w . i m a g i n g n o t e s . c o m
IATA<br />
offers<br />
new<br />
critical<br />
service<br />
DEJAN DAMJANOV IC<br />
Domain Manager<br />
Air & Marine<br />
Transportation<br />
Space <strong>Imaging</strong><br />
Thornton, Colo.<br />
www.spaceimaging.com<br />
Figure 1. Example of<br />
an IKONOS image of a<br />
commercial airport<br />
— Brussels<br />
Figure 2. Example<br />
of Airport Mapping<br />
Database (AMDB) of<br />
Brussels, derived from<br />
the image in Figure 1<br />
Figure 3. Example of a<br />
3D visualization of the<br />
island of Madeira off<br />
the coast of Portugal,<br />
a challenging destination<br />
to fly into for<br />
commercial airlines<br />
due to the significant<br />
terrain<br />
The commercial airlines of the world<br />
increasingly have been required to perform a daunting<br />
task — reduce the costs of airline service by whatever<br />
means possible, yet increase the number of destinations<br />
that they can service, in order to grow their revenue<br />
streams and operate as fiscally viable companies. As the<br />
first-world countries and their air services become saturated,<br />
the sole remaining opportunities for growth exist<br />
in servicing the second and third-world countries that<br />
lack extensive air transportation networks.<br />
As the number of destinations increases, so does<br />
the need for training all pilots to fly to more destinations,<br />
which then places upward pressure on training<br />
costs. However, the challenges of the post-9/11 world<br />
have forced the world’s airlines to be very aggressive<br />
about cost containment or cost cutting. This dual<br />
problem is driven in part by the ups and downs of<br />
international fuel prices and by wide fluctuations in<br />
demand for commercial air travel due to events such<br />
as 9/11 and the SARS epidemic in China.<br />
Remote sensing has the capabilities to address<br />
many of the challenges described above by taking<br />
advantage of the unique abilities of high-resolution<br />
satellites. The challenges involved in moving to new<br />
routes in second and third-world countries are not<br />
dissimilar to those that occur in the military when<br />
mission planning to new destinations is done for humanitarian<br />
or military missions. This planning typically<br />
involves the use of satellite information to plan<br />
better the routes to those destinations. Stereo photogrammetry<br />
from in-track stereo imagery is used<br />
to collect 3-D models of the departure and arrival<br />
routes in and out of the new destinations.<br />
The second step that occurs in the military is the<br />
use of mission rehearsal to train pilots actually to fly<br />
in and out of those new destinations. This may be<br />
done on complete full-motion flight simulators, on<br />
desktop procedures trainers, or on laptops or workstations<br />
with a monitor and joystick. Again, highresolution<br />
imagery can be used to build complete<br />
visual simulation databases in order to train pilots<br />
in what is known as “photo-real” visual databases<br />
— where the view in the simulator is exactly the same<br />
as the view out the window in the real aircraft.<br />
Constructing moving map display systems is the<br />
third step, so that, when the pilots fly to and from the<br />
airports, they can use precise vector or raster moving<br />
map display systems to monitor their progress and can<br />
plan for alternate routes in case of adverse weather or<br />
maintenance challenges. These moving map systems are<br />
also derived from high-resolution satellite imagery, superimposed<br />
onto the GPS position of the aircraft in the<br />
air or on the ground.<br />
While all of the above is fine for military air forces<br />
with large discretionary budgets, this procedure has not<br />
been feasible for the world’s commercial airlines, due to<br />
the cost of satellite imagery required for each destination<br />
— it is not uncommon for an airline to serve upwards<br />
of 50-100 individual destinations. A better model<br />
had to be found.<br />
Enter the International Air Transport Association<br />
(IATA). IATA represents some 95 percent of the<br />
world’s commercial airlines. At the end of the Second<br />
World War, the creators of the United Nations formed<br />
an organization known as the International Civil Aviation<br />
Organization (ICAO), to regulate commercial<br />
air transportation worldwide. ICAO’s mandate was to<br />
help all the UN countries to open the airspace of countries<br />
wanting to travel in the new world finally free of<br />
the shackles of World War II. ICAO was headquartered<br />
in Montreal, Canada, and provided the necessary<br />
regulatory framework for all national Civil Aviation<br />
Administrations (ICAO), to control commercial air<br />
transportation. Examples of such national organizations<br />
are the FAA in the U.S., NavCanada in Canada,<br />
and Airservices Australia in Australia.<br />
In order for the commercial airlines to have an<br />
appropriate voice in the conduct of that air transportation,<br />
IATA was created in 1945 with 57 members<br />
from 31 founding nations. Today, IATA has 270<br />
members from 140 countries around the world. Its<br />
primary activities are to promote inter-airline cooperation<br />
on routes and to provide common best practices<br />
for airlines and commercial airports to ensure<br />
12 F A L L 2 0 0 4 w w w . i m a g i n g n o t e s . c o m
safe and efficient operations. IATA also published a<br />
significant amount of tabular data on obstacles in the<br />
vicinity of airports, but without any independent satellite<br />
imagery to validate those obstacle locations.<br />
In early 2002, IATA recognized that its member<br />
airlines could also benefit from the use of remote<br />
sensing to expand route structures, to find more economical<br />
route structures, and to enhance the quality<br />
and fidelity of flight training by the use of high-resolution<br />
satellite imagery. Mutual colleagues at IATA<br />
and Space <strong>Imaging</strong> brainstormed the notion of a<br />
partnership to introduce remote sensing to benefit all<br />
member airlines. For a satellite company individually<br />
to market remote-sensing products and services to<br />
270 airlines would not be cost-effective. However, if<br />
the customer point of contact were a single organization<br />
such as IATA, then the cost of providing those<br />
remote-sensing products would be feasible.<br />
Thus in July of 2004, a partnership agreement was<br />
signed that would enable Space <strong>Imaging</strong> and IATA to<br />
produce a new line of remote-sensing-derived products<br />
to solve many of the problems described above. These<br />
new products, marketed and sold under the IATA brand<br />
name, will increase air transport safety and efficiency<br />
for the world’s airlines and airports. Space <strong>Imaging</strong> will<br />
manufacture the products by utilizing the company’s<br />
multi-source satellite imagery, imagery-derived products,<br />
IATA’s proprietary geospatial information and<br />
other public domain sources.<br />
The agreement allows for four categories of products<br />
to be sold under the IATA brand:<br />
Figure 1<br />
Figure 2<br />
Figure 3<br />
a. Satellite imagery of airports that includes visual<br />
representations of ground obstacles (see Figure 1).<br />
b. Aeronautical terrain and obstacle databases,<br />
manufactured from IATA’s obstacle information and<br />
terrain data derived from stereo imagery.<br />
c. Airport Mapping Databases (AMDB) that conform to<br />
the aviation industry’s international standard (DO-<br />
272/ED-99)(see Figure 2).<br />
d. Aviation visual simulation databases for desktop flight<br />
training devices (FTD) and full-motion simulators.<br />
w w w . i m a g i n g n o t e s . c o m<br />
F A L L 2 0 0 4<br />
13
High-resolution satellite imagery and its derived products<br />
would assist in these efforts in the following ways.<br />
Mission Planning: Planning for New Routes<br />
One of the most significant possible new markets for<br />
IATA to pursue is the provision of additional imagery,<br />
vector maps and operational information for all of the<br />
new remote airfields being used as alternates by airlines<br />
flying Extended Twin-engine Operations over water<br />
(ETOPS), or by airlines flying conventional three-engine<br />
and four-engine aircraft over the North Pole area.<br />
Russia, China and other countries are now opening<br />
their airspace in order to collect more over-flight charges,<br />
but the level of data available for flight operations<br />
is still less than optimal. The use of the new product<br />
line at those remote alternate airfields will greatly enhance<br />
the level of information available to existing Polar<br />
Routes, and new Polar Routes still being developed.<br />
In-track Stereo IKONOS is used to develop 3-D maps<br />
of the airports and to extract digital elevation models<br />
(DEMs) for the surrounding areas of the airfields. The<br />
3-D maps can be used to calculate the optimum climb<br />
and descent profiles in and out of those airfields.<br />
Figure 4<br />
Figure 5<br />
Mission Rehearsal: Training for New Routes<br />
Once new route information has been developed, the<br />
same imagery can be put into flight simulators to train<br />
the pilots in actually flying to and from those destinations.<br />
Figure 3 shows what such a 3-D visualization would<br />
look like — truly photo-real!<br />
Mission Execution: Flying the New Routes<br />
Six current trends in global air transportation are:<br />
a. Migration to GPS navigation, away from groundbased<br />
navigation aids.<br />
b. Required Navigation Performance (RNP) Flight<br />
Operations.<br />
c. Reduced Vertical Separation Minimum (RVSM) Flight<br />
Operations.<br />
d. Increased data-linked air traffic control instead of<br />
voice air traffic control.<br />
e. Runway incursion prevention technologies.<br />
f. More rigorous computation of Engine-Out Procedures.<br />
All of these will demand significant redesign of existing<br />
NAVAID-based terminal procedures and company<br />
routings, as well as major urban area terminal redesigns<br />
to accommodate local changes and noise abatement requirements<br />
(especially in European Community countries).<br />
Most countries of the world will be looking at better<br />
data to accomplish this, and so will many of IATA’s<br />
members who fly into those countries.<br />
14 F A L L 2 0 0 4 w w w . i m a g i n g n o t e s . c o m
Information within the realm of global Civil<br />
Aviation Authorities in second and third-world<br />
countries at present is described as “best available”<br />
due to lack of funding. At present there is not<br />
enough quality information concerning operational<br />
content relating to airports and their surroundings.<br />
Operators and service providers are using<br />
whatever they can find, information which may be<br />
completely out-of-date or unapproved by the necessary<br />
authorities. If performance, obstacle, or flight<br />
path data are non-existent in relation to needed<br />
analysis, operators are forced to develop their own<br />
contingency data in order to provide safe obstacle<br />
clearance during engine-out, missed approach or<br />
engine failure during a missed landing.<br />
Any discussion of new sources of geospatial information<br />
for aviation must include a complete life-cycle<br />
to monitor changes at all affected airports. Space<br />
<strong>Imaging</strong> has developed some powerful proprietary<br />
tools that allow them to re-acquire new imagery, reextract<br />
new vectors, and compare those to the old<br />
vectors previously constructed in earlier versions of a<br />
particular airport. This will provide a complete sub-<br />
Figure 4. Advances<br />
scription-type arrangement, to ensure that changes<br />
on automatic runway<br />
acquired over time would be passed from Space <strong>Imaging</strong><br />
to IATA, and then by IATA to their members creation<br />
markings vector<br />
via their existing communication channels.<br />
Figure 5. Newest work<br />
As shown in Figures 3, 4, and 5, the types of airport<br />
on automatic closed<br />
change that would be acquired automatically could include<br />
runway and taxiway closures and obstructions, annotation<br />
runway detection and<br />
changes in runway threshold and taxiway segments, as<br />
well as ramp and apron changes.<br />
Benefits for airport authorities include those<br />
within planning for changes to their facilities, emergency<br />
procedures and noise abatement; within operations,<br />
such as tracking of ground vehicles with<br />
airport moving maps systems; and within training,<br />
such as for new procedures with simulators.<br />
In the years to come, the commercial airlines of<br />
the world will have a reliable source of remote sensing<br />
information for all of their advanced mapping needs.<br />
As they move the frontiers of new destinations farther<br />
and farther out, high-resolution satellite imagery,<br />
airport mapping databases, and terrain and obstacle<br />
information will be available to enhance the safety of<br />
operations to those new MM locations. <strong>Imaging</strong> notes Ad 2/19/04 10:42 AM Page<br />
<br />
<br />
<br />
<br />
<br />
MAPS ON<br />
YOUR MIND?<br />
ANY MAP, ANY IMAGE,<br />
ANY FORMAT, ANY TIME!<br />
Check out the new way of acquiring<br />
GIS software, imagery and base data online.<br />
No more hassles searching, re-formatting and<br />
re-projecting your specific GIS data needs.<br />
Visit our online store for any and all of your<br />
mapping product or solution requirements…<br />
With MapMart it’s Fast, Simple,<br />
and Cost-Effective<br />
<br />
<br />
<br />
<br />
<br />
<br />
<br />
<br />
You are here<br />
A Division of IntraSearch<br />
We are here<br />
www.mapmart.com<br />
w w w . i m a g i n g n o t e s . c o m<br />
<br />
<br />
<br />
<br />
www.mapmart.com<br />
303.759.5050<br />
F A L L 2 0 0 4<br />
15
FRED ABRAHAMS<br />
Consultant<br />
MARC GARL ASCO<br />
Sr. Military<br />
Analyst<br />
DARRY L LI<br />
Finberg Fellow<br />
MATTHEW MCKINZIE<br />
Consultant<br />
Human Rights Watch<br />
New York, N.Y.<br />
www.hrw.org<br />
Satellite imagery is being<br />
used by Human Rights Watch to provide verification<br />
of the physical condition of sensitive geographic areas<br />
within the Gaza Strip.<br />
Since the beginning of the Intifada in September of<br />
2000, Human Rights Watch estimates that the Israel Defense<br />
Force (IDF) has destroyed more than 2,400 houses<br />
in the Gaza Strip. About two-thirds of the destroyed<br />
structures were located in and near the Rafah refugee<br />
camp at the southern end of the Gaza Strip along the border<br />
with Egypt.<br />
<strong>Imaging</strong> satellites are ideal tools for observing and<br />
recording this destruction, as they document, map and<br />
provide quantitative data on the actual physical condition<br />
of the area. Human Rights Watch obtained eight satellite<br />
photographs from the IKONOS satellite of the southern<br />
Gaza Strip spanning the time period of April 21, 2000<br />
through May 29, 2004. These remotely-sensed data supplemented<br />
field research and interviews conducted by a<br />
Human Rights Watch team in Gaza during July of 2004<br />
as described in a forthcoming report (www.hrw.org).<br />
Rafah lies at the center of the 12.5 kilometer-long<br />
border between the Gaza Strip and Egypt. It is a dusty<br />
city and refugee camp of sprawling concrete homes —<br />
one of the poorest and worst-affected areas in the Palestinian-Israeli<br />
conflict. The 1979 Camp David Peace<br />
Treaty bisected the town between Egyptian Sinai and<br />
the Israeli-occupied Gaza Strip, with the result that<br />
houses, fields and orchards, at that time, lay very near<br />
the border. This was still largely the case in April of<br />
2000, as can be seen in the satellite photograph displayed<br />
in Figure 1 – upper.<br />
This border area with Egypt is known to the Israelis<br />
as the “Philadelphia Corridor” after the IDF designation<br />
for the patrol road visible in Figure 1. In 2000 the<br />
Philadelphia Corridor was approximately 20 to 40 meters<br />
wide, and included a three-meter high concrete wall<br />
topped with barbed wire. By May 2, 2003, the corridor<br />
was 80 to 90 meters in width (Figure 1 – lower).<br />
Imagery provides objective view<br />
16 F A L L 2 0 0 4 w w w . i m a g i n g n o t e s . c o m
International border<br />
Figure 1<br />
Rafah Block O<br />
Cement wall<br />
April 21, 2000 (Space <strong>Imaging</strong>)<br />
May 2, 2003 (Space <strong>Imaging</strong> Eurasia)<br />
Rafah Block O<br />
Metal wall<br />
International border<br />
w w w . i m a g i n g n o t e s . c o m<br />
F A L L 2 0 0 4<br />
17
Beginning in late 2002, after destroying hundreds<br />
of homes along the border, the IDF built an eight-meter<br />
high metal barrier in front of a long section of the border<br />
with Egypt to facilitate the movement of Israeli troops<br />
without exposure to hostile fire. This metal wall also<br />
extends two meters under ground. The satellite photographs<br />
of Figure 1 show Rafah’s “Block O,” one of the<br />
most damaged areas of the camp.<br />
The satellite imagery obtained by Human Rights<br />
Watch of the destruction of Palestinian homes and agriculture<br />
displays a clear pattern: the creation of a substantial<br />
buffer zone by the Israelis between the border with<br />
Egypt and Rafah. Between 10 and 20 percent of the refugee<br />
camp has been destroyed in the creation of this zone.<br />
Figure 2<br />
The main stated reason for the destruction of homes<br />
in Rafah has been described by the Israeli military as<br />
operations to find and destroy tunnels between Rafah<br />
and Egypt. Tunnels are both a longstanding acknowledged<br />
fact in Rafah and a phenomenon immersed in<br />
rumor. In the 1980s Palestinian smugglers began to<br />
dig tunnels in the soft sand to facilitate the transfer of<br />
goods, mostly cigarettes, alcohol, and drugs. The tunnels<br />
were an economic venture at the time, and their<br />
value increased as Israel tightened its controls around<br />
the Gaza Strip. As resistance to the occupation increased,<br />
the tunnels were used for arms and ammunition.<br />
Today, the tunnels are operated by a small group<br />
of smugglers who plan, dig and maintain the passages,<br />
transporting goods for whoever pays.<br />
While in Gaza, Human Rights Watch compiled<br />
case studies on Israeli tunnel interdiction. Residents<br />
of Rafah protested the excessive and indiscriminate<br />
nature of the Israeli military’s destruction, but many<br />
also had contempt for the profiteers who dig tunnels<br />
in their neighborhoods, thereby providing the IDF<br />
with a pretext to demolish homes.<br />
OPERATION RAINBOW<br />
On May 12, 2004, an IDF armored personnel carrier<br />
heavily laden with explosives was destroyed in the<br />
Rafah buffer zone near Block O, apparently by a rocket-propelled<br />
grenade. The powerful explosion killed<br />
five soldiers and showered the area with fragments. The<br />
military wing of Islamic Jihad claimed responsibility.<br />
Israeli tanks, Caterpillar D9 armored bulldozers<br />
and helicopters moved against Rafah’s Block O on the<br />
evening of May 12, firing shells and missiles as residents<br />
fled. At the end of the operation on May 15, 88 houses<br />
in Block O and the neighboring “Qishta” area had been<br />
destroyed. On May 17, the IDF launched “Operation<br />
Rainbow,” the first division-level offensive in the Gaza<br />
Strip during the Intifada.<br />
Operation Rainbow primarily targeted two areas:<br />
Tel al-Sultan, on the northwest outskirts of Rafah;<br />
and the Brazil and Salam neighborhoods, in eastern<br />
Rafah, closer to the border (see Figure 2). The IDF did<br />
not enter the densely populated center of Rafah. Tel<br />
al-Sultan is a newer neighborhood several kilometers<br />
northwest of Rafah’s center. Israeli forces seized control<br />
of Tel al-Sultan on May 18 and imposed a 24-<br />
hour curfew. D9 bulldozers extensively tore up roads<br />
in Tel al-Sultan, causing severe damage to sewage and<br />
water networks. On May 19, a group of several hundred<br />
Palestinians marched towards Tel al-Sultan from<br />
the center of Rafah, demonstrating against the incursion<br />
there. Israeli tanks and helicopters opened fire on<br />
the crowd, killing nine people, including five people<br />
aged 18 or younger.<br />
Israeli troops pulled back from Tel al-Sultan on<br />
May 21. Over the next few days, the most extensive<br />
property destruction was at two large agricultural<br />
areas full of greenhouses, both more than one kilometer<br />
from the border and not near any settlements.<br />
’Ala al-Din Faiz Buraika watched the destruction<br />
from his home adjacent to the western-most agricultural<br />
area when it began on May 20. “No one could get out<br />
or in, tanks were surrounding the area,” he told Human<br />
Rights Watch. “They surrounded Tel al-Sultan and cut<br />
it from the town. They used bulldozers and tanks, with<br />
Apaches [helicopters] protecting them from above. They<br />
spent three days destroying the greenhouses, which grew<br />
onions, melons and flowers.” Human Rights Watch inspected<br />
both agricultural areas in Tel al-Sultan. Both<br />
were devoid of any greenhouses; only ruptured earth<br />
littered with metal and glass remains. Figure 3 contrasts<br />
before and after satellite images of the agricultural area<br />
west of Tel al-Sultan, illustrating this damage.<br />
The IDF accelerated Operation Rainbow by launching<br />
an offensive deep into the Brazil and Salam areas of<br />
Rafah, also for the first time in the Intifada. Two patterns<br />
18 F A L L 2 0 0 4 w w w . i m a g i n g n o t e s . c o m
Greenhouses<br />
Figure 3<br />
Dec. 16, 2003 (Space <strong>Imaging</strong> Middle East)<br />
May 29, 2004 (Space <strong>Imaging</strong> Eurasia)<br />
w w w . i m a g i n g n o t e s . c o m<br />
F A L L 2 0 0 4<br />
19
Figure 4<br />
Rafah Zoo<br />
Metal wall<br />
Brazil Quarter<br />
Brazil Quarter<br />
International border<br />
Dec. 16, 2003 (Space <strong>Imaging</strong> Middle East)<br />
May 29, 2004 (Space <strong>Imaging</strong> Eurasia)<br />
of house demolition are evident in Brazil from the satellite<br />
imagery. In the interior of the camp, the IDF bulldozed<br />
paths through blocks of one-story houses. Closer to the<br />
border, destruction seems to have been more indiscriminate,<br />
leveling wider swathes of housing. Figure 4 contrasts<br />
a before and after image of the Brazil quarter. The Rafah<br />
Zoo marked the deepest point of penetration into Rafah,<br />
where Israeli forces set up a perimeter to isolate Brazil.<br />
The demolition continued throughout much of May 20<br />
and resumed periodically until the redeployment of the<br />
IDF out of Rafah Brazil on May 24. According to United<br />
Nations Relief and Works Agency (UNRWA), the IDF<br />
demolished 154 houses in Brazil and Salam.<br />
PATTERNS IN THE RUBBLE<br />
Satellite imagery of the southern Gaza strip during<br />
the Intifada provides a quantitative assessment of damage<br />
over time to building structures and to agriculture.<br />
This data was used in conjunction with field research by<br />
Human Rights Watch to better understand the cumulative<br />
impact of IDF operations in Rafah and neighboring<br />
areas and to document the damage that occurred over<br />
several days in May, 2004. In contrast to the house demolitions<br />
since 2000 that have gradually expanded the<br />
Rafah buffer zone, Operation Rainbow involved widespread<br />
destruction deep inside Rafah, far from the border.<br />
In both patterns of damage to Rafah, satellite imagery<br />
has provided a uniquely objective and comprehensive<br />
window into the humanitarian crisis in Gaza.<br />
A full report is scheduled to be released this fall<br />
by the Human Rights Watch.<br />
20 F A L L 2 0 0 4 w w w . i m a g i n g n o t e s . c o m
satellite-based<br />
civil crisis<br />
information<br />
DR. STEFAN VOIGT<br />
Team lead for<br />
Natural Hazards<br />
and Crisis Information,<br />
DLR<br />
TORSTEN RIEDLINGER<br />
Scientific Staff<br />
DLR<br />
DR. HARALD MEHL<br />
Unithead for<br />
Environment and<br />
Geoinformation,<br />
DLR<br />
figure 9<br />
w w w . i m a g i n g n o t e s . c o m<br />
Providing<br />
civil crisis<br />
information,<br />
emergency<br />
mapping<br />
and disaster<br />
monitoring<br />
for humanitarian<br />
relief<br />
Due to the increasing occurrence of natural<br />
disasters, humanitarian emergency situations and civil<br />
endangerment, there is a rising need for near-real-time<br />
information. The experiences of the past few years also<br />
show the demand for timely, extensive and wide-area<br />
earth observation data for various crisis situations.<br />
The German Remote Sensing Data Center (DFD) as<br />
part of the German Aerospace Center (DLR) has been<br />
active in the field of crisis analysis for several years and<br />
has recently set up the Center for Satellite Based Crisis<br />
Information (ZKI). It serves as interface and front-end<br />
for the comprehensive satellite data acquisition, processing<br />
and analysis capacities available within DFD and<br />
ZKI, Center for<br />
Satellite Based<br />
Crisis Information,<br />
an initiative of the<br />
German Remote<br />
Sensing Data<br />
Center (DFD), Oberpfaffenhofen<br />
near<br />
Munich German<br />
Aerospace Center<br />
(DLR), Köln<br />
www.dlr.de<br />
www.zki.caf.dlr.de<br />
www.disasters<br />
charter.org<br />
F A L L 2 0 0 4<br />
21
figure 1 figure 2<br />
Figure 1. Forest fires<br />
in the Algarve Region<br />
of central Portugal,<br />
Aug. 17, 2003<br />
Figure 2. Collected<br />
on July 28, 2004, this<br />
image shows burned<br />
areas in Monchique,<br />
southern Portugal<br />
other DLR institutions in order to serve the operational<br />
civil protection and humanitarian relief communities.<br />
Besides response and assessment activities, ZKI focuses<br />
on geoinformation about medium term rehabilitation,<br />
reconstruction and prevention activities.<br />
DFD operates in national, European and international<br />
contexts, closely networking with public authorities<br />
(civil protection and civil security) and non-governmental<br />
organizations (NGO’s such as humanitarian relief<br />
organizations and the United Nations), as well as satellite<br />
operators and space agencies. DLR through DFD<br />
supports and participates in the International Charter<br />
on Space and Major Disasters, which is a major cooperative<br />
activity in the context of natural and man-made<br />
disasters providing complimentary satellite imagery for<br />
civil protection worldwide. In case of a natural disaster<br />
in Germany, and also where required globally, DFD coordinates<br />
the acquisition and analysis of satellite imagery<br />
as project manager in the scope of the International<br />
Charter on Space and Major Disasters.<br />
As the promotion of the application of spacebased<br />
information within the international relief<br />
community is a long-term effort, DFD has formulated<br />
long-term goals for ZKI as follows:<br />
a. Bundling existing technical and scientific resources<br />
and capacities at DLR to increase their effectiveness<br />
and coordination for crisis management<br />
b. Developing and establishing methods to generate<br />
specific information products and services in the<br />
range of disaster management, humanitarian relief<br />
and civil security<br />
c. Developing and establishing a distributed European<br />
network for civil satellite-based crisis information<br />
d. Enhancing relevant information technology and<br />
infrastructure<br />
In order to meet these goals DFD makes use of the<br />
full fleet of scientific and commercial satellites available<br />
partially through its own receiving stations. These<br />
include optical satellites like Spot, IRS, Landsat, IKO-<br />
NOS, and QuickBird, and radar satellite imagery like<br />
ENVISAT, ERS and RADARSAT. A very efficient and<br />
successful cooperation has been established between<br />
DFD and European Space <strong>Imaging</strong> to provide extremely<br />
fast acquisition and analysis of IKONOS imagery over<br />
Europe and worldwide. The IKONOS system is unique<br />
in that it allows regional operations centers around the<br />
world to locally task the satellite and directly <strong>download</strong><br />
the information. This makes the system highly efficient<br />
for near real-time crisis and disaster relief purposes.<br />
In various crisis situations and emergencies, DFD<br />
and these partners provide image maps with pinpoint<br />
accuracy to disaster relief organizations. Examples<br />
include maps made during last winter’s flooding in<br />
southern France; after earthquakes in Iran in December<br />
2003 and in North Morocco last February;<br />
and during forest fires in Portugal in the summers of<br />
2003 and 2004.<br />
22 F A L L 2 0 0 4 w w w . i m a g i n g n o t e s . c o m
FOREST FIRE DAMAGE ASSESS-<br />
MENT IN PINHEIRO GRANDE, CEN-<br />
w w w . i m a g i n g n o t e s . c o m<br />
figure 3 figure 4<br />
The<br />
experiences<br />
of the past<br />
few years<br />
also show<br />
the demand<br />
for recent,<br />
extensive<br />
and widearea<br />
earth<br />
observation<br />
data for<br />
various<br />
crisis<br />
situations.<br />
TRAL PORTUGAL<br />
At the beginning of August 2003,<br />
the Portuguese Servicio Nacional<br />
de Bombeiros e Protecçào Civil<br />
requested activation of the International<br />
Charter on Space and<br />
Major Disasters. The Center for<br />
Satellite Based Crisis Information<br />
of DFD took over the project<br />
management for this call from<br />
Portugal at the request of ESA<br />
and coordinated data distribution<br />
and analysis. During the 18 days<br />
of charter activation, 52 image<br />
products were delivered through<br />
DFD to the fire control forces. In<br />
cooperation with European Space<br />
<strong>Imaging</strong>, DFD conducted a fastmapping<br />
activity to assess the extent<br />
and damage of forest fires in<br />
the Algarve Region. See Figure 1.<br />
The satellite images were used<br />
for different purposes during the<br />
fire fighting and recovery phase.<br />
While the high resolution satellite<br />
images helped to assess the damage<br />
and the mapping of burnt areas in<br />
different provinces and communities,<br />
daily medium resolution thermal<br />
NOAA/AVHRR images helped<br />
to redirect fire fighting efforts to the<br />
places where they were needed most<br />
urgently. DFD acquired and processed<br />
those images daily during<br />
early morning hours and provided<br />
the results to the Portugese agency<br />
only a few hours after acquisition.<br />
This allowed the fire fighting teams<br />
to make their decision on where to<br />
concentrate the fire fighting efforts<br />
based on timely and up to date information.<br />
FOREST FIRE DAMAGE<br />
ASSESSMENT IN MONCHIQUE,<br />
SOUTHERN PORTUGAL<br />
Again in July 2004, forest fires in<br />
Spain and Portugal were recorded<br />
and analyzed at DFD, which produced<br />
a detailed satellite map of<br />
the affected area in the Monchique<br />
region. In addition, MODIS imagery<br />
was analyzed to obtain an overview<br />
of the current distribution of<br />
fires across the entire Iberian Peninsula.<br />
The maps show orchards,<br />
forests and agricultural-use areas.<br />
The local road and path network,<br />
as well as settlements and houses<br />
are clearly visible. Burned areas<br />
Figure 3. Explosion<br />
in southern Ukraine<br />
destroyed arms dump,<br />
shown here on May 8,<br />
2004. Fires were still<br />
burning at the time of<br />
acquisition<br />
Figure 4. The explosion<br />
site detail taken<br />
by IKONOS, 46 hours<br />
after the disaster,<br />
May 8, 2004<br />
F A L L 2 0 0 4<br />
23
figure 5 figure 6<br />
Figure 5. The Rhone<br />
river flood in southern<br />
France<br />
Figure 6. Bangladesh<br />
map in the Dhaka<br />
region were used for<br />
the management of<br />
drinking water after<br />
flooding<br />
can be distinguished in the satellite image. See Figure<br />
2. Using geometrically high-resolution images, the demarcation<br />
of the fire front can be identified in detail.<br />
On this account, these datasets can be used for the<br />
localization of damaged infrastructure.<br />
EXPLOSION DISASTER NEAR<br />
NOVOBOGDANOVKA, UKRAINE<br />
On May 6, 2004, a military arms dump southeast<br />
of the village of Novobogdanovka in southern<br />
Ukraine exploded. According to press statements,<br />
10,000 people in the surrounding villages had to be<br />
evacuated and a major highway and railway line connecting<br />
the cities of Melitopol and Zaporizhya had<br />
to be blocked. The satellite image in Figure 3 shows<br />
that the arms dump was completely destroyed. Large<br />
amounts of debris were hurled hundreds of meters<br />
and even kilometers into the neighboring villages<br />
and agricultural land. The satellite imagery shows<br />
that some fires were still burning in the explosion<br />
area during the time of acquisition. The second map<br />
in Figure 4 shows the explosion site in detail, approximately<br />
46 hours after the onset of the disaster.<br />
RHONE RIVER FLOOD,<br />
SOUTHERN FRANCE<br />
The French Civil Protection authorities called the<br />
International Charter on Space and Major Disasters<br />
in December 2003 for the severe flooding situation<br />
on the Rhone river. Various flood analysis products<br />
were generated in the Charter context, and DFD supported<br />
the relief activities by generating a high-resolution<br />
flood map for the northern parts of Arles on<br />
Dec. 6. See Figure 5. This activity showed how bundling<br />
existing technical and scientific resources and<br />
capacities helps to increase effectiveness and coordination<br />
in crisis management.<br />
BANGL ADESH FLOOD, BASE MAPPING<br />
OF DHAKA REGION<br />
At the emergency request of the Technische Hilfswerk<br />
(THW, The German Disaster Relief Organization)<br />
DFD compiled IKONOS satellite imagery from Space<br />
<strong>Imaging</strong>’s extensive archive to create an image base<br />
map of the area around the capital Dhaka. The maps<br />
were used for planning purposes during a joint humanitarian<br />
assessment campaign in August 2004 by<br />
THW and the United Nations Office for the Coordination<br />
of Humanitarian Affairs (UNOCHA) with a focus<br />
on drinking water management and supply after heavy<br />
flooding damage during July 2004. See Figure 6.<br />
ELBE RIVER FLOODING, GERMANY<br />
Figure 7 shows an Envisat radar image of the Elbe<br />
Valley in Sachsen, Germany was taken on August<br />
19, 2002. It depicts the flooded areas at that time<br />
in black or blue. The flooded areas are particularly<br />
large around the city of Riesa.<br />
24 F A L L 2 0 0 4 w w w . i m a g i n g n o t e s . c o m
figure 7<br />
figure 8<br />
This image demonstrates the increased capabilities<br />
of the Advanced Synthetic Aperture Radar (ASAR)<br />
onboard the Envisat spacecraft as compared with the<br />
SAR sensors on the earlier ERS generation of satellites.<br />
Envisat’s ASAR instrument is the first permanent<br />
space-borne radar to incorporate dual-polarization capabilities<br />
— the instrument can transmit and receive<br />
signals in either horizontal or vertical polarization.<br />
This Alternating Polarization (AP) mode can improve<br />
the capability of a SAR instrument to classify different<br />
types of terrain. Because the reflective properties of a<br />
surface are dependent on the polarization of the incoming<br />
radar signal, the use of more than one type of polarization<br />
provides valuable extra information.<br />
A sequence of seven MODIS images were used for<br />
analyzing and mapping of the dynamics of the Elbe<br />
flooding event from July 28 to Aug. 22, 2002. See<br />
Figure 8. It allowed analysts to better understand the<br />
spatial and temporal behavior of the flood. Due to<br />
the fact that MODIS imagery can be processed and<br />
acquired in-house at DFD, these images often serve<br />
as reference for further planning and optimization of<br />
high resolution satellite data acquisitions.<br />
w w w . i m a g i n g n o t e s . c o m<br />
EARTHQUAKE DAMAGE IN IRAN AND MOROCCO<br />
Supporting the international relief activities undertaken<br />
by various humanitarian organizations in the area<br />
around the city of Bam, Iran, in December 2003 and in<br />
the area of Al Hoceima, Morocco, in February 2004,<br />
DFD generated damage assessment maps from satellite<br />
imagery and provided them to the international relief<br />
community. See Figure 9 (page 21).<br />
The maps were very helpful for the relief teams as<br />
they provided a first overview of the affected areas. Mapping<br />
of damages in earthquake areas can be very difficult<br />
if houses are partially damaged or the affected houses<br />
are spread out over large rural areas. In many cases international<br />
rescue teams start out from their home bases<br />
without any topographic or road map of the affected areas.<br />
Even archived imagery often helps to provide a planning<br />
and decision base. If satellite maps can be provided<br />
to in-field coordination teams they can be of great help<br />
for avoiding duplication and misunderstanding. Areas<br />
already searched can be clearly marked on the maps,<br />
thus saving precious time.<br />
The formation of the International Charter on Space<br />
and Major Disasters is an important example of space<br />
agencies and participating nations working together for<br />
the greater good. Satellite imagery has proven to be extremely<br />
beneficial for regions affected by disaster and<br />
suffering from crisis in many cases, especially whenever<br />
it was possible to provide up-to-date and high quality<br />
information to decision makers and relief workers in a<br />
timely manner.<br />
Figure 7. Envisat<br />
image of Elbe Valley,<br />
Germany flooding on<br />
Aug. 19, 2002. Spatial<br />
resolution = 25 m;<br />
Incidence angle =<br />
around 23 degrees;<br />
(IS2) Red channel =<br />
HH polarization;<br />
Green channel =<br />
HV polarization;<br />
Blue channel =<br />
difference between HH<br />
and HV polarization.<br />
Figure 8. MODIS images<br />
were used in<br />
sequence for analyzing<br />
and mapping of the<br />
dynamics of the Elbe<br />
flood. Left: August 16,<br />
2002; right: August<br />
20, 2002<br />
Figure 9. Map of<br />
earthquake in Morocco,<br />
February 2004. See<br />
page 21.<br />
F A L L 2 0 0 4 25
Remote<br />
sensing for<br />
hydroelectric<br />
re-licensing<br />
PG&E’S USE OF IMAGERY<br />
DONALD G. PRICE<br />
Senior Scientist<br />
Technical & Ecological<br />
Services Department<br />
Pacific Gas and<br />
Electric Company<br />
San Ramon,<br />
California<br />
www.pge.com<br />
Figure 2<br />
Pacific Gas and Electric Company (PG&E),<br />
a California Public Utility, operates extensive hydroelectric<br />
facilities on the Pit River of northern California,<br />
controlling a network of dams, tunnels, powerhouses<br />
and electrical transmission lines.<br />
The Pit 3, 4, 5 Hydroelectric Project is a 325-megawatt<br />
hydroelectric facility located on the Pit River, in<br />
Shasta County, California (Figure 1). The project occupies<br />
746 acres of lands of the United States administered<br />
by the Forest Supervisors of the Shasta-Trinity and Lassen<br />
National Forests. The Pit 3, 4, 5 Project consists<br />
of three hydraulically connected developments, with a<br />
total of four dams, four reservoirs, three powerhouses,<br />
associated tunnels, surge chambers, and penstocks.<br />
The project has a combined average annual generation<br />
of 1,913.7 gigawatt-hours. The Pit 3, 4, 5 Project is<br />
operated by PG&E under Federal Energy Regulatory<br />
Commission (FERC) License No. 233.<br />
The Pit River is a noted trout-fishing stream and is<br />
home to diverse communities of wildlife and vegetation.<br />
In 2002 a remote sensing program was conducted as<br />
26 F A L L 2 0 0 4 w w w . i m a g i n g n o t e s . c o m
w w w . i m a g i n g n o t e s . c o m<br />
Figure 1<br />
one element of a major study of the potential effects of<br />
future hydroelectric power operations on the river ecosystem.<br />
This project and other studies were conducted<br />
as part of the FERC re-licensing process for the Pit 3,<br />
4, 5 Project. Hydro re-licensing is a federally mandated<br />
process typically conducted once every 30 to 50 years<br />
for hydroelectric projects.<br />
The process of hydroelectric generation impounds<br />
water behind dams and diverts it through tunnels and<br />
canals to lower-elevation power stations (Figure 2). Water<br />
that would normally flow down the natural river<br />
channel may be reduced compared to pre-project conditions.<br />
This loss of flow in the natural river channel<br />
is mitigated by releasing very precise water flows from<br />
each of the dams situated along the river (Figure 3).<br />
These flow releases are referred to as “instream flows”<br />
and their magnitude and timing are major issues.<br />
A controlled flow study was conducted in the spring<br />
and summer of 2002 to evaluate the effects of various<br />
potential mitigation flow releases on aquatic resources,<br />
including assessments of fish habitat, fish strand-<br />
Figure 1. Location<br />
of the Pit 3, 4 and 5<br />
hydroelectric project.<br />
Figure 2. The Pit 3<br />
dam is only one of four<br />
dams located within<br />
the project area (photo<br />
by author).<br />
F A L L 2 0 0 4 27
Figure 3. Instream<br />
flows are augmented<br />
by precise water<br />
releases from project<br />
dams like this 1,200<br />
cfs test release from<br />
the Pit 3 dam (photo by<br />
author).<br />
Figure 4. Three-meter<br />
resolution image<br />
mosaic of RGB bands<br />
produced by the HyMap<br />
hyperspectral flight<br />
over the entire 37 km<br />
length of the project<br />
area (image by HyVista<br />
Corporation).<br />
Figure 5. Ground truth<br />
involved above-water<br />
and underwater evaluations<br />
with portable<br />
spectrometers and<br />
ground control point<br />
locations (photo by<br />
author).<br />
Figure 6. Aquatic and<br />
terrestrial habitats<br />
were classified and<br />
mapped to determine<br />
baseline conditions<br />
and to estimate the<br />
effects of altered flow<br />
releases (image by<br />
Itres Inc.).<br />
ing, amphibian habitat, mollusk habitat, filamentous<br />
algae movement, and sediment transport. Recreation<br />
concerns were also assessed with whitewater boating<br />
and fishability evaluations. Due to the diverse range<br />
of environmental studies requiring overhead imagery,<br />
several remote sensing methods were chosen to examine<br />
the full 37 km project length of the river encompassing<br />
all three power stations located within the Pit<br />
3, Pit 4 and Pit 5 reaches.<br />
In 2002 several remote sensing datasets were collected,<br />
including satellite panchromatic, terrestrial lidar,<br />
bathymetric lidar, airborne hyperspectral (Figure<br />
4), and seven acquisitions of high-resolution color airborne<br />
stereophotography. A ground truth dataset was<br />
collected to support each acquisition of remotely sensed<br />
data (Figure 5). All data were tied to the same horizontal<br />
and vertical datum for precise co-location between datasets<br />
in all three dimensions. The remote sensing datasets<br />
enabled mapping and modeling of the river and river<br />
basin morphology, classification of vegetation, and<br />
detection of several water quality parameters. Aquatic<br />
and terrestrial habitats were classified and mapped to<br />
determine baseline conditions and to estimate the effects<br />
of altered flow releases (Figure 6). These data were<br />
integrated into two-dimensional instream flow models<br />
of the river system, which simulate the spatial impact of<br />
different flow release rates and relate them to changes<br />
in aquatic habitat.<br />
The results of these models are helping a collaborative<br />
team consisting of PG&E, public interest groups,<br />
and several regulatory agencies to determine specific<br />
mitigation flow release rates that approach an optimal<br />
compromise between habitat health and cost-effective<br />
power generation.<br />
Figure 3<br />
Figure 4<br />
REMOTE SENSING DATASETS COLLECTED IN 2002,<br />
FOLLOWED BY MAP PRODUCT:<br />
Terrestrial Lidar , ± 15 cm vertical, 3-meter posting<br />
a. Bare earth DEM<br />
b. Canopy DEM<br />
c. Test measurements of water surface elevations<br />
Figure 5<br />
Figure 6<br />
Color Stereophotography, 10 cm resolution, 1:7200 scale<br />
a. Precise river boundary vectors from stereo analysis<br />
b. Base map for traditional ground surveys<br />
Satellite Panchromatic Imagery<br />
a. Watershed overview and terrain assessment<br />
b. Planning for sampling locations and access<br />
28 F A L L 2 0 0 4 w w w . i m a g i n g n o t e s . c o m
Hyperspectral Imagery, 1.5-meter and 3.0-meter,<br />
126 spectral bands, 450 nm (nanometer) to 2480 nm<br />
a. Water quality maps (chlorophyll content,<br />
total suspended solids)<br />
b. Exposed and submerged substrate classification<br />
c. River depth<br />
d. Riparian vegetation classifications<br />
Bathymetric Lidar, 4-meter posting<br />
a. River bathymetry<br />
b. Water surface elevation<br />
Ground Surveys<br />
a. GPS and total station positions<br />
b. Spectral measurements<br />
c. Water quality samples<br />
d. Depth measurements<br />
e. Site descriptions<br />
The lidar data were used to create a digital elevation<br />
model of the river canyon at a 3-meter spatial resolution.<br />
The lidar dataset contains classified returns<br />
of the bare earth, the vegetation canopy, the water and<br />
infrastructure. In addition, a successful test was conducted<br />
in the use of terrestrial lidar to map river water<br />
surface elevations (Figure 9).<br />
Bathymetric lidar was used on an experimental basis<br />
to assess performance in a narrow, boulder-strewn<br />
river canyon. Not all of the project area was mapped,<br />
but the valid returns agree with the elevation measurements<br />
from traditional lidar and ground surveys.<br />
Hyperspectral imagery was used to map riparian<br />
vegetation, river depth and benthic substrate type<br />
(Figure 10). Spectral analyses and numeric models<br />
estimated the spatial concentrations of chlorophyll,<br />
total suspended solids and colored dissolved organic<br />
material in the Pit River.<br />
List of Project Participants:<br />
Technical & Ecological Services Department (TES)<br />
of Pacific Gas and Electric Company (PG&E,<br />
San Francisco, Calif.)<br />
CSIRO Land and Water (Sydney, Australia)<br />
DigitalGlobe Inc. (Longmont, Colo.)<br />
EarthData International Inc. (Washington, D.C.)<br />
HJW GeoSpatial Inc. (Oakland, Calif.)<br />
HyVista Corporation (Sydney, Australia)<br />
ITRES Limited (Calgary, Canada)<br />
Joint Airborne Lidar Bathymetry Technical Center of<br />
Expertise (USACE JALBTCX, Mobile, Ala.)<br />
Lawrence Livermore National Laboratory<br />
(LLNL, Livermore, Calif.)<br />
University of California Santa Cruz (UCSC) Earth and<br />
Marine Sciences Department (Santa Cruz, Calif.)<br />
Remote sensing techniques<br />
are perceived as costly due to the<br />
high cost of aircraft, scanners,<br />
and data analysis, but actually<br />
compare favorably to more<br />
conventional techniques which<br />
are typically labor intensive.<br />
MAP PRODUCTS<br />
Satellite Panchromatic Imagery was collected in<br />
the initial planning stages of the study to provide<br />
an overview of the river basin (Figure 7). QuickBird<br />
panchromatic imagery was used to identify specific<br />
stream segments that would overlap project facilities<br />
and to select ground control points for subsequent<br />
airborne activities.<br />
High Resolution (10 cm) Color Stereophotography<br />
was collected seven times, once each at test flow releases<br />
from 150 cfs (cubic feet per second), 250 cfs,<br />
400 cfs, 600 cfs, 800 cfs, 1200 cfs and 1800 cfs (Figure<br />
8). The precise river boundaries at each river flow rate<br />
were digitized in stereo analysis to create 3-D river<br />
boundary vectors accurate to the centimeter level. The<br />
stereophotography was also used as a basemap for a<br />
vegetation survey on the ground.<br />
w w w . i m a g i n g n o t e s . c o m<br />
Ground data collection to support this project<br />
included GPS and total station surveys, underwater<br />
and above-water spectral measurements, water depth<br />
measurements and water quality samples.<br />
The application of remote sensing techniques for<br />
the environmental evaluation of hydroelectric projects<br />
is still developing. The value derived by using remote<br />
sensing will vary depending on the specific area<br />
of interest. Certainly, where access is difficult or impossible,<br />
the value of using remote sensing becomes<br />
extremely high. Aerial photography has been used<br />
for many decades for remote area mapping and remains<br />
an important remote sensing tool. New tools,<br />
such as high-resolution satellite imagery, airborne<br />
hyperspectral imagery, and lidar for topographic and<br />
benthic mapping are now available and enable many<br />
new ecosystem assessment approaches.<br />
F A L L 2 0 0 4<br />
29
Figure 7. High<br />
resolution (0.6 meter)<br />
panchromatic imagery<br />
was used for initial<br />
study planning, for terrain<br />
assessment, and<br />
for locating key project<br />
features such as the Pit<br />
4 powerhouse shown<br />
here (satellite image by<br />
DigitalGlobe Inc.).<br />
Figure 8. High resolution<br />
(10 cm) color<br />
stereophotography<br />
was used for aquatic<br />
habitat mapping and<br />
for a variety of ground<br />
truth applications (air<br />
photo by HJW Inc.).<br />
Remote sensing techniques are perceived as costly<br />
due to the high cost of aircraft, scanners, and data<br />
analysis, but actually compare favorably to more conventional<br />
techniques, which are typically labor intensive.<br />
As remote sensing techniques improve, with better<br />
spatial and wavelength resolution, expensive on-theground<br />
fieldwork requirements will be reduced. Ultimately,<br />
however, it will be the unique point of view provided<br />
by remote sensing that will be the most valuable.<br />
Remote sensing not only allows a broad overview of<br />
landscapes of interest, it can also provide comprehensive<br />
analysis of critical areas that might be missed by<br />
conventional approaches.<br />
It will be the<br />
unique point of view<br />
provided by remote<br />
sensing that will be the<br />
most valuable.<br />
Figure 7<br />
Figure 8<br />
Figure 9. Realistic 3-D<br />
views of the project<br />
area provide environmental<br />
scientists with<br />
a unique perspective<br />
of aquatic habitats.<br />
Lidar topographic<br />
maps were fused with<br />
vectors derived from<br />
hyperspectral data<br />
and high resolution<br />
aerial photos (image<br />
by Itres Inc.).<br />
Figure 10. Hyperspectral<br />
imagery was<br />
classified into vectors<br />
that describe riparian<br />
vegetation, river depth,<br />
and benthic substrate<br />
types (image by Itres<br />
Inc.).<br />
Geospatial analyses of the variety of image data<br />
can produce a wealth of detailed specialized maps.<br />
Various layers can be superimposed and overlaid to<br />
show the distribution of plant species, the extent of<br />
aquatic habitats, and the juxtaposition of energy infrastructure<br />
in a compelling format.<br />
Regulatory agencies, non-governmental organizations,<br />
and the general public have all responded<br />
favorably to the remote sensing products developed<br />
by this study, which has enhanced the environmental<br />
planning and decision making processes.<br />
LEGAL NOTICE<br />
Pacific Gas and Electric Company (PG&E) makes no warranty<br />
or representation, expressed or implied, with respect to the<br />
accuracy, completeness, or usefulness of the information<br />
contained in this document, or that the use of any information,<br />
apparatus, method, or process disclosed in this document<br />
may not infringe upon privately owned rights. Nor does PG&E<br />
assume any liability with respect to use of, or damages resulting<br />
from the use of, any information, apparatus, method, or<br />
process disclosed in this document.<br />
Figure 9<br />
Figure 10<br />
30 F A L L 2 0 0 4 w w w . i m a g i n g n o t e s . c o m
events calendar<br />
october 2004<br />
6 - 8<br />
GIS in the Rockies<br />
Denver, Colo.<br />
www.gisintherockies.org/index.htm<br />
12 - 14<br />
GEOINT 2004 Symposium<br />
New Orleans, La.<br />
www.usgif.org/symposium/<br />
index.html<br />
18 - 22<br />
RADAR 2004<br />
Toulouse, France<br />
www.radar2004.org/<br />
november<br />
7 - 10<br />
URISA 42nd Annual Conference<br />
Reno, Nev.<br />
www.urisa.org/annual.htm<br />
december<br />
6 - 9<br />
I/ITSEC Conference<br />
Orlando, Fla.<br />
www.iitsec.org/confinfo.cfm<br />
Vancouver<br />
february 2005<br />
1-3<br />
ESRI Federal User Group<br />
Washington D.C.<br />
www.esri.com<br />
13-16<br />
GeoTec Event<br />
Vancouver, B.C., Canada<br />
www.geoplace.com<br />
15-18<br />
URISA 9th Annual Integrating GIS and<br />
CAMA Conference<br />
Savannah, Ga.<br />
www.urisa.org/cama<br />
22-23<br />
AFCEA Homeland Security Conference<br />
Washington D.C.<br />
www.afcea.org<br />
march<br />
6-9<br />
GITA’s Annual Conference 28<br />
Denver, Colo.<br />
www.gita.org/events/annual/28<br />
7-11<br />
ASPRS 2005 Annual Conference<br />
Baltimore, Md.<br />
www.asprs.org/baltimore2005<br />
Washington D.C.<br />
w w w . i m a g i n g n o t e s . c o m<br />
F A L L 2 0 0 4<br />
31
12076 Grant Street<br />
Thornton, CO 80241 USA<br />
2 S P R I N G 2 0 0 4 © 2 0 0 4 S P A C E I M A G I N G w w w . i m a g i n g n o t e s . c o m