child care - Digital Library Collections
child care - Digital Library Collections child care - Digital Library Collections
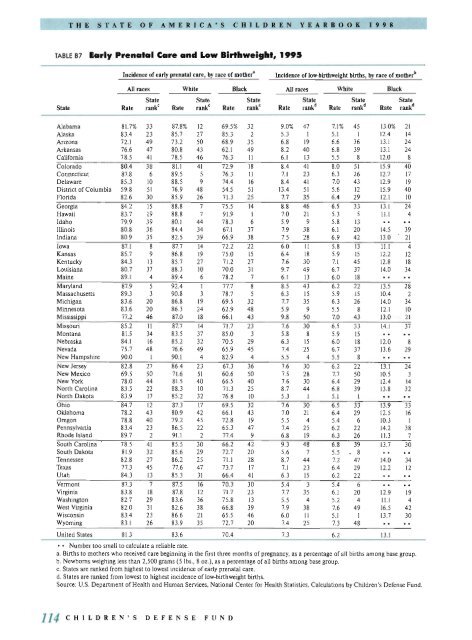
THE STATE OF AMERICA'S CHILDREN YEARBOOK 199 8 TABLE B7 Early Prenatal Care and Low Blrthwelght, 1995 Incidence of early prenatal care, by race of mother' Incidence of low·birthweight births, by race of mother b All races White Black All races White Black State State State State State State State Rate ranke: Rate rank' Rate rank e Rate rank d Rate rank d Rate rank d Alabama 81.7% 33 87.8% 12 69.5% 32 9.0% 47 7.1% 45 13.0% 21 Alaska 83.4 23 85.7 27 85.3 2 5.3 I 5.1 I 12.4 14 Arizona 72.1 49 73.2 50 68.9 35 6.8 19 6.6 36 13.1 24 Arkaosas 76.6 47 80.8 43 62.1 49 8.2 40 6.8 39 13.1 24 California 78.5 41 78.5 46 76.3 II 6.1 13 5.5 8 12.0 8 Colorado 80.4 38 81.1 41 72.9 18 8.4 41 8.0 51 15.9 40 Connecticut 87.8 6 89.5 5 76.3 II 7.1 23 6.3 26 12.7 17 Delaware 85.3 10 88.5 9 74.4 16 8.4 41 7.0 43 12.9 19 District ofColumbia 59.8 51 76.9 48 54.5 51 13.4 51 5.6 12 15.9 40 Florida 82.6 30 85.9 26 71.3 25 7.7 35 6.4 29 12.1 10 Georgia 84.2 15 88.8 7 75.5 14 8.8 46 6.5 33 13.1 24 Hawaii 83.7 19 88.8 7 91.9 I 7.0 21 5.3 5 11.1 4 Idaho 79.9 39 80.1 44 78.3 6 5.9 9 5.8 13 l1linois 80.8 36 84.4 34 67.1 37 7.9 38 6.1 20 14.5 39 Indiana 80.9 35 82.5 39 66.9 38 7.5 28 6.9 42 13.0 21 Iowa 87.1 8 87.7 14 72.2 22 6.0 11 5.8 13 11.1 4 Kansas 85.7 9 86.8 19 75.0 15 6.4 18 5.9 15 12.2 12 Kentucky 84.3 13 85.7 27 71.2 27 7.6 30 7.1 45 12.8 18 Louisiana 80.7 37 88.3 10 70.0 31 9.7 49 6.7 37 14.0 34 Maine 89.1 4 89.4 6 78.2 7 6.1 13 6.0 18 Maryland 87.9 5 92.4 I 77.7 8 8.5 43 6.2 22 13.5 28 Massachusetts 89.3 3 90.8 3 78.7 5 6.3 15 5.9 15 10.4 2 Michigao 83.6 20 86.8 19 69.5 32 7.7 35 6.3 26 14.0 34 Minnesota 83.6 20 86.3 24 62.9 48 5.9 9 5.5 8 12.1 10 Mississippi 77.2 46 87.0 18 66.1 43 9.8 50 7.0 43 13.0 21 Missouri 85.2 II 87.7 14 71.7 23 7.6 30 6.5 33 14.1 37 Montana 81.5 34 83.5 37 85.0 3 5.8 8 5.9 15 Nebraska 84.1 16 85.2 32 70.5 29 6.3 15 6.0 18 12.0 8 Nevada 75.7 48 76.6 49 65.9 45 7.4 25 6.7 37 13.6 29 New Hampshire 90.0 I 90.1 4 82.9 4 5.5 4 5.5 8 New Jersey 82.8 27 86.4 23 67.3 36 7.6 30 6.2 22 13.1 24 New Mexico 69.5 50 71.6 51 60.6 50 7.5 28 7.7 50 10.5 3 New York 78.0 44 81.5 40 66.5 40 7.6 30 6.4 29 12.4 14 North Carolina 83.5 22 88.3 10 71.3 25 8.7 44 6.8 39 13.8 32 North Dakota 83.9 17 85.2 32 76.8 10 5.3 1 5.1 I Ohio 84.7 12 87.3 17 69.5 32 7.6 30 6.5 33 13.9 33 Oklahoma 78.2 43 80.9 42 66.1 43 7.0 21 6.4 29 12.5 16 Oregon 78.8 40 79.2 45 72.8 19 5.5 4 5.4 6 10.3 I Pennsylvania 83.4 23 86.5 22 65.3 47 7.4 25 6.2 22 14.2 38 Rhode Island 89.7 2 91.1 2 77.4 9 6.8 19 6.3 26 11.3 7 South Carolina 78.5 41 85.5 30 66.2 42 9.3 48 6.8 39 13.7 30 South Dakota 81.9 32 85.6 29 72.7 20 5.6 7 5.5 8 Tennessee 82.8 27 86.2 25 71.1 28 8.7 44 7.2 47 14.0 34 Texas 77.3 45 77.6 47 73.7 17 7.1 23 6.4 29 12.2 12 Utah 84.3 13 85.3 31 66.4 41 6.3 15 6.2 22 Vermont 87.3 7 87.5 16 70.3 30 5.4 3 5.4 6 Virginia 83.8 18 87.8 12 71.7 23 7.7 35 6.1 20 12.9 19 Washington 82.7 29 83.6 36 75.8 13 5.5 4 5.2 4 11.1 4 West Virginia 82.0 31 82.6 38 66.8 39 7.9 38 7.6 49 16.5 42 Wisconsin 83.4 23 86.6 21 65.5 46 6.0 II 5.1 I 13.7 30 Wyoming 83.1 26 83.9 35 72.7 20 7.4 25 7.3 48 United States 81.3 83.6 70.4 7.3 6.2 13.1 •• Number too small to calculate a reliable rate. a. Births to mothers who received care beginning in the first three months of pregnancy, as a percentage ofall births among base group. b. Newborns weighing less than 2,500 grams (5 Ibs., 8 oz.), as a percentage of all births among base group. c. States are raoked from highest to lowest incidence ofearly prenatal care. d. States are ranked from lowest to highest incidence oflow-birthweight births. Source: U.S. Department ofHealth and Human Services, National Center for Health Statistics. Calculations by Children's Defense Fund. 114 CHILDREN'S DEFENSE FUND
CHI STATES TABLE B8 T••n Birth Ral••• State 1990 1991 1992 1993 1994 1995 Alabama 71.0 73.9 72.5 70.5 72.2 70.3 Alaska 65.3 65.4 63.9 56.8 55.5 50.2 Arizona 75.5 80.7 81.7 79.8 78.7 75.7 Arkansas 80.1 79.8 75.5 73.9 76.3 73.5 California 70.6 74.7 74.0 72.7 71.3 68.2 Colorado 54.5 58.2 58.4 55.2 54.3 51.3 Connecticut 38.8 40.4 39.4 39.2 40.3 39.3 Delaware 54.5 61.1 59.6 59.7 60.2 57.0 District ofColumbia 93.1 114.4 116.1 128.8 114.7 106.8 Florida 69.1 68.8 66.3 64.8 64.4 61.7 Georgia 75.5 76.3 74.5 73.0 71.7 71.1 Hawaii 61.2 58.7 53.5 53.0 53.5 47.9 Idaho 50.6 53.9 51.7 50.7 46.6 49.0 Illinois 62.9 64.8 63.6 63.0 62.8 59.9 Indiana 58.6 60.5 58.7 58.6 57.9 57.5 Iowa 40.5 42.6 40.8 41.1 39.7 38.6 Kansas 56.1 55.4 55.7 55.7 53.5 52.2 Kentucky 67.6 68.9 64.7 64.0 64.5 62.5 Louisiana 74.2 76.1 76.5 76.1 74.7 69.9 Maine 43.0 43.5 39.8 37.1 35.5 33.6 Maryland 53.2 54.3 50.7 50.1 49.7 47.7 Massacbusetts 35.1 37.8 38.0 37.9 37.2 34.3 Michigan 59.0 59.0 56.5 53.2 52.1 49.2 Minnesota 36.3 37.3 36.0 35.0 34.4 32.4 Mississippi 81.0 85.6 84.2 83.3 83.0 80.6 Missouri 62.8 64.5 63.2 59.8 59.0 55.5 Montana 48.4 46.7 46.2 45.7 41.2 41.8 Nebraska 42.3 42.4 41.1 40.5 42.8 37.6 Nevada 73.3 75.3 71.4 73.4 73.6 73.3 New Hampshire 33.0 33.3 31.3 30.7 30.1 30.5 New Jersey 40.5 41.6 39.2 38.1 39.3 38.0 New Mexico 78.2 79.8 80.3 81.1 77.4 74.5 New York 43.6 46.0 45.3 45.7 45.8 44.0 Nortb Carolina 67.6 70.5 69.5 66.8 66.3 64.1 North Dakota 35.4 35.6 37.3 36.8 34.6 33.5 Ohio 57.9 60.5 58.0 56.8 55.0 53.4 Oklahoma 66.8 72.1 69.9 68.6 65.9 64.0 Oregon 54.6 54.9 53.2 51.2 50.7 50.7 Pennsylvania 44.9 46.9 45.2 44.3 43.8 41.7 Rhode Island 43.9 45.4 47.5 49.8 47.7 43.1 South Carolina 71.3 72.9 70.3 66.0 66.5 65.1 South Dakota 46.8 47.5 48.3 44.3 42.8 40.5 Tennessee 72.3 75.2 71.4 70.2 71.0 67.9 Texas 75.3 78.9 78.9 78.1 77.6 76.1 Utah 48.5 48.2 46.3 44.5 42.7 42.4 Vermont 34.0 39.2 35.6 35.2 33.0 28.6 Virginia 52.9 53.5 51.8 49.8 50.7 48.7 Washington 53.1 53.7 50.9 50.2 48.2 47.6 West Virginia 57.3 57.8 56.0 55.6 54.3 52.7 Wisconsin 42.6 43.7 42.1 41.1 38.8 37.8 Wyoming 56.3 54.2 49.6 49.6 48.2 47.2 United States 59.9 62.1 60.7 59.6 58.9 56.8 'Number of births per 1,000 females ages 15-19. Source: U.S. Department of Health and Human Services, National Center for Health Statistics. CHILDREN'S DEFENSE FUND 115
- Page 87 and 88: CHAPTER CHILDREN AND FAMILIES IN CR
- Page 89 and 90: CHILDREN AND FAMILIES IN CRISIS pas
- Page 91 and 92: CHILDREN AND FAMILIES IN CRISIS in
- Page 93 and 94: CHILDREN A D FAMILIES IN CRISIS kin
- Page 95 and 96: CHILDREN AND FAMILIES IN CRISIS Box
- Page 97 and 98: '-- C~H,;,.;I L D R E NAN D F A MIL
- Page 99: CHILDREN AND FAMILIES IN CRISI""S"-
- Page 102 and 103: THE STATE OF AMERICA'S CHILDREN YEA
- Page 104 and 105: THE STATE OF AMERICA'S CHILDREN YEA
- Page 106 and 107: THE STATE OF AMERICA'S CHILDREN YEA
- Page 108 and 109: THE STATE OF AMERICA'S CHILDREN YEA
- Page 110 and 111: THE STATE OF AMERICA'S CHILDREN YEA
- Page 112 and 113: THE STATE OF AMERICA'S CHILDREN YEA
- Page 114 and 115: THE STATE OF AMERICA'S CHILDREN YEA
- Page 117 and 118: CHAPTER ADOLESCENT PREGNANCY fter r
- Page 119 and 120: ADOLESCENT PREGNANCY 512,115 babies
- Page 121 and 122: ADOLESCENT PREGNANCY sexual activit
- Page 123 and 124: ADOLESCENT PREGNANCY ings. However,
- Page 125: ADO L ESC EN T PRE G NAN C Y .... h
- Page 128 and 129: THE STATE OF AMERICA'S CHILDREN YEA
- Page 130 and 131: 106 CHI L D R EN' S D E FEN S E FUN
- Page 132 and 133: THE STATE OF AMERICA'S CHILDREN YEA
- Page 134 and 135: THE STATE OF AMERICA'S CHILDRE YEAR
- Page 136 and 137: THE STATE OF AMERICA'S CHILDREN YEA
- Page 140 and 141: THE STATE OF AMERICA'S HILDREN YEAR
- Page 142 and 143: THE STATE OF AMERICA'S CHILDREN YEA
- Page 144 and 145: THE STATE OF AMERICA'S CHILDREN YEA
- Page 146 and 147: THE STATE OF AMERICA'S CHILDREN YEA
- Page 148 and 149: Selected Web Sites Listed below are
- Page 150 and 151: THE STATE OF AMERICA'S CHILDREN YEA
- Page 152 and 153: THE STATE OF AMERICA'S CHILDREN YEA
- Page 154 and 155: THE STATE OF AMERICA'S CHILDREN YEA
THE STATE OF AMERICA'S CHILDREN YEARBOOK 199 8<br />
TABLE B7 Early Prenatal Care and Low Blrthwelght, 1995<br />
Incidence of early prenatal <strong>care</strong>, by race of mother'<br />
Incidence of low·birthweight births, by race of mother b<br />
All races White Black All races White Black<br />
State State State State State State<br />
State Rate ranke: Rate rank' Rate rank e Rate rank d Rate rank d Rate rank d<br />
Alabama 81.7% 33 87.8% 12 69.5% 32 9.0% 47 7.1% 45 13.0% 21<br />
Alaska 83.4 23 85.7 27 85.3 2 5.3 I 5.1 I 12.4 14<br />
Arizona 72.1 49 73.2 50 68.9 35 6.8 19 6.6 36 13.1 24<br />
Arkaosas 76.6 47 80.8 43 62.1 49 8.2 40 6.8 39 13.1 24<br />
California 78.5 41 78.5 46 76.3 II 6.1 13 5.5 8 12.0 8<br />
Colorado 80.4 38 81.1 41 72.9 18 8.4 41 8.0 51 15.9 40<br />
Connecticut 87.8 6 89.5 5 76.3 II 7.1 23 6.3 26 12.7 17<br />
Delaware 85.3 10 88.5 9 74.4 16 8.4 41 7.0 43 12.9 19<br />
District ofColumbia 59.8 51 76.9 48 54.5 51 13.4 51 5.6 12 15.9 40<br />
Florida 82.6 30 85.9 26 71.3 25 7.7 35 6.4 29 12.1 10<br />
Georgia 84.2 15 88.8 7 75.5 14 8.8 46 6.5 33 13.1 24<br />
Hawaii 83.7 19 88.8 7 91.9 I 7.0 21 5.3 5 11.1 4<br />
Idaho 79.9 39 80.1 44 78.3 6 5.9 9 5.8 13<br />
l1linois 80.8 36 84.4 34 67.1 37 7.9 38 6.1 20 14.5 39<br />
Indiana 80.9 35 82.5 39 66.9 38 7.5 28 6.9 42 13.0 21<br />
Iowa 87.1 8 87.7 14 72.2 22 6.0 11 5.8 13 11.1 4<br />
Kansas 85.7 9 86.8 19 75.0 15 6.4 18 5.9 15 12.2 12<br />
Kentucky 84.3 13 85.7 27 71.2 27 7.6 30 7.1 45 12.8 18<br />
Louisiana 80.7 37 88.3 10 70.0 31 9.7 49 6.7 37 14.0 34<br />
Maine 89.1 4 89.4 6 78.2 7 6.1 13 6.0 18<br />
Maryland 87.9 5 92.4 I 77.7 8 8.5 43 6.2 22 13.5 28<br />
Massachusetts 89.3 3 90.8 3 78.7 5 6.3 15 5.9 15 10.4 2<br />
Michigao 83.6 20 86.8 19 69.5 32 7.7 35 6.3 26 14.0 34<br />
Minnesota 83.6 20 86.3 24 62.9 48 5.9 9 5.5 8 12.1 10<br />
Mississippi 77.2 46 87.0 18 66.1 43 9.8 50 7.0 43 13.0 21<br />
Missouri 85.2 II 87.7 14 71.7 23 7.6 30 6.5 33 14.1 37<br />
Montana 81.5 34 83.5 37 85.0 3 5.8 8 5.9 15<br />
Nebraska 84.1 16 85.2 32 70.5 29 6.3 15 6.0 18 12.0 8<br />
Nevada 75.7 48 76.6 49 65.9 45 7.4 25 6.7 37 13.6 29<br />
New Hampshire 90.0 I 90.1 4 82.9 4 5.5 4 5.5 8<br />
New Jersey 82.8 27 86.4 23 67.3 36 7.6 30 6.2 22 13.1 24<br />
New Mexico 69.5 50 71.6 51 60.6 50 7.5 28 7.7 50 10.5 3<br />
New York 78.0 44 81.5 40 66.5 40 7.6 30 6.4 29 12.4 14<br />
North Carolina 83.5 22 88.3 10 71.3 25 8.7 44 6.8 39 13.8 32<br />
North Dakota 83.9 17 85.2 32 76.8 10 5.3 1 5.1 I<br />
Ohio 84.7 12 87.3 17 69.5 32 7.6 30 6.5 33 13.9 33<br />
Oklahoma 78.2 43 80.9 42 66.1 43 7.0 21 6.4 29 12.5 16<br />
Oregon 78.8 40 79.2 45 72.8 19 5.5 4 5.4 6 10.3 I<br />
Pennsylvania 83.4 23 86.5 22 65.3 47 7.4 25 6.2 22 14.2 38<br />
Rhode Island 89.7 2 91.1 2 77.4 9 6.8 19 6.3 26 11.3 7<br />
South Carolina 78.5 41 85.5 30 66.2 42 9.3 48 6.8 39 13.7 30<br />
South Dakota 81.9 32 85.6 29 72.7 20 5.6 7 5.5 8<br />
Tennessee 82.8 27 86.2 25 71.1 28 8.7 44 7.2 47 14.0 34<br />
Texas 77.3 45 77.6 47 73.7 17 7.1 23 6.4 29 12.2 12<br />
Utah 84.3 13 85.3 31 66.4 41 6.3 15 6.2 22<br />
Vermont 87.3 7 87.5 16 70.3 30 5.4 3 5.4 6<br />
Virginia 83.8 18 87.8 12 71.7 23 7.7 35 6.1 20 12.9 19<br />
Washington 82.7 29 83.6 36 75.8 13 5.5 4 5.2 4 11.1 4<br />
West Virginia 82.0 31 82.6 38 66.8 39 7.9 38 7.6 49 16.5 42<br />
Wisconsin 83.4 23 86.6 21 65.5 46 6.0 II 5.1 I 13.7 30<br />
Wyoming 83.1 26 83.9 35 72.7 20 7.4 25 7.3 48<br />
United States 81.3 83.6 70.4 7.3 6.2 13.1<br />
•• Number too small to calculate a reliable rate.<br />
a. Births to mothers who received <strong>care</strong> beginning in the first three months of pregnancy, as a percentage ofall births among base group.<br />
b. Newborns weighing less than 2,500 grams (5 Ibs., 8 oz.), as a percentage of all births among base group.<br />
c. States are raoked from highest to lowest incidence ofearly prenatal <strong>care</strong>.<br />
d. States are ranked from lowest to highest incidence oflow-birthweight births.<br />
Source: U.S. Department ofHealth and Human Services, National Center for Health Statistics. Calculations by Children's Defense Fund.<br />
114<br />
CHILDREN'S DEFENSE FUND


