Elektronika 2009-11.pdf - Instytut Systemów Elektronicznych
Elektronika 2009-11.pdf - Instytut Systemów Elektronicznych
Elektronika 2009-11.pdf - Instytut Systemów Elektronicznych

Create successful ePaper yourself
Turn your PDF publications into a flip-book with our unique Google optimized e-Paper software.
Both models are created of the basis of data received<br />
from the group of people or a group of technical measurement<br />
machines for classification. Classifiers can be a form of<br />
2 people, 3 people … a group of people or the population of<br />
a whole country etc. On the basis of empirical or declared results<br />
we receive average individual model of group from<br />
which the data was taken or average individual model of the<br />
person of the group [5].<br />
Group model is usually used when we do not know from<br />
whom exactly the linguistic information is received. We only<br />
know that the information comes from of the group (population)<br />
which the person belongs to. The model represents the<br />
whole group of people (the whole population). Whereas the<br />
average individual model of a person of group represents only<br />
the average person of the group (population), it does not represent<br />
the whole group of people (the whole population).<br />
Average individual probability<br />
classification functions from the group<br />
of people (population)<br />
In the group of people classification function of particular<br />
members are usually a bit different. For example in the group<br />
of 3 people each of them can differently understand the concept<br />
“medium” (Fig. 1).<br />
The question arises, what does the average individual classification<br />
function of one typical person of the group look like,<br />
in other words the most frequently found person in the group?<br />
Classification function of such person are most similar to<br />
the function of the majority of people in the examined population.<br />
Similarly the height of majority of people in a population<br />
is usually close to medium height. It means classification function<br />
of the majority people in the population are most similar<br />
to the function of the average person in the group.<br />
In the example presented in Fig. 1 the average individual<br />
classification function is drown in thick line.<br />
Average individual classification probability function answers<br />
the question: what is the probability the average (most<br />
frequently found) person in the group qualifies numerical value<br />
to the given linguistic concept.<br />
The different between the group classification function of<br />
linguistic concept and the average individual classification<br />
function is that the group function expresses the average value<br />
of classification probability by the whole group and the average<br />
individual classification function expresses the average classification<br />
probability by the average person from the group.<br />
Next the method of the identification of the average individual<br />
classification function to linguistic quantifiers is presented.<br />
In this methods the support of the linguistic concept are divided<br />
to the equal number of interval, then the integral of the<br />
function on every of support interval is computed (area on the<br />
interval limited by classification function and axis x). Next the<br />
average area for i-th interval of n linguistic concept is computed.<br />
where: n - the number of individual linguistics concept, f k (x) -<br />
classification function of individual linguistic concept, e.g.<br />
“small probability”.<br />
Average individual classification probability function will be<br />
created from average support intervals and the average area<br />
in the particular interval. The support and the area of the average<br />
individual classification probability function will be the<br />
mean of individual classification function. In the last stage having<br />
computed all the average quantifiers included in the dictionary<br />
of classification probability function we normalized<br />
them, so that the sum of all quantifiers is one. In many cases<br />
the normalization does not change anything because the sum<br />
of quantifiers is already one.<br />
Example 1. In the below example we will look into two<br />
quantifiers of classification function. For better understanding<br />
of the method the quantifiers are in the form of step function,<br />
Fig. 2. On the basis of the given quantifiers the average<br />
individual quantifier of classification function will be determined,<br />
using (1).<br />
The points of the support F_aver are the average points<br />
which divide the supports F1 and F2 (dotted line):<br />
The surface area of rectangles which create the function<br />
F_aver are the average surface area marked with doted line<br />
rectangles in F1 and F2, respectively, thus the heights of the<br />
rectangles are:<br />
(1)<br />
(2)<br />
(3)<br />
Fig. 1. The illustration of the sense of average individual classification<br />
probability function (thick line)<br />
Rys. 1. Ilustracja przeciętnej indywidualnej funkcji klasyfikacji<br />
(linia pogrubiona)<br />
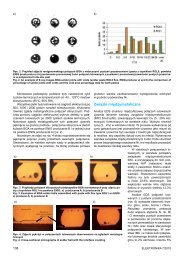
Fig. 3, 4 and 5 presents application of method of determining<br />
the average individual probability classification function using<br />
individual probability classification function received on the<br />
basis of the experiment which was carried out by the authors.<br />
Individual classification function show the models of individual<br />
people taking part of the experiment.<br />
ELEKTRONIKA 11/<strong>2009</strong> 13