Download PDF - Stockland
Download PDF - Stockland
Download PDF - Stockland

Create successful ePaper yourself
Turn your PDF publications into a flip-book with our unique Google optimized e-Paper software.
Our energy consumption<br />
Purchased electricity – Total Australian kWh<br />
FY10 FY09 FY08 FY07 FY06<br />
Corporate tenancies 1,622,297 1,655,224 Not reported Not reported Not reported<br />
Office 63,370,687 68,639,145 73,337,524 77,526,965 75,460,030<br />
Industrial 3,662,030 108,900 2,715,742 4,928,202 5,030,872<br />
Retail 69,030,062 60,110,466 64,762,680 66,085,690 67,071,111<br />
Residential 4,724,216 Not reported Not reported Not reported Not reported<br />
Residential contractors 89,785 Not reported Not reported Not reported Not reported<br />
Retirement Living 1,725,830 Not reported Not reported Not reported Not reported<br />
Retirement Living contractors 7 Not reported Not reported Not reported Not reported<br />
Total 144,224,914 130,513,736 140,815,946 148,540,858 147,562,013<br />
Purchased electricity (kWh)<br />
FY10<br />
FY09<br />
FY08<br />
FY07<br />
144,224,914<br />
130,513,735<br />
140,815,946<br />
148,540,858<br />
FY06 147,562,013<br />
Base building electricity for office, industrial<br />
and retail assets and corporate tenancies.<br />
Residential and Retirement Living data was not<br />
reported for FY06–09 purchased electricity.<br />
Boundary: This data captures the base-building electricity purchased for office, industrial and retail assets<br />
owned and managed by <strong>Stockland</strong> for FY06, FY07 and FY08. For FY09 and FY10 we have reported against an<br />
‘operational control’ boundary. Tenant usage is not included, except where we are the tenant. For those retail,<br />
industrial and office assets that do not have 12 months of data, estimates are provided for those missing months.<br />
Gas consumption – Total Australian MJ<br />
FY10 FY09 FY08 FY07 FY06<br />
Office 30,665,244 34,287,190 37,766,323 48,300,919 49,278,237<br />
Industrial 702,056 401,271 Not reported Not reported Not reported<br />
Retail 569,172 788,136 5,114,614 5,114,614 9,977,497<br />
Residential 747,679 Not reported Not reported Not reported Not reported<br />
Retirement Living 57,082 Not reported Not reported Not reported Not reported<br />
Total 32,741,233 35,476,597 42,880,937 53,415,533 59,255,734<br />
Boundary: This data captures the base building gas consumption for office, retail and industrial assets owned<br />
and managed by <strong>Stockland</strong> for FY06–FY08. For FY09 and FY10 we have reported against an ‘operational<br />
control’ boundary. Tenant usage is not included. For those retail, office and industrial assets that do not have<br />
12 months of data, estimates are provided for those missing months.<br />
Gas consumption (MJ)<br />
FY10<br />
FY09<br />
FY08<br />
FY07<br />
32,741,233<br />
35,476,597<br />
42,880,937<br />
53,415,533<br />
FY06 59,255,734<br />
Residential and Retirement Living data was not<br />
reported for FY06–09 consumed gas.<br />
FY10<br />
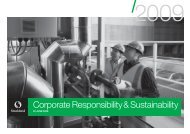
<strong>Stockland</strong> Corporate Responsibility & Sustainability Report June 2010<br />
0 10000000 20000000 30000000 40000000 50000000 60000000<br />
81