Download PDF - Stockland
Download PDF - Stockland
Download PDF - Stockland

Create successful ePaper yourself
Turn your PDF publications into a flip-book with our unique Google optimized e-Paper software.
Total Scope 3 (kgCO 2<br />
-e)<br />
FY10 FY09 FY08 FY07 FY06<br />
Total transmission and<br />
production losses from<br />
purchased electricity and gas<br />
and fuel for vehicle fleet 23,159,819 19,718,223 21,248,048 22,702,571 23,090,218<br />
Car hire 65,048 42,105 79,460 66,572 65,048<br />
Air travel 1,241,197 1,070,393 1,078,377 1,099,714 1,241,197<br />
Total 24,466,064 20,830,721 22,405,885 23,868,857 24,396,463<br />
Notes: Residential and Retirement Living data was not reported for FY06–FY09 individual scopes.<br />
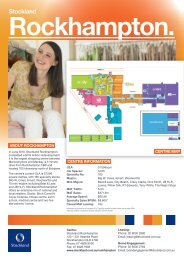
Scope 3 greenhouse gas emissions (kgCO 2 -e)<br />
FY10<br />
FY09<br />
FY08<br />
FY07<br />
20,830,721<br />
24,466,064<br />
22,405,885<br />
23,868,857<br />
FY06 23,532,424<br />
Residential and Retirement Living data was not<br />
reported for FY06–09 individual scopes.<br />
Our methodology<br />
This report uses the Australian<br />
Government’s Department of Climate<br />
Change National Greenhouse Accounts<br />
(NGA) Factors Workbook (June 2009) to<br />
calculate Scope 1, 2 and 3 emissions from<br />
the following sources:<br />
• Electricity,<br />
• Gas,<br />
• Refrigerants,<br />
• Fuel: petrol, diesel, LPG and ethanol<br />
10 per cent.<br />
The 2009 WRI Workbook CO 2<br />
Mobile<br />
(version 1.3) has been used to calculate<br />
emissions from air travel. The 2003<br />
Workbook was used to derive the medium<br />
haul emissions factor.<br />
Scope 1 incorporates fuel use in our<br />
vehicle fleet, gas burned in our Office,<br />
Industrial, Retail, Residential and<br />
Retirement Living assets, gas from a<br />
decommissioned coal seam gas plant,<br />
refrigerant emissions, and fuel, grease<br />
and oil used by our contractors.<br />
Scope 2 covers base-building electricity<br />
purchased for our Office, Industrial, Retail,<br />
Residential and Retirement Living assets,<br />
our corporate tenancies, and electricity<br />
used by our contractors.<br />
Scope 3 covers transmission and<br />
production losses from purchased<br />
electricity, gas and fuel for our assets<br />
and contractors, and emissions from<br />
employee travel (flights and car hire).<br />
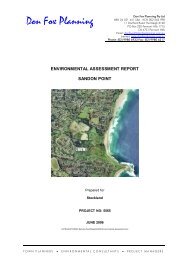
Our emissions boundary<br />
All figures are Australian operations.<br />
We report according to our ‘operational<br />
control’ boundary under the National<br />
Greenhouse and Energy Reporting Act<br />
(NGERA). We report on the base-building<br />
electricity and gas consumption and the<br />
resulting greenhouse gas emissions from<br />
the Office, Industrial, Retail, Residential<br />
and Retirement Living assets for which<br />
we have operational control. The GHG<br />
emissions from our four largest office<br />
tenancies were 1,621,578 kgs of CO 2<br />
for<br />
calendar year 2007. This figure has not<br />
been included in the emissions totals.<br />
Our tenancy consumption for FY10 has<br />
been included. For those assets that do<br />
not have 12 months of data, estimates are<br />
provided for those missing months.<br />
For our Residential assets we report<br />
electricity and gas consumption for<br />
our operations and emissions from<br />
contractors working on projects under<br />
our operational control. This includes<br />
electricity, gas, fuel, oil and grease<br />
consumption. Our emissions boundary<br />
includes a decommissioned coal seam<br />
gas mine. Annual emissions from this<br />
site are estimated at 12.4 tCO 2<br />
-e pa.<br />
Greenhouse gas intensity<br />
The most appropriate measure of<br />
emissions intensity is on a per square<br />
metre basis for the individual asset<br />
classes. We use the same ‘operational<br />
control’ boundary for our total figures.<br />
The greenhouse gas emissions of our<br />
office and retail business are divided by<br />
the floor area of those assets.<br />
<strong>Stockland</strong> Corporate Responsibility & Sustainability Report June 2010<br />
79