Tourism Sector Performance Report for Q3 2011 - Singapore ...
Tourism Sector Performance Report for Q3 2011 - Singapore ...
Tourism Sector Performance Report for Q3 2011 - Singapore ...

Create successful ePaper yourself
Turn your PDF publications into a flip-book with our unique Google optimized e-Paper software.
5/1/2012<br />
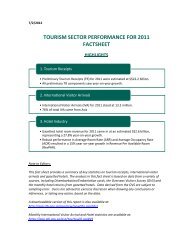
TOURISM SECTOR PERFORMANCE<br />
HIGHLIGHTS<br />
1. <strong>Tourism</strong> Receipts<br />
• <strong>Tourism</strong> Receipts (TR) <strong>for</strong> Quarter Three (<strong>Q3</strong>) <strong>2011</strong> were estimated at S$6<br />
billion, registering a 12% year-on-year growth.<br />
• All TR components <strong>for</strong> <strong>Q3</strong> <strong>2011</strong> saw year-on-year growth.<br />
2. International Visitor Arrivals<br />
• International Visitor Arrivals (IVA) <strong>for</strong> <strong>Q3</strong> <strong>2011</strong> stood at close to 3.5 million,<br />
representing a 15% year-on-year growth.<br />
3. Hotel Industry<br />
• Gazetted hotel room revenue <strong>for</strong> <strong>Q3</strong> <strong>2011</strong> came in at an estimated S$0.7<br />
billion, representing an 18% year-on-year growth.<br />
• Robust per<strong>for</strong>mance in Average Room Rate (ARR) and Average Occupancy Rate<br />
(AOR) resulted in a 16% growth in Revenue Per Available Room (RevPAR).<br />
Note to Editors:<br />
This quarterly report provides a summary of key statistics on tourism receipts, international<br />
visitor arrivals and gazetted hotels. The analysis in this report is based on data from a variety of<br />
sources, including Disembarkation/Embarkation cards, the Overseas Visitors Survey (OVS) and<br />
the monthly hotel returns from gazetted hotels. Data derived from the OVS are subject to<br />
sampling error. Users are advised to exercise discretion when drawing any conclusions or<br />
inferences, or taking any action, based on the data.<br />
A downloadable version of this report is also available at:<br />
http://app.stb.gov.sg/asp/new/new02a.asp?id=3<br />
Monthly International Visitor Arrival and Hotel statistics are available at:<br />
https://app.stb.gov.sg/asp/tou/tou02.asp#VS
1. <strong>Tourism</strong> Receipts<br />
QUARTER THREE <strong>2011</strong> PERFORMANCE 1<br />
<strong>Tourism</strong> Receipts (TR) <strong>for</strong> Quarter Three (<strong>Q3</strong>) <strong>2011</strong> were estimated at S$6 billion, registering a<br />
12% year-on-year growth. All TR components saw year-on-year growth.<br />
<strong>Tourism</strong> Receipts by Major Components, <strong>Q3</strong> <strong>2011</strong><br />
<strong>Tourism</strong> Receipts: S$6 billion (+12% vs <strong>Q3</strong> 2010)<br />
% Change<br />
vs 2010<br />
% Share<br />
19%<br />
Shopping<br />
1,188<br />
20%<br />
13%<br />
Accommodation<br />
1,114<br />
19%<br />
17%<br />
Food & Beverage<br />
585<br />
10%<br />
9%<br />
Sightseeing & Entertainment<br />
(including Gaming)<br />
1,448<br />
24%<br />
7%<br />
Other TR Components<br />
1,591<br />
27%<br />
S$ Millions - 500 1,000 1,500 2,000<br />
Source: Disembarkation/Embarkation Cards and Overseas Visitor Survey<br />
- Sightseeing & Entertainment includes entrance fees to attractions and nightspots, expenditure on day-tours, leisure events and entertainment at the Integrated Resorts.<br />
- Other TR components include expenditure on airfares, port taxes, local transportation, business, medical, education and trans it visitors.<br />
Chart 1: <strong>Tourism</strong> Receipts by Major Components, <strong>Q3</strong> <strong>2011</strong><br />
Excluding Sightseeing & Entertainment expenditure, Indonesia (S$781 million), P R China (S$603<br />
million), Australia (S$296 million), India (S$296 million) and Japan (S$232 million) were<br />
<strong>Singapore</strong>’s top five TR generating markets <strong>for</strong> <strong>Q3</strong> <strong>2011</strong>.<br />
All top 10 markets registered year-on-year growth in <strong>Q3</strong>, except USA (-14%) which saw a<br />
continuing decline in business traffic. India (+41%) was the top growth market in terms of TR,<br />
boosted by a strong increase in business traffic in <strong>Q3</strong>. Significant TR increases were also<br />
registered <strong>for</strong> Japan (36%), Philippines (34%) and P R China (31%), primarily due to an increase<br />
in leisure traffic and shopping expenditure.<br />
<strong>Tourism</strong> Receipts by Major Components, Top 10 Markets, <strong>Q3</strong> <strong>2011</strong><br />
<strong>Tourism</strong> Receipts: S$6 billion (+12% vs <strong>Q3</strong> 2010)<br />
% Change<br />
vs 2010<br />
Shopping Accommodation Food & Beverage Other TR Components<br />
<strong>2011</strong> TR*<br />
(S$ mil)<br />
13%<br />
Overall<br />
27%<br />
25%<br />
13%<br />
36%<br />
4,477<br />
6%<br />
Indonesia<br />
28%<br />
17%<br />
9%<br />
46%<br />
781<br />
31%<br />
P R China<br />
53%<br />
14%<br />
7%<br />
25%<br />
603<br />
1%<br />
Australia<br />
18%<br />
23%<br />
13%<br />
46%<br />
296<br />
41%<br />
India<br />
19%<br />
35%<br />
17%<br />
30%<br />
296<br />
36%<br />
Japan<br />
17%<br />
30%<br />
13%<br />
40%<br />
232<br />
14%<br />
Malaysia<br />
29%<br />
27%<br />
10%<br />
34%<br />
220<br />
34%<br />
Philippines<br />
21%<br />
35%<br />
17%<br />
27%<br />
201<br />
-14%<br />
USA<br />
8%<br />
40%<br />
20%<br />
31%<br />
164<br />
6%<br />
UK<br />
10%<br />
26%<br />
15%<br />
49%<br />
153<br />
6%<br />
Hong Kong SAR<br />
18%<br />
32%<br />
18%<br />
32%<br />
148<br />
0% 10% 20% 30% 40% 50% 60% 70% 80% 90% 100%<br />
Expenditure is estimated from Overseas Visitor Survey.<br />
Other TR components include expenditure on airfares, port taxes, local transportation, business, medical, education and transit visitors.<br />
*Sightseeing & entertainment has been excluded in the country analysis due to commercial sensitivity of in<strong>for</strong>mation.<br />
Chart 2: <strong>Tourism</strong> Receipts by Major Components, Top 10 Markets, <strong>Q3</strong> <strong>2011</strong>
1. <strong>Tourism</strong> Receipts<br />
JANUARY TO SEPTEMBER <strong>2011</strong> PERFORMANCE 1<br />
<strong>Tourism</strong> Receipts (TR) <strong>for</strong> January to September <strong>2011</strong> were estimated at S$17 billion,<br />
registering a 22% year-on-year growth.<br />
% Change<br />
vs 2010<br />
<strong>Tourism</strong> Receipts by Major Components, January-September <strong>2011</strong><br />
<strong>Tourism</strong> Receipts: S$17 billion (+22% vs Jan-Sep 2010)<br />
Q1 Q2 <strong>Q3</strong><br />
% Share<br />
13%<br />
Shopping<br />
1,043<br />
1,048<br />
1,188<br />
20%<br />
21%<br />
Accommodation<br />
1,034<br />
1,081<br />
1,114<br />
19%<br />
21%<br />
Food & Beverage<br />
546<br />
544<br />
585<br />
10%<br />
56%<br />
Sightseeing & Entertainment<br />
(including Gaming)<br />
1,344<br />
1,283<br />
1,448<br />
25%<br />
6%<br />
Other TR Components<br />
1,360<br />
1,360<br />
1,591<br />
26%<br />
S$ Millions - 1,000 2,000 3,000 4,000 5,000<br />
Source: Disembarkation/Embarkation Cards and Overseas Visitor Survey<br />
- Sightseeing & Entertainment includes entrance fees to attractions and nightspots, expenditure on day-tours, leisure events and entertainment at the Integrated Resorts.<br />
- Other TR components include expenditure on airfares, port taxes, local transportation, business, medical, education and trans it visitors.<br />
Chart 3: <strong>Tourism</strong> Receipts by Major Components, January-September <strong>2011</strong><br />
Excluding Sightseeing & Entertainment expenditure, Indonesia (S$2,114 million), P R China<br />
(S$1,579 million), Australia (S$818 million), India (S$808 million) and Malaysia (S$635 million)<br />
were <strong>Singapore</strong>’s top five TR generating markets <strong>for</strong> January to September <strong>2011</strong>.<br />
<strong>Tourism</strong> Receipts by Major Components, Top 10 Markets, January to September <strong>2011</strong><br />
<strong>Tourism</strong> Receipts: S$17 billion (+22% vs Jan-Sep 2010)<br />
% Change<br />
vs 2010<br />
Shopping Accommodation Food & Beverage Other TR Components<br />
<strong>2011</strong> TR*<br />
(S$ mil)<br />
13%<br />
Overall<br />
26%<br />
26%<br />
13%<br />
35%<br />
12,495<br />
8%<br />
Indonesia<br />
30%<br />
16%<br />
9%<br />
45%<br />
2,114<br />
28%<br />
P R China<br />
50%<br />
17%<br />
8%<br />
25%<br />
1,579<br />
8%<br />
Australia<br />
17%<br />
25%<br />
14%<br />
43%<br />
818<br />
20%<br />
India<br />
22%<br />
32%<br />
15%<br />
30%<br />
808<br />
19%<br />
Malaysia<br />
31%<br />
25%<br />
11%<br />
33%<br />
635<br />
39%<br />
Philippines<br />
23%<br />
36%<br />
19%<br />
23%<br />
628<br />
30%<br />
Japan<br />
17%<br />
31%<br />
13%<br />
39%<br />
589<br />
-3%<br />
USA<br />
10%<br />
40%<br />
19%<br />
30%<br />
478<br />
14%<br />
Hong Kong SAR<br />
16%<br />
34%<br />
18%<br />
31%<br />
430<br />
8%<br />
Thailand<br />
23%<br />
36%<br />
16%<br />
25%<br />
425<br />
0% 10% 20% 30% 40% 50% 60% 70% 80% 90% 100%<br />
Expenditure is estimated from Overseas Visitor Survey.<br />
Other TR components include expenditure on airfares, port taxes, local transportation, business, medical, education and transit visitors.<br />
*Sightseeing & entertainment has been excluded in the country analysis due to commercial sensitivity of in<strong>for</strong>mation.<br />
Chart 4: <strong>Tourism</strong> Receipts by Major Components, Top 10 Markets, January-September <strong>2011</strong><br />
Asia’s share of TR continues to grow, as western markets such as USA and UK, affected by poor<br />
economic conditions, showed a decline in their respective shares of TR.<br />
1<br />
All <strong>Tourism</strong> Receipts estimates are correct as at 12 December <strong>2011</strong>.
IVA<br />
2. International Visitor Arrivals<br />
QUARTER THREE <strong>2011</strong> PERFORMANCE<br />
International Visitor Arrivals (IVA) <strong>for</strong> <strong>Q3</strong> stood at close to 3.5 million, representing a 15% yearon-year<br />
growth. IVA <strong>for</strong> July <strong>2011</strong> was the highest ever recorded thus far <strong>for</strong> any single month.<br />
August and September have the highest recorded IVA <strong>for</strong> the respective months.<br />
1,400,000<br />
1,200,000<br />
1,000,000<br />
800,000<br />
International Visitor Arrivals, January to September <strong>2011</strong><br />
Jan-Sep <strong>2011</strong>: 9.8 million (+15% vs Jan-Sep 2010)<br />
JANUARY TO SEPTMBER<br />
<strong>2011</strong> PERFORMANCE<br />
• IVA: over 9.8 million<br />
(+15%)<br />
600,000<br />
400,000<br />
200,000<br />
-<br />
JAN FEB MAR APR MAY JUN JUL AUG SEP<br />
IVA <strong>2011</strong> 1,055,908 990,107 1,071,916 1,103,065 1,054,018 1,079,959 1,273,846 1,178,429 1,033,608<br />
IVA 2010 908,495 857,387 928,903 939,013 946,676 951,032 1,095,047 996,899 947,585<br />
% Change 16% 15% 15% 17% 11% 14% 16% 18% 9%<br />
Chart 5: International Visitor Arrivals, January-September <strong>2011</strong><br />
JANUARY TO SEPTEMBER <strong>2011</strong> PERFORMANCE<br />
Indonesia (1,925,000), P R China (1,230,000), Malaysia (817,000), Australia (717,000) and India<br />
(641,000) were <strong>Singapore</strong>'s top five international visitor-generating markets <strong>for</strong> the period of<br />
January to September <strong>2011</strong> 2 . These markets accounted <strong>for</strong> 54% of total IVA <strong>for</strong> the period.<br />
P R China (+39%) and the Philippines (+30%) registered the highest percentage growth out of<br />
the top 15 markets <strong>for</strong> the period of January to September <strong>2011</strong>.<br />
International Visitor Arrivals, Top 15 Markets, January to September <strong>2011</strong><br />
% Chg vs. 10 Jan-Sep <strong>2011</strong>: 9.8 million (+15% vs Jan-Sep 2010)<br />
+14 Indonesia<br />
1,925<br />
+39 P R China<br />
1,230<br />
+13<br />
+10<br />
+6<br />
Malaysia<br />
Australia<br />
India<br />
817<br />
717<br />
641<br />
+30<br />
+23<br />
+25<br />
+16<br />
+6<br />
-3<br />
+14<br />
+3<br />
+25<br />
+4<br />
Philippines<br />
Japan<br />
Hong Kong SAR<br />
Thailand<br />
USA<br />
UK<br />
South Korea<br />
Vietnam<br />
Taiwan<br />
Germany<br />
505<br />
475<br />
366<br />
351<br />
331<br />
330<br />
319<br />
259<br />
190<br />
157<br />
'000s<br />
0 500 1000 1500 2000 2500<br />
Source: Disembarkation/Embarkation cards<br />
Chart 6: International Visitor Arrivals, Top 15 Markets, January-September <strong>2011</strong><br />
2<br />
Statistics on top international visitor-generating markets <strong>for</strong> <strong>Q3</strong> can be found here: https://app.stb.gov.sg/asp/tou/tou0201.asp
3. Hotel Industry<br />
QUARTER THREE <strong>2011</strong> PERFORMANCE<br />
Gazetted hotel room revenue <strong>for</strong> <strong>Q3</strong> <strong>2011</strong> came in at an estimated S$0.7 billion, representing<br />
an 18% year-on-year growth.<br />
July <strong>2011</strong> posted a record high AOR as IVA reached an all-time peak. With continued increase<br />
in IVA as a result of F1 and the accompanying events of the Grand Prix Season <strong>Singapore</strong> among<br />
others, September <strong>2011</strong> registered the highest REVPAR ever recorded.<br />
<strong>2011</strong> 2010<br />
ARR<br />
($)<br />
AOR<br />
(%)<br />
RevPAR<br />
($)<br />
ARR<br />
($)<br />
AOR<br />
(%)<br />
RevPAR<br />
($)<br />
January 227 82 187 189 81 153<br />
February 229 83 190 200 80 161<br />
March 240 87 208 206 89 182<br />
April 239 86 205 213 86 183<br />
May 244 85 207 214 87 185<br />
June 250 88 221 222 89 197<br />
July 245 94 229 215 88 190<br />
August 239 85 203 225 83 186<br />
September 271 87 235 243 81 197<br />
Table 1: ARR, AOR & RevPAR, January to September 2010 & <strong>2011</strong><br />
QUARTER THREE <strong>2011</strong> PERFORMANCE – ACROSS HOTEL TIERS<br />
Average Room Rate (ARR 3 ) stood at S$251 in <strong>Q3</strong> <strong>2011</strong>, a year-on-year increase of 11%. Room<br />
rates <strong>for</strong> all hotel tiers increased, with the Upscale tier posting the highest growth rate at 11%.<br />
Average Occupancy Rate (AOR 4 ) reached 88% in <strong>Q3</strong> <strong>2011</strong>.<br />
JANUARY TO<br />
SEPTEMBER <strong>2011</strong><br />
PERFORMANCE<br />
• Gazetted hotel<br />
room revenue:<br />
S$1.9 billion<br />
(+31%)<br />
• Highest AOR: July<br />
• Highest ARR and<br />
RevPAR:<br />
September<br />
Robust per<strong>for</strong>mance in ARR and AOR resulted in a 16% growth in Revenue Per Available Room<br />
(RevPAR 5 ), which stood at S$222 in <strong>Q3</strong> <strong>2011</strong>. The Upscale tier was the top per<strong>for</strong>mer in terms<br />
of RevPAR growth.<br />
<strong>Q3</strong> <strong>2011</strong><br />
ARR AOR RevPAR<br />
$ %∆ % %∆ $ %∆<br />
OVERALL 251 11% 88 4% pt 222 16%<br />
LUXURY 404 9% 82 4% pt 330 15%<br />
UPSCALE 282 11% 90 7% pt 255 20%<br />
MID-TIER 191 8% 88 1% pt 168 9%<br />
ECONOMY 112 3% 86 0% pt 97 2%<br />
Table 2: ARR, AOR and RevPAR, <strong>Q3</strong> <strong>2011</strong><br />
3<br />
Standard AOR = [Gross lettings (Room Nights) / Available room nights] x 100<br />
4<br />
Standard AOR = [Gross lettings (Room Nights) / Available room nights] x 100<br />
5<br />
RevPAR = AOR x ARR
Note:<br />
The hotel tiering system is a reference system developed by the <strong>Singapore</strong> <strong>Tourism</strong> Board (STB) to categorise the<br />
different hotels in <strong>Singapore</strong> into tiers based on a combination of factors that include average room rates, location<br />
and product characteristics.<br />
Figures <strong>for</strong> the hotel industry are preliminary estimates, based on returns as at 26 November <strong>2011</strong>. The current<br />
hotel tiers published are based on the hotels’ per<strong>for</strong>mance in 2010. The response rate across the tiers may vary.<br />
Luxury - Includes hotels in the luxury segment and are predominantly in prime locations and/or in historical<br />
buildings<br />
Upscale - Includes hotels in the upscale segment and are generally in prime locations or hotels with boutique<br />
positioning in prime or distinctive locations<br />
Mid-Tier - Includes hotels in the mid-tier segment and are primarily located in prime commercial zones or<br />
immediately outlying areas<br />
Economy - Includes hotels in the budget segment and are generally located in outlying areas
For more in<strong>for</strong>mation, please contact:<br />
Siti Nurhidayati (Ms)<br />
Communications Division<br />
<strong>Singapore</strong> <strong>Tourism</strong> Board<br />
Tel: +65 6831 3416<br />
Email: siti_nurhidayati@stb.gov.sg<br />
Or the STB Media Hotline at +65 9011 2071