Slides Chapter 1. Measure Theory and Probability
Slides Chapter 1. Measure Theory and Probability
Slides Chapter 1. Measure Theory and Probability

Create successful ePaper yourself
Turn your PDF publications into a flip-book with our unique Google optimized e-Paper software.
<strong>1.</strong>5. OTHER DEFINITIONS OF PROBABILITY<br />
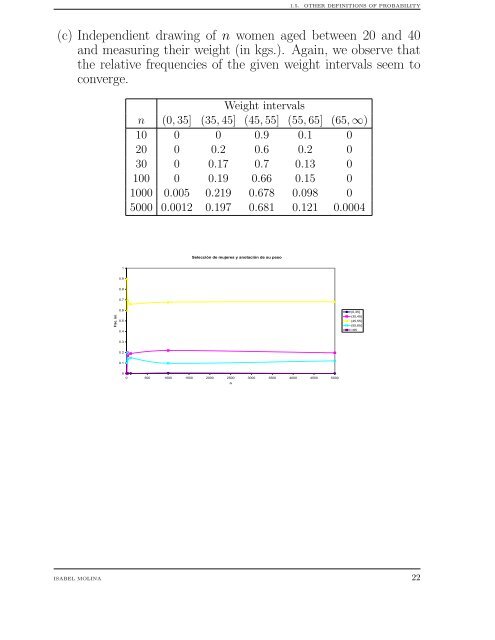
(c) Independient drawing of n women aged between 20 <strong>and</strong> 40<br />
<strong>and</strong> measuring their weight (in kgs.). Again, we observe that<br />
the relative frequencies of the given weight intervals seem to<br />
converge.<br />
Weight intervals<br />
n (0,35] (35,45] (45,55] (55,65] (65,∞)<br />
10 0 0 0.9 0.1 0<br />
20 0 0.2 0.6 0.2 0<br />
30 0 0.17 0.7 0.13 0<br />
100 0 0.19 0.66 0.15 0<br />
1000 0.005 0.219 0.678 0.098 0<br />
5000 0.0012 0.197 0.681 0.121 0.0004<br />
Selección de mujeres y anotación de su peso<br />
1<br />
0.9<br />
0.8<br />
0.7<br />
Frec. rel.<br />
0.6<br />
0.5<br />
0.4<br />
(0,35]<br />
(35,45]<br />
(45,55]<br />
(55,65]<br />
>65<br />
0.3<br />
0.2<br />
0.1<br />
0<br />
0 500 1000 1500 2000 2500 3000 3500 4000 4500 5000<br />
n<br />
ISABEL MOLINA 22