The Fly's Eye - CASPER - University of California, Berkeley
The Fly's Eye - CASPER - University of California, Berkeley
The Fly's Eye - CASPER - University of California, Berkeley

You also want an ePaper? Increase the reach of your titles
YUMPU automatically turns print PDFs into web optimized ePapers that Google loves.
<strong>The</strong> Fly’s <strong>Eye</strong>: Instrumentation for Detection <strong>of</strong> Radio<br />
Ephemeron<br />
Andrew P. V. Siemion 1,3 , Dan Werthimer 2,3,4 and Ge<strong>of</strong>f Marcy 1,5<br />
<strong>University</strong> <strong>of</strong> <strong>California</strong>, <strong>Berkeley</strong>, CA 94720<br />
<strong>The</strong> Fly’s <strong>Eye</strong> Team: Ge<strong>of</strong>f Bower 1 , Griffin Foster 1,3 , Peter McMahon 3 , Joeri van<br />
Leeuwen 1 , Mark Wagner 3<br />
Received ; accepted<br />
1 Department <strong>of</strong> Astronomy<br />
2 Space Sciences Laboratory<br />
3 Center for Astronomy Signal Processing and Electronics Research<br />
4 Research Advisor<br />
5 Faculty Advisor
– 2 –<br />
ABSTRACT<br />
Here we present a preliminary report on the design, construction, deployment<br />
and testing <strong>of</strong> the “Fly’s <strong>Eye</strong>,” a 44 input, 128 channel, 209 MHz bandwidth,<br />
600 microsecond accumulation time spectrometer and analysis system designed<br />
to detect powerful dispersed radio transients using the Allen Telescope Array<br />
(ATA). <strong>The</strong> Fly’s <strong>Eye</strong> has been successfully installed at the ATA, and to-date<br />
over 24 hours <strong>of</strong> observations have been performed using the instrument. Of the<br />
extant 24 hours <strong>of</strong> observation time, approximately 18 hours has used the antenna<br />
beams configured in a close-pack hexagon (‘fly’s eye’) pattern, with the remaining<br />
observations using a single-position pointing <strong>of</strong> several diagnostic sources.<br />
Although analysis <strong>of</strong> the close-pack hexagon-configuration data is still at a very<br />
early stage, cursory examination <strong>of</strong> the diagnostic data indicates the system is<br />
functioning within expectations. Here we explore the background and motivation<br />
for the experiment and describe development details, including specifications <strong>of</strong><br />
the instrument hardware and testing procedures. Early analysis <strong>of</strong> diagnostic<br />
observations are also included. Future analysis <strong>of</strong> Fly’s <strong>Eye</strong> data is outlined.<br />
1. Background and Motivation<br />
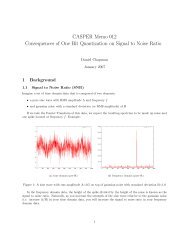
1.1. <strong>The</strong> Lorimer Pulse<br />
<strong>The</strong> recent discovery by Lorimer et al. (5) <strong>of</strong> a powerful (∼ 30Jy) and highly dispersed<br />
(DM ∼ 375 pc cm −3 ) radio pulse has dramatically renewed interest in transient radio<br />
phenomena. <strong>The</strong> Lorimer Pulse was found during a re-examination <strong>of</strong> Parkes Pulsar Survey<br />
data with a source direction <strong>of</strong> approximately 3 degrees south <strong>of</strong> the center <strong>of</strong> the SMC.<br />
<strong>The</strong> ionized portion <strong>of</strong> the ISM (and IGM) introduces a frequency dependence on the
– 3 –<br />
group velocity <strong>of</strong> an otherwise broadband radio pulse according to the relation:<br />
[ ( vlo<br />
) −2 ( vhigh<br />
) ] −2 DM<br />
∆t = 4.15ms<br />
−<br />
GHz GHz cm −3 pc<br />
(1)<br />
Where ∆t is the time delay between the portions <strong>of</strong> the pulse at frequency v lo and v high .<br />
With the dispersion measure, DM given in units <strong>of</strong> cm −3 pc, defined as:<br />
∫ d<br />
DM = n e dl (2)<br />
Where n e is electron density and d the distance to the source. This allows us to infer a<br />
distance to the source based on estimates <strong>of</strong> the various contributions to the integrated<br />
electron column density along the line <strong>of</strong> sight to the source.<br />
<strong>The</strong> extraordinarily large dispersion measure <strong>of</strong> the Lorimer Pulse, and the apparent<br />
absence <strong>of</strong> any ISM or SMC contribution that could have generated it, led Lorimer to<br />
conclude that the pulse may have originated well outside our galaxy ( 500Mpc.) Analysis<br />
by S. R. Kulkarni et al. (4) <strong>of</strong> other potential sources <strong>of</strong> the large dispersion measure, such<br />
as a suitably arranged ionized nebula, has been unable to account for the large dispersion<br />
<strong>of</strong> the pulse and frequency dependence <strong>of</strong> the pulse width via any other mechanism than<br />
the pulse’s extra-galactic origin.<br />
<strong>The</strong> strongest known sources <strong>of</strong> radio pulses, RRATs and pulsar giant pulses, are<br />
incapable <strong>of</strong> producing a pulse <strong>of</strong> the power <strong>of</strong> the Lorimer Pulse at such a great distance.<br />
Thus, if we accept that the Lorimer Pulse is indeed extra-galactic, this pulse and others<br />
like it hint at the existence <strong>of</strong> a previously unobserved, highly energetic, transient radio<br />
phenomena that could provide an invaluable means <strong>of</strong> probing the IGM.<br />
0
– 4 –<br />
1.2. Possible Pulse Source<br />
One <strong>of</strong> the most intriguing possible sources <strong>of</strong> the Lorimer Pulse can be found in a<br />
suggestion by Martin Rees in 1977 (9) that primordial black holes, evaporating via the<br />
Hawking Process, could release a large electromagnetic pulse <strong>of</strong> short duration. According<br />
to Hawking (2), a black hole <strong>of</strong> mass M emits radiation like a blackbody with a temperature<br />
T BH given by:<br />
T BH =<br />
( )<br />
c3<br />
8πkGM = M⊙<br />
10−6 K (3)<br />
M<br />
This radiation emanates from the black hole event horizon and comes completely from the<br />
black hole’s mass. For a non-accreting black hole, Stefan-Boltzmann yields a lifetime <strong>of</strong>:<br />
( ) 3 M<br />
τ BH = 10 10 years<br />
(4)<br />
10 12 kg<br />
For stellar mass black holes, this theory predicts lifetimes <strong>of</strong> order 10 34 years, much too long<br />
to ever expect to observe. However, some cosmologies predict the creation <strong>of</strong> numerous<br />
small (M ∼ 10 12 g) primordial black holes in the early universe, which according to theory<br />
should be evaporating now (3).<br />
<strong>The</strong> specific mechanism by which the evaporating black hole produces a strong radio<br />
pulse has not been fully elucidated, but in short, it is thought that the process is similar to<br />
the EMP that accompanies supernova explosions. In such a process, a highly conductive<br />
plasma fireball expanding into the ambient magnetic field <strong>of</strong> space can exclude the field and<br />
create an electromagnetic pulse. For typical values <strong>of</strong> the interstellar magnetic field, this<br />
pulse would be peaked near 1GHz (1).<br />
An observation <strong>of</strong> these pulses would not only provide a significant confirmation <strong>of</strong><br />
Hawking radiation, but would also give strong evidence <strong>of</strong> the existence <strong>of</strong> primordial black<br />
holes.
– 5 –<br />
1.3. <strong>The</strong> Allen Telescope Array<br />
<strong>The</strong> ATA is an ideal instrument to search for transient radio pulses. It provides<br />
the ability to cover a large fraction <strong>of</strong> the sky and also <strong>of</strong>fers the opportunity to easily<br />
search multiple frequency regimes via its tunable IF. In the nominal close pack hexagon<br />
configuration, ATA-42 can cover a total <strong>of</strong> 150 square degrees on the sky (at L-band).<br />
Although the Parkes-multibeam system used to discover the Lorimer Pulse has a<br />
much larger collecting area than ATA-42, the potential narrowness <strong>of</strong> the intrinsic pulse<br />
width may allow detection <strong>of</strong> a comparable pulse with a single ATA dish. <strong>The</strong> hardware<br />
used in the Parkes system could only limit the Lorimer Pulse width to 5 ms. If the pulse<br />
were narrower, which it may very well have been, and the instrument integration time<br />
commensurately shortened, a similar pulse could indeed be observed by an individual<br />
ATA-42 dish.<br />
Fig. 1.— Artists Rendition <strong>of</strong> ATA-42 in Fly’s <strong>Eye</strong> Pattern (Courtesy Joeri van Leeuwen)
– 6 –<br />
2. <strong>The</strong> Fly’s <strong>Eye</strong> Instrument System<br />
2.1. Preliminary Design Criteria<br />
In order to be able to detect a pulse <strong>of</strong> similar power to the Lorimer Pulse, we desired<br />
to attain a spectral integration time <strong>of</strong> no more than 1 millisecond. It was also desired to<br />
be able to utilize at least one polarization for each <strong>of</strong> the 42 antennas currently in place<br />
at the ATA. We were also constrained (on a per-spectrometer-basis) by the available 209.5<br />
MHz bandwidth provided by the ATA IF system. <strong>The</strong> final short-list called for computing<br />
auto-correlations on approximately 128 spectral channels over a bandwidth <strong>of</strong> at least<br />
100MHz for at least 42 separate IFs. It was planned to perform de-dispersion and threshold<br />
calculations subsequently using a workstation cluster.<br />
2.2. <strong>CASPER</strong>-Based Design<br />
2.2.1. <strong>The</strong> <strong>CASPER</strong> Group<br />
<strong>The</strong> Center for Astronomy Signal Processing and Electronics Research (<strong>CASPER</strong>),<br />
seeks to speed the development <strong>of</strong> radio astronomy signal processing instrumentation by<br />
designing and demonstrating a scalable, upgradable, FPGA-based computing platform and<br />
s<strong>of</strong>tware design methodology that targets a range <strong>of</strong> real-time signal processing applications.<br />
To-date, <strong>CASPER</strong>-designed boards have been used for numerous beam-forming, correlation<br />
and spectroscopy projects all over the world, including the <strong>University</strong> <strong>of</strong> North Carolina’s<br />
PARI Observatory, Harvard/CfA’s SMA and the NASA/JPL Deep Space Network (DSN)<br />
(8).<br />
With the ready availability <strong>of</strong> <strong>CASPER</strong> hardware, and the author’s familiarity with<br />
the <strong>CASPER</strong> toolflow, selection <strong>of</strong> <strong>CASPER</strong> hardware for the Fly’s <strong>Eye</strong> Instrument was
– 7 –<br />
an easy decision. Additionally, rapid construction <strong>of</strong> the system could be facilitated by the<br />
numerous existing <strong>CASPER</strong> instrument designs similar to the proposed Fly’s <strong>Eye</strong> System.<br />
2.3. FPGA Hardware<br />
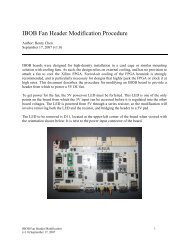
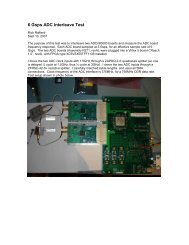
<strong>The</strong> core <strong>of</strong> the Fly’s <strong>Eye</strong> Instrument is made up <strong>of</strong> eleven <strong>CASPER</strong> Internet Break<br />
Out Boards (IBOBs Fig. 2) each <strong>of</strong> which is connected to two <strong>CASPER</strong> iADCs via the<br />
IBOB Z-DOK interface.<br />
Fig. 2.— <strong>CASPER</strong> Internet Breakout Board and ADCs<br />
In addition to the Z-DOK interface, each IBOB provides two CX4 connectors, a<br />
10/100 Mb Ethernet interface and a RS-232 serial connection. <strong>The</strong> computation engine <strong>of</strong><br />
each IBOB board is a Xilinx XC2VP50 FPGA which provides 232 18x18-bit multipliers,<br />
two PowerPC CPU cores and over 53,000 logic cells. In addition to the FPGA, the<br />
board includes 36Mbit <strong>of</strong> on-board ZBT SRAM. Fig. 3 shows a block diagram <strong>of</strong> IBOB<br />
components.<br />
Each <strong>of</strong> the iADCs contains an Atmel AT84AAD001B dual 8-bit ADC chip, capable <strong>of</strong><br />
simultaneously digitizing two analog streams at 1 Gsample/sec.
– 8 –<br />
Fig. 3.— IBOB Block Diagram, Courtesy <strong>of</strong> UC <strong>Berkeley</strong> SETI Group<br />
2.4. FPGA Gateware<br />
Each <strong>of</strong> the eleven IBOB / iADC systems in the Fly’s <strong>Eye</strong> processes 4 <strong>of</strong> the 44 total<br />
inputs to the instrument. Four parallel time samples per input, acquired at four times the<br />
FPGA clock rate (838.8608 MHz), are passed from the ADC to a digital down converter<br />
where the signal is mixed at 209.7152 MHz and then low-passed filtered to a bandwidth<br />
equal to 209.7152 MHz. <strong>The</strong> signal is then decimated to a sample rate equal to 209.7152<br />
MHz. <strong>The</strong> resultant signal is complex, 8 bits I and 8 bits Q, representing the signals from<br />
104.8576 MHz to 314.5728 MHz.<br />
<strong>The</strong> down converted and decimated digitized data is passed into a Polyphase Filter<br />
Bank (PFB) / Fast Fourier Transform logic block which together implements a 128 point 4<br />
tap Polyphase Filter Bank on each <strong>of</strong> the 4 inputs (labeled internally as A, B, C, D). <strong>The</strong><br />
frequency domain data is then passed into an equalization block which can selectively allow<br />
each frequency channel to be scaled by an individual coefficient. This allows a non-flat<br />
passband to be flattened digitally and provides for dynamic gain control over the pre-power
– 9 –<br />
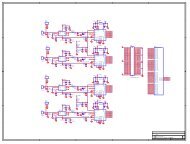
spectra. A schematic diagram <strong>of</strong> the Fly’s <strong>Eye</strong> signal path is shown in Fig. 4.<br />
2.5. Instrument Operating System<br />
Individual IBOBs in the Fly’s <strong>Eye</strong> Instrument use a highly modified version <strong>of</strong><br />
the open-source TinySH operating system for debug and testing (11). <strong>The</strong> TinySH<br />
interface is accessible via a telnet server running on each IBOB. TinySH allows probing<br />
<strong>of</strong> FPGA-PowerPC shared memory regions, access to network configuration information<br />
and execution <strong>of</strong> a variety <strong>of</strong> debug commands. Scripted operation <strong>of</strong> the instrument<br />
(i.e. boot-up sequences) is accomplished by automated interaction with the TinySH<br />
interface. Equalized spectra from each <strong>of</strong> the four inputs are passed into individual 64 bit<br />
A<br />
ADC<br />
DDC<br />
PFB/<br />
FFT<br />
Accumulation<br />
B<br />
ADC<br />
DDC<br />
PFB/<br />
FFT<br />
Accumulation<br />
Packetization<br />
C<br />
ADC<br />
DDC<br />
PFB/<br />
FFT<br />
Accumulation<br />
Out to Ethernet<br />
D<br />
ADC<br />
DDC<br />
PFB/<br />
FFT<br />
Accumulation<br />
Fig. 4.— Fly’s <strong>Eye</strong> signal path schematic diagram.<br />
accumulators, where spectral values are accumulated for a period <strong>of</strong> time given by the value<br />
<strong>of</strong> an accumulation counter s<strong>of</strong>tware register.<br />
A non-standard and novel method was devised for storing accumulated spectra to
– 10 –<br />
allow individual byte-boundary octets <strong>of</strong> the accumulated values from each input to be<br />
output at high speed (∼ 7 Mb/sec.) Each 64-bit accumulation is split into 8 byte-boundary<br />
bytes, which are concatenated with corresponding bytes from other inputs into a 32 bit<br />
word and stored, in channel order, in one <strong>of</strong> eight BRAMs See Fig. 5. This allows 8-bit<br />
resolution spectra to be read contiguously by the FPGA’s integrated PowerPC processor,<br />
nearly cutting in half the minimum accumulation time. For temporally narrow signals (less<br />
than our minimum accumulation length), this effectively doubles our observed SNR.<br />
A bits 0-7 A bits 8-15 A bits 16-23 A bits 24-31 A bits 32-39 A bits 40-47 A bits 48-55 A bits 56-63<br />
Channel A 64 bits accumulation<br />
B bits 0-7 B bits 8-15 B bits 16-23 B bits 24-31 B bits 32-39 B bits 40-47 B bits 48-55 B bits 56-63<br />
Channel B 64 bits accumulation<br />
C bits 0-7 C bits 8-15 C bits 16-23 C bits 24-31 C bits 32-39 C bits 40-47 C bits 48-55 C bits 56-63<br />
Channel C 64 bits accumulation<br />
D bits 0-7 D bits 8-15 D bits 16-23 D bits 24-31 D bits 32-39 D bits 40-47 D bits 48-55 D bits 56-63<br />
Channel D 64 bits accumulation<br />
BRAM 0-8 BRAM 56-63<br />
A bits 0-7 B bits 0-7 C bits 0-7 D bits 0-7 Channel 0<br />
A bits 0-7 B bits 0-7 C bits 0-7 D bits 0-7 Channel 1<br />
....<br />
A bits 0-7 B bits 0-7 C bits 0-7 D bits 0-7 Channel 127<br />
....<br />
A bits 56-63 B bits 56-63 C bits 56-63 D bits 56-63 Channel 0<br />
A bits 56-63 B bits 56-63 C bits 56-63 D bits 56-63 Channel 1<br />
....<br />
A bits 56-63 B bits 56-63 C bits 56-63 D bits 56-63 Channel 127<br />
Fig. 5.— Byte arrangement system used in the Fly’s <strong>Eye</strong> Instrument to enable fast UDP<br />
data output.<br />
<strong>The</strong> complete top-level diagram for the Fly’s <strong>Eye</strong> gateware is depicted in Appendix<br />
Fig. 17.<br />
2.6. <strong>The</strong> Instrument System<br />
<strong>The</strong> eleven IBOB/ADC systems are housed in two modified rack-mountable<br />
CompactPCI chassis, 6 in chassis ‘ALPHA’ and 5 in chassis ‘ZULU.’ <strong>The</strong> cabling diagram<br />
for an individual IBOB is depicted in Fig. 6.<br />
At the conclusion <strong>of</strong> a spectra integration sequence, a user selectable byte-boundary<br />
8-bit portion <strong>of</strong> the accumulated spectra from each <strong>of</strong> the four channels on an individual
– 11 –<br />
Fig. 6.— IBOB Cabling Diagram, Courtesy <strong>of</strong> Matt Dexter, UCB RAL<br />
IBOB is packetized via the FPGA PowerPC processor and output using UDP protocol over<br />
the IBOB’s 10/100Mbit Ethernet port on a closed network. <strong>The</strong> packets from all eleven<br />
IBOBs are captured en masse on a single data collection machine. <strong>The</strong> total aggregate data<br />
rate for the entire system is approximately 7 Mb/sec x 11 IBOBs ∼ 80Mb/sec. High rate<br />
data capture and output to fixed disk is accomplished using an open-source tool, ‘gulp’<br />
(10), designed expressly for this purpose,.<br />
An additional network interface card on the data collection machine allows connection<br />
to a 12 Terabyte gigabit-network attached RAID system for medium term data storage.<br />
All critical components <strong>of</strong> the Fly’s <strong>Eye</strong> system are fed power through an Ethernet<br />
controlled power switch to enable remote power cycling and monitoring. Fig. 7 depicts a<br />
diagram <strong>of</strong> the complete Fly’s <strong>Eye</strong> System.
– 12 –<br />
IBOB Rack<br />
ALPHA<br />
g38 - g42<br />
IBOB Rack<br />
ZULU<br />
g43 - g47<br />
10/100/1000 Mb Ethernet Switch<br />
ATA-42<br />
2.0 GHz AMD Athlon<br />
Machine Name: "flytrap"<br />
1000 Mb Ethernet Switch<br />
Ethernet Controlled Power Strip<br />
Machine Name: "flypower"<br />
Dual G4 X-Serve<br />
Machine Name: "lord<strong>of</strong>theflies"<br />
1000 Mb Ethernet<br />
100 Mb Ethernet<br />
IP Controlled 110V AC Power<br />
ATA Analog IF<br />
Nexsan 10 TB Storage Array<br />
Volume: "jack"<br />
SCSI Control by lord<strong>of</strong>theflies<br />
Fig. 7.— Fly’s <strong>Eye</strong> Instrument System Schematic Diagram Not shown is remote power<br />
connection to ATA-42 Walsh Switching system.
– 13 –<br />
3. Preliminary Results<br />
3.1. Installation<br />
<strong>The</strong> Fly’s <strong>Eye</strong> Instrument was installed at the ATA on December 20, 2007. Fig. 8<br />
shows an image <strong>of</strong> the Fly’s <strong>Eye</strong> instrument installed in the ATA Correlator Room. At the<br />
time <strong>of</strong> installation, only 26 <strong>of</strong> the 42 built dishes were available. <strong>The</strong> best polarization<br />
<strong>of</strong> each <strong>of</strong> the 26 available dishes was connected to the Fly’s <strong>Eye</strong> instrument, with the<br />
remaining 18 inputs filled by the highest quality opposite polarization feeds. Although we<br />
had initially sought to use all 42 dishes, the opportunity to make polarization measurements<br />
<strong>of</strong> a candidate pulse is scientifically interesting in its own right.<br />
3.2. Diagnostic Sources<br />
To date, approximately six hours <strong>of</strong> Fly’s <strong>Eye</strong> observation time has been dedicated to<br />
observation <strong>of</strong> several bright pulsars, shown in Table 1. Our first attempts at data analysis<br />
have consisted <strong>of</strong> reconstituting each <strong>of</strong> the 44 individual IFs from the gulp-produced data<br />
files and performing folding analysis at barycentric corrected periods. Figs. 9 - 14 show<br />
images generated through folding analysis. Note, these images represent a composite sum<br />
<strong>of</strong> 36 polarizations 12 .<br />
On careful inspection, the well described triple peak pr<strong>of</strong>ile <strong>of</strong> PSR 0329+54 is visible<br />
in Figs. 9 - 11 (Seiradakis et al.). Dispersion pr<strong>of</strong>iles for pulsars PSR 0329+54 and PSR<br />
0950+08 are consistent with published values. Pulsars PSR 0355+54 and PSR 0450+55 are<br />
1 Only 36 polarizations were summed due to instrumental malfunction caused by inclement<br />
weather<br />
2 Amplitude scale is arbitrary
– 14 –<br />
Table 1: List <strong>of</strong> Bright Pulsars Observed as Diagnostic Sources a<br />
Name RAJ2000(hms) DECJ2000(dms) Period(s) DM(cm 3 pc) S1400(mJy)<br />
B0329+54 03:32:59.368 +54:34:43.57 0.7145 26.833 203<br />
B0355+54 03:58: 53.7165 +54:13:13.727 0.1563 57.1420 23<br />
B0450+55 04:54:07.709 +55:43:41.51 0.3406 14.495 13<br />
B0531+21 05:34:31.973 +22:00:52.06 0.0330 56.791 14<br />
B0950+08 09:53:09.3097 +07:55:35.75 0.2530 2.958 84<br />
B0329+54 03:32:59.368 +54:34:43.57 0.7145 26.833 203<br />
a Values from (7)<br />
not readily distinguishable in similarly produced images, likely owing to their much reduced<br />
flux.<br />
Appendix Fig. 18 shows a plot <strong>of</strong> averaged spectra for all 44 inputs to the Fly’s <strong>Eye</strong><br />
Instrument over a 18 minute observation <strong>of</strong> PSR 0329+54. <strong>The</strong> 21-cm line is clearly visible,<br />
as are moderate RFI features near the edge <strong>of</strong> the band.<br />
3.3. Proposed Analysis<br />
Analysis <strong>of</strong> the Fly’s <strong>Eye</strong> diagnostic data has increased our confidence in the Fly’s <strong>Eye</strong><br />
Instrument and enabled us to begin preparations for reducing the close to twenty hours <strong>of</strong><br />
observation data taken with the ATA antennas pointed in a close pack hexagon pattern.<br />
While all <strong>of</strong> the analysis presented here has been completed manually using in-house<br />
code, we expect to begin using the open-source SigProc (6) tools for exhaustive searches <strong>of</strong><br />
our hexagon-pattern data. Fig. 16 shows a proposed processing pipeline for our first-pass<br />
analysis.
– 15 –<br />
Fig. 8.— Fly’s <strong>Eye</strong> Instrument Installed in ATA Rack
– 16 –<br />
Fig. 9.— PSR 0329+54 Observation 1 - 18 Minutes Folded at Barycentric Corrected Period<br />
Fig. 10.— PSR 0329+54 Observation 2 - 18 Minutes Folded at Barycentric Corrected Period
– 17 –<br />
Fig. 11.— PSR 0329+54 Observation 3 - 18 Minutes Folded at Barycentric Corrected Period<br />
Fig. 12.— PSR 0450+55 - 18 Minutes Folded at Barycentric Corrected Period
– 18 –<br />
Fig. 13.— PSR 0355+54 - 18 Minutes Folded at Barycentric Corrected Period<br />
Fig. 14.— PSR 0950+08 - 18 Minutes Folded at Barycentric Corrected Period
– 19 –<br />
Fig. 15.— PSR 0329+54 Pulse Pr<strong>of</strong>ile at 1.4 GHz, Courtesy <strong>of</strong> (Seiradakis et al.)
– 20 –<br />
Raw gulp<br />
Datafile<br />
Error Analysis / Dropped<br />
Packet Correction<br />
IF Seperation<br />
IF 0 IF 1 IF 2 ....<br />
IF 43 IF SUM<br />
Average<br />
Computation<br />
.... ....<br />
Equalization /<br />
Normalization<br />
.... ....<br />
De-dispersion<br />
DM 0<br />
De-dispersion<br />
DM 1<br />
De-dispersion<br />
DM 2<br />
....<br />
De-dispersion<br />
DM 1000<br />
.... .... ....<br />
Frequency<br />
Collapse<br />
Compute RMS /<br />
Threshold<br />
Log Candidate<br />
Pulses<br />
Decimate<br />
Disk<br />
Fig. 16.— Proposed Analysis Pipeline for Close-Pack Hexagon Data
– 21 –<br />
Acknowledgments<br />
<strong>The</strong> Fly’s <strong>Eye</strong> Experiment benefited enormously from the generous assistance and<br />
advice <strong>of</strong>fered by a number <strong>of</strong> people, including Don Backer (UCB Astronomy, RAL,<br />
<strong>CASPER</strong>), Colby Craybill (RAL), Matt Dexter (RAL, <strong>CASPER</strong>), David McMahon (RAL,<br />
<strong>CASPER</strong>) and Mel Wright (UCB Astronomy, RAL, <strong>CASPER</strong>.)<br />
Instrument installation was gracefully shepherded by the entire ATA staff, especially<br />
Rick Forster.<br />
<strong>The</strong> original idea for the Fly’s <strong>Eye</strong> Experiment was suggested by Jim Cordes (Cornell<br />
<strong>University</strong>)<br />
My own involvement in the Fly’s <strong>Eye</strong> project and the UC <strong>Berkeley</strong> Undergraduate<br />
Honors Program would not have been possible without the patient tutelage I have been<br />
honored to receive from both Mr. Dan Werthimer and Pr<strong>of</strong>essor Ge<strong>of</strong>f Marcy.<br />
Pr<strong>of</strong>essor Ge<strong>of</strong>f Marcy is and has been an incredible advisor and friend. Our many<br />
discussions regarding life, love and the pursuit <strong>of</strong> astronomical awareness have been<br />
wonderfully enlightening.<br />
Dan Werthimer is and has been a brilliant and fantastic research supervisor and friend.<br />
I am utterly humbled to have had the opportunity to work so closely with him and the<br />
SETI and <strong>CASPER</strong> research groups.<br />
Part <strong>of</strong> this research has made use <strong>of</strong> the data base <strong>of</strong> published pulse pr<strong>of</strong>iles<br />
maintained by the European Pulsar Network, available at: http://www.mpifrbonn.mpg.de/pulsar/data/<br />
Financial support for this research has been provided, in-part, by the Josephine de<br />
Karman Fellowship Trust
– 22 –<br />
A. Appendix material
This design is set for a maximum<br />
clock rate <strong>of</strong> 210 MHz (sampling<br />
from the ADCs at 800 Mxps). It<br />
runs on an IBOB with 2 ADC boards,<br />
and uses ModelSim to simulate an<br />
SRAM interface.<br />
ModelSim<br />
MSSGE<br />
xlhdlcosim<br />
System XSG core config<br />
ModelSim<br />
Generator<br />
IBOB<br />
LWIP<br />
ibob_lwip<br />
Four parallel time samples (acquired at 4x the<br />
FPGA clk rate) are passed from the ADC to the<br />
Digital Down Converter, where the signal is mixed<br />
at 1/4 <strong>of</strong> the ADC clock rate (200 MHz if sampling<br />
at 800 Msps), and then low-pass filtered to a<br />
bandwidth <strong>of</strong> 1/4 the ADC clock rate, and decimated<br />
to a sample rate <strong>of</strong> 1/4 the ADC clock rate. <strong>The</strong><br />
resultant signal is 8 bits I, 8 bits Q, representing the<br />
band <strong>of</strong> signals from 1/8 the ADC clock rate to<br />
3/8 the ADC clock rate (100 MHz to 300 MHz at<br />
800 Msps).<br />
Out1<br />
din1<br />
Out2<br />
din2 dout<br />
[ant1_pol1_adc] In1<br />
Out3<br />
din3<br />
Out4<br />
din4<br />
sync_out<br />
decat [sync_adc] sync_in<br />
DDC0_0<br />
Out1<br />
din1<br />
<strong>The</strong> "pfb_fir" and "fft" blocks together implement a 128 point,<br />
4 tap Polyphase Filter Bank. Between the two blocks, a "downshift"<br />
divides the output <strong>of</strong> the "pfb_fir" by 8 so that the first 2 stages <strong>of</strong><br />
the FFT cannot overflow (see FFT documenation for details on why<br />
this is necessary). Because the effective signal resolution out <strong>of</strong><br />
the "pfb_fir" is 8 bits, we are free to choose the placement <strong>of</strong><br />
these 8 bits within the 18 bits <strong>of</strong> the FFT without adversely affecting<br />
our signal. However, one should avoid placing the signal in the LSB<br />
<strong>of</strong> the FFT word because <strong>of</strong> rounding effects. Thus, we downshift<br />
only 3 bits.<br />
sync sync_out<br />
sync<br />
shift<br />
pol1_in1 pol1_out1 din dout<br />
downshift pol0<br />
sync_out<br />
out0<br />
[sync_ant1_fft]<br />
[ant1_pol1_fft]<br />
0<br />
[ant12_pol12_rnd]<br />
sim_in<br />
x_config<br />
reg_in<br />
acc_phs: bits 0-10<br />
acc_len: bits 16-18<br />
cross_bit_sel: bits 24-25<br />
[sync_rnd]<br />
xlslice [a:b]<br />
xlslice [a:b]<br />
xlslice [a:b]<br />
xlslice [a:b]<br />
xlslice [a:b]<br />
xlslice [a:b]<br />
This is the "<strong>Fly's</strong> <strong>Eye</strong>" specific portion. 64 total bits are accumulated from each auto-correlation,<br />
but 8 bit octets from each <strong>of</strong> the four input streams are concatenated and stored as 32-bit words in blockrams<br />
labeled 0-7, 8-15, 16-23.....56-63. This allows very rapid<br />
data dumps over 100Mbit ethernet <strong>of</strong> all four input streams at 8bit resolution.<br />
sync<br />
new_acc<br />
acc_len<br />
acc_len<br />
[OnePPS]<br />
a<br />
b<br />
c<br />
d<br />
new_acc<br />
dir_x<br />
rst<br />
en<br />
out<br />
Counter<br />
reg_out<br />
acc_num<br />
sim_out<br />
Band-Limited<br />
White Noise<br />
sim_i<br />
i0<br />
i1<br />
i2<br />
i3<br />
In1<br />
In2<br />
Out1<br />
In3<br />
In4<br />
[ant1_pol1_adc]<br />
[ant1_pol2_adc]<br />
Out2<br />
In1<br />
Out3<br />
Out4<br />
decat1 [sync_adc]<br />
din2 dout<br />
din3<br />
din4<br />
sync_out<br />
sync_in<br />
DDC0_1<br />
pol2_in1 pol2_out1<br />
pfb_fir<br />
[fft_shift]<br />
din dout<br />
downshift1<br />
pol1<br />
fft<br />
out1<br />
[ant1_pol2_fft]<br />
<strong>The</strong> "equalizer" allows each frequency channel <strong>of</strong> the<br />
FFT to be scaled by a different number. This allows passbands which are<br />
not flat to be flattened digitally to allow for optimal quantization to 4 bits.<br />
<strong>The</strong>se coefficients can also be updated dynamically for gain control.<br />
in<br />
out<br />
pulse_ext3<br />
gpio_out<br />
led_new_acc<br />
sim_out<br />
Sine Wave<br />
0<br />
1<br />
q0 In1<br />
q1 In2<br />
Out1<br />
sim_q<br />
q2 In3<br />
q3 In4<br />
out<strong>of</strong>rangei0<br />
out<strong>of</strong>rangei1<br />
out<strong>of</strong>rangeq0<br />
sim_sync<br />
out<strong>of</strong>rangeq1<br />
sync0<br />
sync1<br />
xllogical or<br />
sync2<br />
sim_data_valid<br />
z -1<br />
sync3<br />
data_valid Logical3<br />
adc0<br />
[ant1_pol2_adc]<br />
[ant2_pol1_adc]<br />
[ant2_pol2_adc]<br />
Out1<br />
Out2<br />
In1<br />
Out3<br />
Out4<br />
decat2 [sync_adc]<br />
Out1<br />
Out2<br />
In1<br />
Out3<br />
Out4<br />
decat3 [sync_adc]<br />
din1<br />
din2 dout<br />
din3<br />
din4<br />
sync_out<br />
sync_in<br />
DDC0_2<br />
din1<br />
din2 dout<br />
din3<br />
din4<br />
sync_out<br />
sync_in<br />
DDC0_3<br />
sync sync_out<br />
pol1_in1 pol1_out1<br />
pol2_in1 pol2_out1<br />
pfb_fir1<br />
[fft_shift]<br />
z -2<br />
din dout<br />
downshift2<br />
din dout<br />
downshift3<br />
sync<br />
shift<br />
pol0<br />
pol1<br />
fft1<br />
sync_out<br />
out0<br />
out1<br />
[ant2_pol1_fft]<br />
[ant2_pol2_fft]<br />
[ant1_pol1_fft]<br />
[ant1_pol2_fft]<br />
[ant2_pol1_fft]<br />
[ant2_pol2_fft]<br />
[sync_ant1_fft]<br />
[coeff]<br />
[coeff_en]<br />
[coeff_addr]<br />
a1p1<br />
a1p2<br />
a2p1<br />
a2p2<br />
sync<br />
coeff<br />
coeff_we<br />
coeff_addr<br />
equalizer<br />
dout<br />
sync_out<br />
[ant12_pol12_rnd]<br />
[sync_rnd]<br />
"acc_num" is a counter that is<br />
incremented every new accumulation.<br />
This allows a computer to know when<br />
a new accumulation is available.<br />
– 23 –<br />
sim_i<br />
sim_q<br />
sim_sync<br />
sim_data_valid<br />
adc1<br />
i0<br />
i1<br />
i2<br />
i3<br />
q0<br />
q1<br />
q2<br />
q3<br />
out<strong>of</strong>rangei0<br />
out<strong>of</strong>rangei1<br />
out<strong>of</strong>rangeq0<br />
out<strong>of</strong>rangeq1<br />
sync0<br />
sync1<br />
sync2<br />
sync3<br />
data_valid<br />
To provide a means for measuring the magnitude <strong>of</strong> the signals<br />
coming in to each ADC channel, we have a "calc_adc_sum_sq"<br />
block which uses a single multiplier and a regsiter to calculate<br />
the sum <strong>of</strong> the square <strong>of</strong> 2^16 samples. To do this with one<br />
multiplier, only a single sample <strong>of</strong> the 4 provided is used<br />
per clock, and then different samples are used each clock (in<br />
a non-periodic order) to avoid favoring certain frequencies.<br />
Of the output 32 bits, 16 represent "whole bits", and 16<br />
are sub-bit resolution.<br />
[input_sel]<br />
[ant1_pol1_adc]<br />
[ant1_pol2_adc]<br />
[ant2_pol1_adc]<br />
[ant2_pol2_adc]<br />
sel<br />
d0<br />
xlmux<br />
d1<br />
z -2<br />
d2<br />
d3<br />
In1<br />
In1<br />
In2<br />
In3<br />
In4<br />
In1<br />
In2<br />
In3<br />
In4<br />
Out1<br />
Out2<br />
Out3<br />
Out4<br />
decat4<br />
Out1<br />
Out1<br />
xllogical or<br />
z -1<br />
Logical4<br />
[ant2_pol1_adc]<br />
[ant2_pol2_adc]<br />
In1<br />
In2<br />
In3<br />
In4<br />
[sync_rst]<br />
sum_sq<br />
calc_adc_sum_sq<br />
reg_out<br />
xllogical or<br />
z -1<br />
adc_sum_sq<br />
sim_out<br />
gpio_out<br />
rst sync<br />
sync_gen<br />
led_1pps<br />
[OnePPS]<br />
sim_out<br />
fpt<br />
dbl<br />
Gateway Out<br />
[sync_adc]<br />
Scope<br />
This, the "control" portion <strong>of</strong> the design, uses<br />
32 bits <strong>of</strong> "eq_coeff" to program the equalization<br />
coefficients, and 32 bits <strong>of</strong> "ctrl" to set fft shifting<br />
and choose which ADC to use for calculating<br />
input power (see "adc_sum_sq").<br />
eq_coeff: bits 0-16<br />
1<br />
coeff_en: bit 17<br />
coeff_addr: bits 20-30 Constant5<br />
1<br />
fft_shift: bits 0-15<br />
sync_rst: bit 16<br />
arm_rst: bit 17<br />
use_fft_tvg: bit 18<br />
65535<br />
Constant18<br />
z -2 z -1<br />
sim_in<br />
sim_in<br />
eq_coeff<br />
ctrl_sw<br />
Coefficients can be dynamically written into the "equalizer" by<br />
specifying the channel ("coeff_addr") and the value <strong>of</strong> the<br />
coefficient ("coeff"), and then using "coeff_en" to write the<br />
new coefficient into the equalization table. In this design,<br />
this can be done either through the "eq_coeff" s<strong>of</strong>tware<br />
register, or through the XAUI.<br />
reg_in<br />
reg_in<br />
xlslice [a:b]<br />
xlslice [a:b]<br />
xlslice [a:b]<br />
xlslice [a:b]<br />
xlslice [a:b]<br />
xlslice [a:b]<br />
xlslice [a:b]<br />
xlslice [a:b]<br />
xlslice [a:b]<br />
llogica and<br />
[input_sel]<br />
[use_sram_tvg]<br />
[use_fft_tvg]<br />
[arm_rst]<br />
[sync_rst]<br />
[fft_shift]<br />
[coeff]<br />
[coeff_en]<br />
[coeff_addr]<br />
fpt dbl<br />
Gateway Out2<br />
fpt dbl<br />
Gateway Out1<br />
fpt dbl<br />
Gateway Out3<br />
fpt dbl<br />
Gateway Out4<br />
fpt dbl<br />
Gateway Out5<br />
fpt dbl<br />
Gateway Out6<br />
Scope1<br />
Fig. 17.— Top-level FPGA Gateware Diagram
– 24 –<br />
Fig. 18.— 44 Averaged Spectra from 18 Minute PSR 0329+54 Observation
– 25 –<br />
REFERENCES<br />
Blandford, R. D. 1977, “Spectrum <strong>of</strong> a radio pulse from an exploding black hole,” MNRAS,<br />
181, 489<br />
Hawking, S. W. 1974, Nature, 248, 30<br />
Hawking, S. W. 1971, ”Gravitationally collapsed objects <strong>of</strong> very low mass,” MNRAS, 152,<br />
75<br />
S. R. Kulkarni, E. O. Ofek, J. D. Neill, M. Juric & Z. Zheng, ”Giant Sparks at Cosmological<br />
Distances?” pre-print, http://www.astro.caltech.edu/ srk/sparker.pdf<br />
Lorimer, D. R., Bailes, M., McLaughlin, M. A., Narkevic, D. J., and Crawford, F. 2007,<br />
ArXiv e-prints, 709<br />
D. R. Lorimer SIGPROC pulsar data analysis tools available online at<br />
http://sigproc.sourceforge.net.<br />
Manchester, R. N., Hobbs, G. B., Teoh, A. & Hobbs, M., AJ, 129, 1993-2006 (2005),<br />
http://www.atnf.csiro.au/research/pulsar/psrcat/<br />
Aaron Parsons, Donald Backer, Chen Chang, Daniel Chapman, Henry Chen, Patrick<br />
Crescini, Christina de Jesus, Chris Dick, Pierre Droz, David MacMahon, Kirsten<br />
Meder, Jeff Mock, Vinayak Nagpal, Borivoje Nikolic, Arash Parsa, Brian Richards,<br />
Andrew Siemion, John Wawrzynek, Dan Werthimer & Mel Wright, 2005,<br />
“PetaOp/Second FPGA Signal Processing for SETI and Radio Astronomy, Asilomar<br />
Conference on Signals, Systems and Computers, November 2006<br />
Rees, M. J. 1977, “A Better Way <strong>of</strong> Searching for Black-Hole Explosions?” Nature, 266, 333<br />
Satten, Corey 2007, “Lossless Gigabit Remote Packet Capture With Linux,”<br />
http://staff.washington.edu/corey/gulp/
– 26 –<br />
Seriadakis, J. H., Gil, J. A., Graham, D. A. Jessnet, A., Kramer, M., Mal<strong>of</strong>eev, V. M.,<br />
Sieber, W. & Wielebinski, R., 1995. Pulsar pr<strong>of</strong>iles at high frequencies. I. <strong>The</strong> data.<br />
Astro. Astrophys. Suppl. Ser. 111, 205<br />
Siemion, A. & Chapman, D. 2007, “TinySH Video Lecture Series,”<br />
http://casper.berkeley.edu/documentation<br />
This manuscript was prepared with the AAS L A TEX macros v5.2.