Dabur India Ltd - Dabur India Limited
Dabur India Ltd - Dabur India Limited
Dabur India Ltd - Dabur India Limited

Create successful ePaper yourself
Turn your PDF publications into a flip-book with our unique Google optimized e-Paper software.
<strong>Dabur</strong> <strong>India</strong> <strong>Ltd</strong><br />
Corporate Profile<br />
June, 2011<br />
1<br />
1
Agenda<br />
<strong>Dabur</strong> <strong>India</strong>-Introduction<br />
FMCG Industry Scenario<br />
Business Overview<br />
Growth Strategy<br />
Recent Performance<br />
2<br />
2
<strong>Dabur</strong> <strong>India</strong>: Overview<br />
Established in 1884 - more than 125<br />
Years of Trust & Excellence<br />
<br />
<br />
<br />
<br />
<br />
Among top 4 FMCG companies in <strong>India</strong><br />
World’s largest in Ayurveda and natural<br />
healthcare<br />
Revenue of Rs. 41.1 billion and profits of<br />
Rs. 5.7 billion in FY2010-11<br />
Strong brand equity<br />
<br />
<br />
<strong>Dabur</strong> is a household brand<br />
Vatika and Real are Superbrands<br />
<br />
Hajmola , Real & <strong>Dabur</strong> ranked among<br />
<strong>India</strong>’s Most Admired Brands<br />
11 Brands with sales of over Rs. 1 billion<br />
each<br />
Wide distribution network covering 2.8<br />
million retailers across the country<br />
<br />
17 world class manufacturing plants<br />
catering to needs of diverse markets<br />
Strong overseas presence with 22%<br />
contribution to consolidated sales<br />
<strong>Dabur</strong> ranked<br />
200 in the<br />
Fortune <strong>India</strong><br />
500 list<br />
Eleven Billion Rupee Brands<br />
<strong>Dabur</strong> moves<br />
up to take the<br />
78th spot in the<br />
Super-100 list,<br />
released by<br />
Business <strong>India</strong><br />
<strong>Dabur</strong> ranked<br />
among Most<br />
Trusted Brands in<br />
<strong>India</strong>, according to<br />
Brand Trust<br />
Report, <strong>India</strong><br />
Study, 2011<br />
3<br />
3
<strong>Dabur</strong>: Vision and Core Values<br />
Vision<br />
•Dedicated to the health and well being of every household<br />
Ownership<br />
Integrity<br />
Passion for<br />
Winning<br />
Innovation<br />
Core<br />
Values<br />
People<br />
Development<br />
Team Work<br />
Consumer<br />
Focus<br />
4<br />
4
Key Milestones<br />
1884<br />
•Dr. SK Burman<br />
started an Ayurvedic<br />
Pharmacy in Kolkatta<br />
1972<br />
•The company<br />
shifted base to<br />
Delhi from Kolkata<br />
1986<br />
•Registered as<br />
Public <strong>Limited</strong><br />
Company<br />
1994<br />
•Listed on the<br />
Bombay Stock<br />
Exchange<br />
1998<br />
•Professionalized with<br />
Burman Family handing<br />
over day to<br />
management<br />
2003<br />
•Pharmaceutical Business<br />
de-merged d to focus on core<br />
FMCG business<br />
2004<br />
•International<br />
Business set up in<br />
Dubai to tap overseas<br />
opportunity<br />
2005<br />
•Acquired Balsara<br />
strengthening Oral<br />
care & gaining entry<br />
into Home care<br />
2006<br />
•<strong>Dabur</strong> Figured in Top<br />
10 Great Places To<br />
Work<br />
2008<br />
•Acquired Fem Care<br />
Pharma entering<br />
mainstream Skin care<br />
2010<br />
• Overseas acquisitions -<br />
Hobi Group, Turkey and<br />
Namaste Laboratories, US<br />
2011<br />
•Crossed Rs. 40 bn<br />
mark in annual<br />
revenues and Market<br />
Cap of US$4 billion<br />
5<br />
5
<strong>Dabur</strong> Consolidated : Overview<br />
in Rs. million<br />
Sales<br />
45000<br />
40000<br />
35000<br />
30000<br />
25000<br />
20000<br />
15000<br />
10000<br />
5000<br />
0<br />
12,004 12,849 12,356<br />
28,341<br />
17,565<br />
20,803<br />
23,963<br />
14,170 34,158 41,099<br />
FY02 FY03 FY04^ FY05 FY06* FY07 FY08 FY09 FY10** FY11^^<br />
EBITDA Margin (in %)<br />
Net Profit<br />
in %<br />
in Rs. million<br />
22.0%<br />
20.0%<br />
18.0%<br />
16.0%<br />
14.0%<br />
12.0%<br />
10.0%<br />
19.8% 19.9%<br />
17.1% 18.1% 18.5% 18.3%<br />
15.3%<br />
13.3% 3%<br />
FY04 FY05 FY06 FY07 FY08 FY09 FY10 FY11<br />
6000<br />
5000<br />
4000<br />
3000<br />
2000<br />
1000<br />
0<br />
5,686<br />
5,032<br />
3,913<br />
2817 2,817<br />
3329 3,329<br />
2,142<br />
1,065<br />
1,558<br />
FY04 FY05 FY06 FY07 FY08 FY09 FY10 FY11<br />
^Sales show a decline in FY04 on account of de-merger of Pharma business<br />
*Balsara acquisition added 10% to topline in FY06<br />
** Fem acquisition added 3.5% to topline in FY10<br />
^^Hobi and Namaste acquisitions added 4% to topline in FY11<br />
6<br />
6
Global Footprint<br />
UK<br />
Canada<br />
Turkey<br />
U.S.<br />
Egypt<br />
UAE<br />
Nepal<br />
B’Desh<br />
Nigeria<br />
Domestic Mfg.<br />
Locations<br />
Key markets<br />
Manufacturing Facilities<br />
Our strategy is to localize manufacturing, supply chain<br />
and product offerings to suit consumer requirements<br />
in each geography<br />
7<br />
7
Robust Distribution Network<br />
Factory<br />
C&FA<br />
(Carry & Forward Agents)<br />
Stockist Super Stockist Institutions<br />
& Modern<br />
trade<br />
Wholesalers<br />
Sub Stockist<br />
RETAIL TRADE<br />
CONSUMERS<br />
Direct + Indirect Reach covering 2.8 Mn Retail Outlets<br />
8<br />
8
Research & Development Focus<br />
Team of scientists including<br />
Ayurvedic doctors, Pharmacists,<br />
Agronomists, Botanists, Tissue<br />
Culture specialists, etc.<br />
Strong New Product Development<br />
Ayurvedic Medicines<br />
Personal Care<br />
<br />
Foods<br />
Agro Biotech Initiatives<br />
<br />
<br />
Home Care<br />
OTC Healthcare<br />
<br />
<br />
<br />
<br />
Protecting endangered herbs<br />
Technical assistance to farmers<br />
Contract cultivation of herbs<br />
Green House at Nepal<br />
<strong>Dabur</strong> introduced more than 20 new<br />
products/variants during FY11<br />
<strong>Dabur</strong> Research Facilities<br />
Agronomy Initiatives : Greenhouse at<br />
<strong>Dabur</strong> Nepal & Uttaranchal<br />
9<br />
9
Agenda<br />
<strong>Dabur</strong> <strong>India</strong>-Introduction<br />
FMCG Industry Scenario<br />
Business Overview<br />
Growth Strategy<br />
Recent Performance<br />
10<br />
10
FMCG Industry Snapshot<br />
Key Highlights<br />
• FMCG industry size at US$30 billion in<br />
CY10 and expected to grow to US$74<br />
billion in 2018*<br />
• Industry has grown at 15% in CY10<br />
• Rural sector accounts for about 33% of<br />
total revenue; growing faster than<br />
urban<br />
• Of the entire FMCG sector, Food is<br />
52%, Non-Food at 45% and OTC 3%<br />
FMCG Growth : Urban & Rural<br />
1,600.00<br />
1,400.00<br />
1,200.00<br />
1,000.00<br />
800.00<br />
600.00<br />
400.00<br />
200.00<br />
0.00<br />
in Rs. billion<br />
FMCG Industry Size (<strong>India</strong>)<br />
1,339<br />
1,161<br />
1,024 856<br />
755<br />
CY06 CY07 CY08 CY09 CY10<br />
Source: AC Nielsen<br />
FMCG Split: OTC, Food and Non-Food<br />
20%<br />
15%<br />
10%<br />
5%<br />
0%<br />
-5%<br />
16%<br />
15%<br />
18%<br />
12%<br />
11%<br />
10%<br />
9%<br />
12%<br />
12%<br />
10%<br />
3%<br />
1%<br />
-1%<br />
CY03 CY04 CY05 CY06 CY07 CY08 CY09<br />
-8%<br />
140,000<br />
120,000<br />
100,000<br />
80,000000<br />
60,000<br />
40,000<br />
20,000<br />
Rs. Crores<br />
82,615<br />
4<br />
48<br />
48<br />
128,580<br />
116,053 3<br />
(11%)<br />
4<br />
97,276<br />
(14%)<br />
4<br />
(10 %)<br />
45 (8%)<br />
46<br />
(19%)<br />
46 (14 %)<br />
52<br />
(20 %)<br />
(14 %)<br />
50<br />
50 (22%)<br />
OTC PRODUCTS<br />
Non‐Food<br />
Food Products<br />
-10% Urban Rural<br />
0<br />
MAT Sep'07 MAT Sep'08 MAT Sep'09 MAT Sep''10<br />
Source: AC Nielsen<br />
Source: AC Nielsen<br />
11<br />
11
FMCG Growth Story<br />
<strong>India</strong> FMCG Sector – Volume and Value Growth Rate (Y-o-Y %)<br />
High Growth Phase<br />
Source: Industry data, Standard Chartered Research<br />
<br />
<br />
<br />
<strong>India</strong>’s FMCG sector reported steady sales CAGR of 11.2% over FY00-10 on the<br />
back of strong annual volume growth of ~8.5%.<br />
Growth being driven by increasing consumption led by rise in incomes, changing<br />
lifestyles and favorable demographics<br />
FMCG industry expected to grow in mid to high teens going ahead<br />
12<br />
12
Penetration Levels: Sufficient Headroom<br />
90%<br />
Rural Penetration<br />
Urban Penetration<br />
80%<br />
77%<br />
80%<br />
70%<br />
67%<br />
60%<br />
57%<br />
59%<br />
50%<br />
42%<br />
40%<br />
37%<br />
32%<br />
30%<br />
26%<br />
20%<br />
18% 18%<br />
19%<br />
10%<br />
5%<br />
3% 2%<br />
4%<br />
0%<br />
Toothpaste Shampoo Hair Oil Skin Cream Mosquito<br />
Repellants<br />
Instant<br />
Noodles<br />
Hair Dyes<br />
Floor Cleaners<br />
Source: Industry Data<br />
Low penetration levels offer room for growth across consumption categories<br />
Rural penetration catching up with urban penetration levels<br />
13<br />
13
Per Capita Consumption: Room for Growth<br />
<strong>India</strong> has low per capita consumption as compared to other emerging economies<br />
Skin Care – Per Capita Consumption (in US$) Shampoo – Per Capita Consumption (in US$)<br />
in US$<br />
in US$<br />
9 3<br />
27 2.7<br />
7.4 77 7.7<br />
8<br />
7<br />
2.5<br />
2.4<br />
6<br />
2<br />
5<br />
4<br />
3<br />
3.2<br />
1.5<br />
1<br />
1.0 1.1<br />
2<br />
1<br />
0.8<br />
0.3<br />
0.5<br />
0.3<br />
0<br />
0<br />
China Indonesia <strong>India</strong> Malaysia Thailand<br />
China Indonesia <strong>India</strong> Malaysia Thailand<br />
Toothpaste – Per Capita Consumption (in US$)<br />
in US$<br />
3.5<br />
3<br />
2.9<br />
2.5<br />
2<br />
20 2.0<br />
1.5<br />
1<br />
0.5<br />
0.5<br />
1.0<br />
0.4<br />
0<br />
China Indonesia <strong>India</strong> Malaysia Thailand<br />
Source: MOSL<br />
14<br />
14
Key Players: FMCG<br />
in US$ million<br />
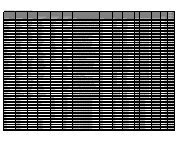
Company Key Categories Sales Profit Market Cap<br />
Hindustan Unilever <strong>Ltd</strong><br />
Nestle <strong>India</strong> <strong>Ltd</strong>*<br />
Soaps, Detergents, Personal<br />
Care, Foods<br />
Food, Beverages, Infant<br />
nutrition<br />
4,376 510 15,457<br />
1,390 182 8,341<br />
<strong>Dabur</strong> <strong>India</strong> <strong>Ltd</strong><br />
Personal, Health &<br />
Homecare, Foods<br />
913 126 4,447<br />
Godrej Consumer Hair Care, Soaps 828 114 3,040<br />
Colgate Palmolive (I)<br />
<strong>Ltd</strong>*<br />
Oral Care & Toiletries 493 89 2,753<br />
Glaxo Smithkline<br />
Consumer*<br />
Consumer Health Care 512 67 2,276276<br />
Marico <strong>Ltd</strong>. Hair care, Food, Skincare 695 64 1,928<br />
Procter & Gamble<br />
Hygiene and Health<br />
Care^<br />
Feminine Hygiene, personal<br />
care<br />
203 40 1,395<br />
Britannia Industries <strong>Ltd</strong>* Biscuits 1,023 30 1,256<br />
Source: Published results for year ending 31.03.11<br />
*Year ending 31.12.10<br />
^Year ending 30.06.09<br />
Note: Market Cap. as of June 21, 2011<br />
15<br />
15
<strong>Dabur</strong>: Strong Presence in FMCG Categories<br />
Category<br />
Position<br />
Market Share<br />
Key Brands<br />
Hair Care<br />
3<br />
12%<br />
<strong>Dabur</strong> Amla hair Oil, Vatika hair oil<br />
& Vatika Shampoos<br />
Oral Care<br />
3<br />
13%<br />
Red<br />
toothpaste, Babool, Meswak, Red<br />
toothpowder<br />
Skin Care 3<br />
7%<br />
<strong>Dabur</strong> Gulabari, Fem, <strong>Dabur</strong><br />
Uveda<br />
Ayurvedic<br />
Tonics<br />
1<br />
67%<br />
<strong>Dabur</strong> Chyawanprash<br />
Digestives<br />
1<br />
56%<br />
Hajmola<br />
Fruit Juices<br />
1<br />
52%<br />
Real Fruit Juices, Real Activ<br />
Honey<br />
1 50%<br />
<strong>Dabur</strong> Honey<br />
Glucose<br />
2 25%<br />
<strong>Dabur</strong> Glucose<br />
Hair care includes Hair Oils & Shampoos; Oral care includes Toothpastes & Toothpowder; Skin care includes moisturizers,<br />
face cleaning, lightening, anti ageing & other skin care products; Digestives includes herbal digestives<br />
16<br />
16
Agenda<br />
<strong>Dabur</strong> <strong>India</strong>-Introduction<br />
FMCG Industry Scenario<br />
Business Overview<br />
Growth Strategy<br />
Recent Performance<br />
17<br />
17
Business Structure<br />
<strong>Dabur</strong> operates through three focused Strategic Business Units<br />
68%<br />
Consumer Care<br />
Division<br />
International<br />
Business Division<br />
22%<br />
p g<br />
•FMCG portfolio comprising four<br />
distinct businesses:<br />
•Personal Care<br />
•Consumer Health Care<br />
•Home Care<br />
• Foods<br />
• Catering to health and personal<br />
care needs of customers across<br />
different international markets<br />
spanning Middle East and<br />
Africa, South Asia, EU and U.S.<br />
8%<br />
Consumer Health<br />
Division<br />
• Range of ethical and OTC<br />
products that deliver the age‐old<br />
benefits of Ayurveda in modern<br />
ready‐to‐use formats<br />
Note: Percentage share in revenue based on FY11 Financials ; Hobi and Namaste included in International Business Division<br />
18<br />
18
Consumer Care Division Overview<br />
FPD HCPD Balsara Foods FEM<br />
2003-2004 2006-2007 2007-2008 2008-2009<br />
CCD<br />
FPD: Family Products Division<br />
HCPD: Health Care Products Division<br />
Balsara and Fem were acquisitions<br />
Foods division was a 100% subsidiary of DIL<br />
Category-wise Share of CCD Sales<br />
CCD Sales - Historical<br />
in Rs. million<br />
30000<br />
25000<br />
20000<br />
15000<br />
10000<br />
27,912<br />
23,265<br />
18,658<br />
20,301 16,392<br />
14,013<br />
12,250<br />
10,158<br />
5000<br />
0<br />
FY04 FY05 FY06 FY07 FY08 FY09 FY10 FY11<br />
Note: Percentage share based on revenue for FY11<br />
19<br />
19
Consumer Care Division Categories<br />
Market Share<br />
Hair Oil<br />
Key Brands<br />
Value Share-ACN MAT Mar 2011<br />
<strong>Dabur</strong> Amla:<br />
Largest brand in<br />
the portfolio<br />
Vatika: Value added<br />
coconut oil<br />
Anmol Hair Oil:<br />
Value proposition<br />
Shampoo<br />
Market Share<br />
Key Brands<br />
Value Share-ACN MAT Dec-2010<br />
Vatika range of shampoos<br />
20<br />
20
Consumer Care Division Categories<br />
Market Share<br />
Oral Care<br />
Key Brands<br />
Value Share -ACN MAT Mar, 2011<br />
<strong>Dabur</strong> Red: Toothpaste<br />
& Toothpowder<br />
Babool: Targeted at<br />
economy segment<br />
Meswak: Premium<br />
therapeutic<br />
toothpaste<br />
Chyawanprash – Market Share<br />
Health Supplements<br />
Key Brands<br />
Volume Share-ACN MAT - Mar, 2011<br />
<strong>Dabur</strong> Chyawanprash:<br />
Largest selling health<br />
supplement in the<br />
country<br />
<strong>Dabur</strong> Glucose:<br />
2 nd largest<br />
player in the<br />
country<br />
<strong>Dabur</strong> Honey: Largest<br />
branded honey in the<br />
country; growing<br />
category through replace<br />
sugar strategy 21<br />
21
Consumer Care Division Categories<br />
Market Share<br />
Foods<br />
Key Brands<br />
Company Est. Mar, 2010 for Fruit Juice category<br />
Market Share*<br />
Real: Flagship<br />
beverages brand<br />
Skin Care<br />
Key Brands<br />
Real Activ: Range<br />
of 100% pure juice<br />
*Company estimates;<br />
Includes Fem skin care portfolio<br />
Gulabari range of rose<br />
based skin care<br />
products: Moisturizer,<br />
Face freshener & Rose<br />
water<br />
Uveda: Range of<br />
Ayurvedic Skin<br />
Care<br />
Fem Gold Bleach:<br />
Launched recently<br />
22<br />
22
Consumer Care Division Categories<br />
Market Share<br />
Digestives<br />
Key Brands<br />
Hajmola: Flagship brand<br />
Hajmola tasty t<br />
for branded Digestives<br />
digestive candy<br />
Value Share-ACN MAT Mar, 2011 for Herbal Digestives<br />
Market Share<br />
Home Care<br />
Key Brands<br />
Value Share-ACN March, 2011 for Mosquito<br />
Repellants Cream category<br />
Odonil: Air freshner<br />
range: Largest brand<br />
in the portfolio<br />
Odomos: Mosquito<br />
repellant skin cream<br />
Sanifresh:<br />
Toilet cleaner<br />
23<br />
23
Consumer Health Division<br />
Description<br />
CHD: Repository of <strong>Dabur</strong>’s Ayurvedic<br />
Healthcare knowledge<br />
Range of over 260 products<br />
Focusing on multiple therapeutic areas.<br />
Distribution coverage of 200,000<br />
chemists, ~12,000 vaidyas & 12,000<br />
Ayurvedic pharmacies<br />
• Focus on growing the OTC Health-Care<br />
portfolio aggressively<br />
CHD Structure<br />
OTC (64%) ETHICAL (36%)<br />
Generics<br />
Tonic<br />
Branded Products Classicals<br />
Branded Ethicals<br />
Healthcare Focus<br />
OTC Healthcare is Rs.130 billion size<br />
industry<br />
Expected to grow at 14-15% p.a. as<br />
preference for Over-the-Counter products<br />
accelerates<br />
<strong>Dabur</strong> to expand its presence by :<br />
Consolidating / expanding current<br />
portfolio<br />
Launching new products in<br />
emerging therapeutic areas<br />
Look at inorganic opportunities<br />
Acquired the energizer brand, Thirty<br />
Plus from Ajanta Pharma in May 2011<br />
Honitus: Day & Night<br />
for Cold and Flu relief<br />
Pudin Hara Lemon<br />
Fizz for digestion<br />
Promoting <strong>Dabur</strong> Ayurveda: Generating<br />
equity for Ethical portfolio<br />
24<br />
24
International Business Division<br />
• Started t as an<br />
• Set up a franchisee at<br />
• Renamed franchisee as <strong>Dabur</strong><br />
• Building scale-22% of<br />
Exporter<br />
• Focus on Order<br />
Dubai in 1989<br />
• Demand generation<br />
International <strong>Ltd</strong><br />
• Local operations further strengthened<br />
overall <strong>Dabur</strong> Sales (FY11)<br />
• High Levels of Localization<br />
fulfillment through led to setting up of • Set up new mfg facilities in Nigeria,RAK<br />
<strong>India</strong> Mfg.<br />
mfg in Dubai & Egypt & Bangladesh<br />
• Global Supply chain<br />
1980’s Early 90’s 2003 Onwards Today<br />
Highlights<br />
• <strong>Dabur</strong>’s overseas business contributes tib t 22%<br />
to consolidated sales led by CAGR of 32% in<br />
last 6 years<br />
• Focus markets:<br />
• GCC<br />
• Egypt<br />
• Nigeria<br />
• Turkey<br />
• Bangladesh<br />
• Nepal<br />
• U.S.<br />
• High level of localization of manufacturing<br />
and sales and marketing<br />
• Leveraging the “Natural” preference among<br />
locall consumers to increase share in personal<br />
care categories<br />
• Sustained investments in brand building and<br />
marketing<br />
10000<br />
9000<br />
8000<br />
7000<br />
6000<br />
5000<br />
4000<br />
3000<br />
2000<br />
1000<br />
0<br />
in Rs. million<br />
High Growth in IBD<br />
3,760<br />
1,281 1,807 2,258 2,917<br />
4,770<br />
6,025<br />
8,922<br />
FY04 FY05 FY06 FY07 FY08 FY09 FY10 FY11<br />
New products contributing<br />
significantly to overseas sales<br />
25<br />
25
Agenda<br />
<strong>Dabur</strong> <strong>India</strong>-Introduction<br />
FMCG Industry Scenario<br />
Business Overview<br />
Growth Strategy<br />
Recent Performance<br />
26<br />
26
Growth Strategy<br />
Three pronged Growth Strategy<br />
Expand Innovate Acquire<br />
Expand<br />
Our differentiation is the herbal and ayurvedic platform<br />
Strengthening presence in existing categories and markets as well entering new geographies<br />
Maintain dominant share in categories where we are category builders like Health Supplements,<br />
Honey etc. and expand market shares in other categories<br />
Calibrated international expansion – local manufacturing and supply chain to enhance flexibility<br />
/ reduce response time to change in market demands<br />
Innovate<br />
Strong focus on innovation. Have rolled out new variants & products which have contributed to<br />
around 5-6% of our growth p.a.<br />
Renovation of existing products to respond to changing demands (Toothpowder to Toothpaste)<br />
Acquire<br />
Acquisitions critical for building scale in existing categories & markets<br />
Should be synergistic and make a good strategic fit<br />
Target opportunities in our focus markets<br />
27<br />
27
Acquisition of Hobi Group, Turkey<br />
Acquisition of Hobi Group, Turkey for a total<br />
consideration of US$ 69 Million completed on<br />
October 7, 2010<br />
Hobi manufactures and markets hair, skin and<br />
body care products under the brands Hobby<br />
and New Era<br />
Product range of the company is<br />
complementary to our product range<br />
Acquisition provides an entry into another<br />
attractive emerging market and a good<br />
platform to leverage this across the region<br />
28<br />
28
Acquisition of Namaste Laboratories<br />
<strong>Dabur</strong> <strong>India</strong> <strong>Limited</strong> through its subsidiary <strong>Dabur</strong> International <strong>Limited</strong> acquired 100% stake<br />
in Namaste Laboratories LLC for $100 million, in an all-cash deal on January 1, 2011<br />
Namasté is a leading ethnic hair care products company, having products for women of<br />
colour, with revenues of $95 million from US, Europe, Middle East and African markets<br />
The company markets a portfolio of hair care products under the brand ‘Organic Root<br />
Stimulator’ and has a strong presence in ethnic hair care market for women of colour.<br />
Acquisition to enable entry into Ethnic Hair Care products market valued at more than US$1.5<br />
billion and tap into significant market opportunity in the fast growing, hugely populated (~1<br />
Bn) yet highlyhl underpenetrated t d consumer markets of Sub Saharan Africa<br />
At an acquisition price of $100 million, the deal value is at 1.1x Sales and 8.3x EBITDA<br />
29<br />
29
Agenda<br />
<strong>Dabur</strong> <strong>India</strong>-Introduction<br />
FMCG Industry Scenario<br />
Business Overview<br />
Growth Strategy<br />
Recent Performance<br />
30<br />
30
2 5 . 0 %<br />
2 0 . 0 %<br />
1 5 . 0 %<br />
1 0 . 0 %<br />
5 . 0 %<br />
0 . 0 %<br />
Recent Financial Performance<br />
Sales: FY11 v/s FY10<br />
EBITDA Margin: FY11 v/s FY10<br />
40000<br />
35000<br />
in Rs. million<br />
34,158<br />
41,099<br />
in %<br />
19.8% 19.9%<br />
30000<br />
25000<br />
20000<br />
15000<br />
10000<br />
5000<br />
0<br />
FY10<br />
FY11<br />
FY10<br />
FY11<br />
6000<br />
5000<br />
4000<br />
3000<br />
2000<br />
1000<br />
0<br />
in Rs. million<br />
PAT: FY11 v/s FY10<br />
5,032 5,686<br />
FY10<br />
FY11<br />
Sales for FY11 increased by<br />
20.3%, largely driven by volumes and<br />
acquisitions<br />
EBITDA margin was maintained<br />
despite input cost inflation<br />
PAT grew by 13.0% despite increase in<br />
in tax rate<br />
31<br />
31
Stock Performance & Shareholding Pattern<br />
Market Capitalization in Rs. billion<br />
Shareholding Structure*<br />
17<br />
210<br />
FIs/<br />
FIIs,<br />
<strong>India</strong>n<br />
MFs/Ins.<br />
17.4%<br />
Public<br />
Cos.,<br />
and<br />
7.1%<br />
Others,<br />
6.7%<br />
Promoter<br />
s, 68.7%<br />
2001 2011<br />
*As on May 6, 2011<br />
<strong>Dabur</strong> ranked as the organization o that offers the best return to investors s by<br />
the 6th Social & Corporate Governance Awards, presented by the Bombay<br />
Stock Exchange<br />
32<br />
32
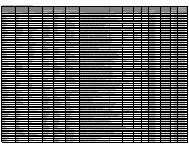
Consolidated P&L<br />
in Rs. million FY2010‐11 FY2009‐10 YoY (%)<br />
Gross Sales 41,099 34,158 20.3%<br />
Less:Excise Duty 324 253<br />
Net Sales 40,774 33,905 20.3%<br />
Other Operating Income 330 253 30.8%<br />
Material Cost 19,053 15,508 22.9%<br />
% of Sales 46.4% 45.4%<br />
Employee Costs 3,222 2,847 13.2%<br />
% of Sales 7.8% 8.3%<br />
Ad Pro 5,346 4,935 8.3%<br />
% of Sales 13.0% 14.4%<br />
Other Expenses 5,607 4,324 29.7%<br />
% of Sales 13.6% 12.7%<br />
Other Non Operating Income 321 230 39.9%<br />
EBITDA 8,198 6,773 21.0%<br />
% of Sales 19.9% 9% 19.8%<br />
Interest Exp. and Fin. Charges 303 202 50.1%<br />
Depreciation & Amortization 816 562 45.2%<br />
Profit Before Tax (PBT) 7,079 6,009 17.8%<br />
Tax Expenses 1,390 1,005 38.3% 3%<br />
Profit After Tax (PAT) 5,686 5,032 13.0%<br />
33<br />
33
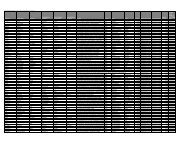
Consolidated Balance Sheet<br />
in Rs. million As on Mar 11 As on Mar 10<br />
Sources Of Funds<br />
Shareholders' Fund:<br />
Share Capital 1,741 869<br />
Reserves & Surplus 12,171 8,485<br />
13,912 9,354<br />
Minority i Interest 41 38<br />
Loan Funds:<br />
Secured Loans 703 702<br />
Unsecured Loans 9,807 10,510 1,091 1,793<br />
Deferred Tax Liability 189 107<br />
TOTAL 24,650 11,290<br />
Application of funds:<br />
Fixed Assets:<br />
Gross Block 19,337 9,857<br />
less: Depreciation 4,351 3,391<br />
Net block 14,986 6,466<br />
Capital WIP 430 301<br />
Investments 4,274 2,641<br />
Current Assets,Loans & Advances<br />
Inventories 7,085 4,262<br />
Sundry Debtors 3,555 1,198<br />
Cash & Bank balances 2,724 1,923<br />
Loans & Advances 5,161 18,525 3,674 11,057<br />
Less: Current Liabilities and<br />
Provisions:<br />
Current Liabilities 7,140 4,669<br />
Provisions 7,435 4,533<br />
14,575 9,202<br />
Net Current Assets 3,950 1,855<br />
Miscellaneous Expenditure 1,010 27<br />
TOTAL 24,650 11,290<br />
34<br />
34
Recent Accolades<br />
<strong>Dabur</strong> ranked 182 in the<br />
ET-500 list of <strong>India</strong> Inc's<br />
Heroes<br />
<strong>Dabur</strong> ranked 7th<br />
Most Respected<br />
Company in the Fast<br />
Moving Consumer<br />
Goods space in <strong>India</strong><br />
<strong>Dabur</strong> ranked among Top<br />
10 Best Companies To<br />
Work For in the Consumer<br />
Goods and Durables sector<br />
Chyawanprash, Hajmola,<br />
Real chosen by <strong>India</strong>n<br />
consumers as 'Power<br />
Brands 2010-11'<br />
<strong>Dabur</strong> ranked 200 in<br />
the Fortune <strong>India</strong> 500<br />
list that ranks <strong>India</strong>'s<br />
500 largest<br />
corporations<br />
<strong>Dabur</strong> ranked in the Top<br />
100 in Business Today's<br />
BT 500 list of <strong>India</strong>'s Most<br />
Valuable Companies.<br />
<strong>Dabur</strong> was ranked 62<br />
<strong>Dabur</strong> <strong>India</strong> <strong>Ltd</strong> awarded<br />
the Best Run Award In<br />
Supply Chain by SAP<br />
<strong>Dabur</strong> moves up to<br />
take the 78th spot in<br />
the Super-100 list,<br />
released by Business<br />
<strong>India</strong><br />
35<br />
35
Investor Relations<br />
<strong>Dabur</strong> <strong>India</strong> <strong>Ltd</strong><br />
Contact:+91-11-42786000<br />
36<br />
36