20 Information to Stakeholders Key Operating and Financial Data Six Years Summary 2008 2007 2006 2005 2004 2003 Rupees in '000 Trading Results New orders 52,236,070 32,039,600 25,337,253 17,715,216 11,514,501 6,049,459 Net turnover 26,880,742 21,901,752 20,795,847 13,132,819 7,110,456 5,812,128 Export of goods and services 444,267 105,427 131,623 517,676 412,471 472,290 Contracts executed outside <strong>Pakistan</strong> 12,374,212 5,610,671 4,657,654 3,271,416 -........ -........ Gross profit 4,013,861 3,218,529 2,451,757 1,764,595 1,252,137 1,002,054 Operating profit 2,691,173 2,022,635 1,675,351 1,383,165 786,631 622,884 Profit before tax excluding profit on sale of discontinued operations 2,564,203 1,964,574 1,508,320 1,232,899 760,716 616,919 Profit before tax from discontinued operations -........ 2,125,937 -........ -........ -........ -........ Profit after tax from continuing operations 1,679,068 680,286 735,390 778,876 412,562 649,971 Profit after tax from discontinued operations -........ 1,801,036 -........ -........ -........ -........ Earnings before interest, taxes, depreciation and amortisation 2,887,222 2,359,850 1,787,943 1,411,864 884,648 724,859 Interim dividend 247,411 233,088 279,706 233,088 155,392 101,005 Final dividend 494,822 494,822 233,088 186,470 233,088 101,005 Financial Position Share capital 82,470 82,470 77,696 77,696 77,696 77,696 Reserves and Retained Earnings 6,205,787 5,268,952 2,644,116 2,383,286 2,070,616 1,813,446 Property, plant and equipment 1,589,664 1,532,620 1,477,252 602,876 525,462 496,694 Net current assets 2,767,305 2,368,659 565,110 1,333,299 1,411,527 1,242,416 Long-term / deferred liabilities 106,091 113,680 124,290 45,536 10,256 6,786 Investors Information Gross profit in percent of sales 15% 14% 12% 13% 18% 17% Earnings per share (Rs) 203.06 300.87* 93.57 100.24 53.10 44.89 Profit before tax in percent of sales 10% 19%* 7% 9% 11% 11% Profit after tax in percent of sales 6% 11%* 4% 6% 6% 6% Inventory turnover (times) 5.90 6.65 9.28 8.91 5.38 4.09 Debtor turnover (times) 3.03 3.66 5.24 6.43 4.59 4.98 Creditor turnover (times) 2.17 2.54 2.89 2.96 2.43 2.51 Total assets turnover (times) 1.08 1.25 1.61 1.66 1.42 1.33 Fixed assets turnover (times) 16.85 14.23 12.86 19.98 12.50 11.68 Break-up value per share (Rs) 762.49 648.89 350.30 316.73 276.49 243.39 Market value per share (Rs) 1,210 1,689 980 671 480 355 High / low during the year (Rs) 2,054 / 1,209 1,869 / 975 1,365 / 650 719 / 480 579 / 341 449 / 196 EBITDA Margin 11% 11% 9% 11% 12% 12% Price earning ratio 5.96 5.61* 10.47 6.69 9.04 7.91 Cash dividend per share (Rs) 90 90 66 54 50 26 Dividend cover ratio 2.26 3.34 1.42 1.86 1.06 1.73 Dividend yield ratio 0.07 0.05 0.07 0.08 0.10 0.07 Dividend pay out ratio 44% 29% 70% 54% 94% 58% Return on equity / capital employed 27% 46%* 27% 32% 19% 19% Current ratio 1.15 1.20 1.06 1.25 1.50 1.50 Quick ratio 0.90 0.93 0.81 0.97 1.13 1.05 Interest cover (times) 23.94 25.04* 14.74 43.00 103.49 68.18 *Includes profit on sale of discontinued operations Cash Flows Net cash flow from operating activities 2,725,707 (2,247,614) 726,384 959,010 909,240 621,356 Net cash flow from investing activities (109,946) 2,351,293 (709,136) (192,549) (128,509) (41,410) Net cash flow from financing activities (1,071,159) (134,462) (464,982) (464,946) (255,796) (218,458) Net change in cash and cash equivalents 1,544,602 (30,783) (447,734) 301,515 524,935 361,488
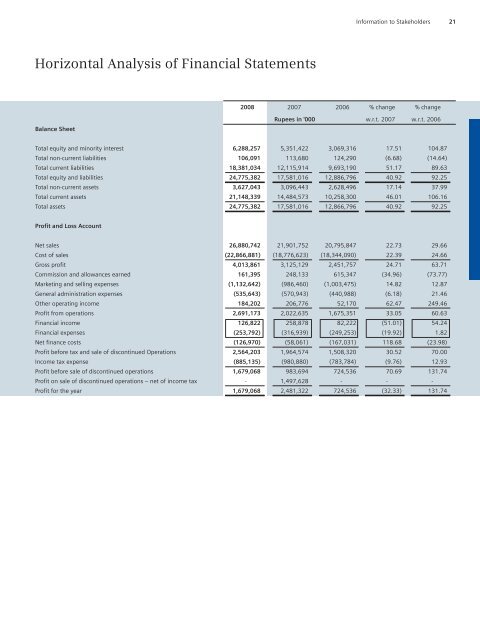
Information to Stakeholders 21 Horizontal Analysis of Financial Statements 2008 2007 2006 % change % change Balance Sheet Rupees in '000 w.r.t. 2007 w.r.t. 2006 Total equity and minority interest 6,288,257 5,351,422 3,069,316 17.51 104.87 Total non-current liabilities 106,091 113,680 124,290 (6.68) (14.64) Total current liabilities 18,381,034 12,115,914 9,693,190 51.17 89.63 Total equity and liabilities 24,775,382 17,581,016 12,886,796 40.92 92.25 Total non-current assets 3,627,043 3,096,443 2,628,496 17.14 37.99 Total current assets 21,148,339 14,484,573 10,258,300 46.01 106.16 Total assets 24,775,382 17,581,016 12,866,796 40.92 92.25 Profit and Loss Account Net sales 26,880,742 21,901,752 20,795,847 22.73 29.66 Cost of sales (22,866,881) (18,776,623) (18,344,090) 22.39 24.66 Gross profit 4,013,861 3,125,129 2,451,757 24.71 63.71 Commission and allowances earned 161,395 248,133 615,347 (34.96) (73.77) Marketing and selling expenses (1,132,642) (986,460) (1,003,475) 14.82 12.87 General administration expenses (535,643) (570,943) (440,988) (6.18) 21.46 Other operating income 184,202 206,776 52,170 62.47 249.46 Profit from operations 2,691,173 2,022,635 1,675,351 33.05 60.63 Financial income 126,822 258,878 82,222 (51.01) 54.24 Financial expenses (253,792) (316,939) (249,253) (19.92) 1.82 Net finance costs (126,970) (58,061) (167,031) 118.68 (23.98) Profit before tax and sale of discontinued Operations 2,564,203 1,964,574 1,508,320 30.52 70.00 Income tax expense (885,135) (980,880) (783,784) (9.76) 12.93 Profit before sale of discontinued operations 1,679,068 983,694 724,536 70.69 131.74 Profit on sale of discontinued operations – net of income tax -........ 1,497,628 -........ -........ -........ Profit for the year 1,679,068 2,481,322 724,536 (32.33) 131.74
- Page 1 and 2: 1 Annual Report 2008 Pakistan Answe
- Page 3 and 4: Mission 3 Mission To realize our vi
- Page 5 and 6: Contents 5 Corporate Governance At
- Page 7 and 8: Corporate Strategies 7 Overall Corp
- Page 9 and 10: Our Values 9 Our values Highest per
- Page 11 and 12: Code of conduct and ethics 11 We ar
- Page 14 and 15: 14 Board of Directors Board of Dire
- Page 16 and 17: 16 Board of Directors Mr. Klaus Ste
- Page 18 and 19: 18 Committees Board Committees Mana
- Page 22 and 23: 22 Information to Stakeholders Vert
- Page 24 and 25: 24 Directors’ Report Dear Shareho
- Page 26 and 27: 26 Directors’ Report Performance
- Page 28 and 29: 28 Directors’ Report Industry Sec
- Page 30 and 31: 30 Directors’ Report Within Count
- Page 32 and 33: 32 Directors’ Report Corporate Go
- Page 34 and 35: 34 Directors’ Report Board of Dir
- Page 36 and 37: 36 Directors’ Report Changes in t
- Page 38 and 39: 38 Directors’ Report Reviewed aud
- Page 40 and 41: 40 Directors’ Report Enterprise R
- Page 42 and 43: 42 Directors’ Report Corporate Co
- Page 44 and 45: 44 Directors’ Report
- Page 46 and 47: 46 Directors’ Report 2,500 Nation
- Page 48 and 49: 48 Directors’ Report Human Excell
- Page 50 and 51: 50 Directors’ Report Investment i
- Page 52 and 53: 52 Directors’ Report 3i Program S
- Page 54 and 55: 54 Directors’ Report Cash Flow Ma
- Page 56 and 57: 56 Directors’ Report Acknowledgem
- Page 58 and 59: 58 Fit4 2010 Fit4 2010 - Tapping th
- Page 60 and 61: 60 Fit4 2010 Operational Excellence
- Page 62 and 63: 62 Fit4 2010 We succeed through our
- Page 64 and 65: 64 Fit4 2010 Leadership Excellence
- Page 66 and 67: 66 Innovation at Siemens "Companies
- Page 68 and 69: 68 Power Transmission & Distributio
- Page 70 and 71:
70 Power Transmission & Distributio
- Page 72 and 73:
72 Power Transmission & Distributio
- Page 74 and 75:
74 Power Transmission & Distributio
- Page 76 and 77:
76 Power Transmission & Distributio
- Page 78 and 79:
78 Power Transmission & Distributio
- Page 80 and 81:
80 Power Transmission & Distributio
- Page 82 and 83:
82 Industry, Infrastructure & Power
- Page 84 and 85:
84 Industry, Infrastructure & Power
- Page 86 and 87:
86 Industry, Infrastructure & Power
- Page 88 and 89:
88 Industry, Infrastructure & Power
- Page 90 and 91:
90 Industry, Infrastructure & Power
- Page 92 and 93:
92 Industry, Infrastructure & Power
- Page 94 and 95:
94 Automation & Drives
- Page 96 and 97:
96 Automation & Drives Generating S
- Page 98 and 99:
98 Automation & Drives Standard Pro
- Page 100 and 101:
100 Medical, OEM Onshore, Transport
- Page 102 and 103:
102 Medical, OEM Onshore, Transport
- Page 104 and 105:
104 Innovation at Siemens SOMATOM D
- Page 106 and 107:
106 Medical, OEM Onshore, Transport
- Page 108 and 109:
108 Locally manufactured products &
- Page 110 and 111:
110 Locally manufactured products &
- Page 112 and 113:
112 Locally manufactured products &
- Page 114 and 115:
114 Locally manufactured products &
- Page 116 and 117:
116 Locally manufactured products &
- Page 118 and 119:
118 Innovation at Siemens
- Page 120 and 121:
120
- Page 122 and 123:
Statement of Compliance 121 16. All
- Page 124 and 125:
Auditors’ Report 123 Auditors’
- Page 126 and 127:
Balance Sheet 125 Siemens (Pakistan
- Page 128 and 129:
Cash Flow Statement 127 Siemens (Pa
- Page 130 and 131:
Notes to the Financial Statements 1
- Page 132 and 133:
Notes to the Financial Statements 1
- Page 134 and 135:
Notes to the Financial Statements 1
- Page 136 and 137:
Notes to the Financial Statements 1
- Page 138 and 139:
Notes to the Financial Statements 1
- Page 140 and 141:
Notes to the Financial Statements 1
- Page 142 and 143:
Notes to the Financial Statements 1
- Page 144 and 145:
Notes to the Financial Statements 1
- Page 146 and 147:
Notes to the Financial Statements 1
- Page 148 and 149:
Notes to the Financial Statements 1
- Page 150 and 151:
Notes to the Financial Statements 1
- Page 152 and 153:
Notes to the Financial Statements 1
- Page 154 and 155:
Notes to the Financial Statements 1
- Page 156 and 157:
Investors Relations 155 Notice of M
- Page 158 and 159:
Investors Relations 157 Siemens (Pa
- Page 160 and 161:
Investors Relations 159 Registrar a