Terrestrial Gross Carbon Dioxide Uptake: Global ... - LUCCI
Terrestrial Gross Carbon Dioxide Uptake: Global ... - LUCCI
Terrestrial Gross Carbon Dioxide Uptake: Global ... - LUCCI

Create successful ePaper yourself
Turn your PDF publications into a flip-book with our unique Google optimized e-Paper software.
variation between biomes and sites (3–5). In the<br />
absence of direct observations, a combined GPP<br />
of all terrestrial ecosystems of 120 Pg C year −1<br />
was obtained (6) by doubling global biomass production<br />
estimates (7) without an empirical basis of<br />
spatially resolved biomass production and its relationship<br />
to GPP. A global terrestrial GPP of 100 to<br />
150PgCyear −1 is consistent with the observed<br />
variation of 18 OCO in the atmosphere (8, 9). However,<br />
the ability of 18 OCO to constrain GPP de-<br />
1<br />
Biogeochemical Model-Data Integration Group, Max Planck<br />
Institute for Biogeochemistry, 07745 Jena, Germany. 2 Laboratoire<br />
des Sciences du Climat et de L’Environnement, Institut<br />
Pierre Simon Laplace, CEA-CNRS-UVSQ, Gif-sur-Yvette, France.<br />
3<br />
Faculdade de Ciências e Tecnologia (FCT), Universidade Nova<br />
de Lisboa, Caparica, Portugal. 4 Biogeochemical Systems, Max<br />
Planck Institute for Biogeochemistry, 07745 Jena, Germany.<br />
5<br />
McMaster Centre for Climate Change, McMaster University,<br />
Hamilton, Ontario, Canada. 6 Department of Environmental Science,<br />
Policy and Management and Berkeley Atmospheric Science Center,<br />
University of California, Berkeley, CA 94720, USA. 7 National Center<br />
forAtmosphericResearch,Boulder,CO80305,USA. 8 Potsdam<br />
Institute for Climate Impact Research (PIK), 14473 Potsdam,<br />
Germany. 9 Climate Change Unit, Institute for Environment and<br />
Sustainability, European Commission, DG Joint Research Centre,<br />
Ispra, Italy. 10 Department of Earth and Ecosystem Science, Lund<br />
University, Sweden. 11 Department of Animal and Plant Sciences,<br />
University of Sheffield, Sheffield S10 2TN, UK. 12 Departement<br />
Biologie, Universiteit Antwerpen, Belgium. 13 Centre d’étude de<br />
la forêt, Faculté de foresterie, de géographie et de géomatique,<br />
Université Laval, Quebec, Canada. 14 Cirad-Persyst, UPR80,<br />
Fonctionnement et Pilotage des Ecosystémes de Plantation,<br />
Montpellier, France. 15 CATIE (Centro Agronómico Tropical de<br />
Investigación y Enseñanza), Turrialba, Costa Rica. 16 Nature<br />
Conservation and Plant Ecology Group, Wageningen University,<br />
Netherlands. 17 Graduate School of Geography, Clark University,<br />
Worcester, MA 01610, USA. 18 Department of Forest Environment<br />
and Resources, University of Tuscia, Viterbo, Italy.<br />
*To whom correspondence should be addressed. E-mail:<br />
christian.beer@bgc-jena.mpg.de<br />
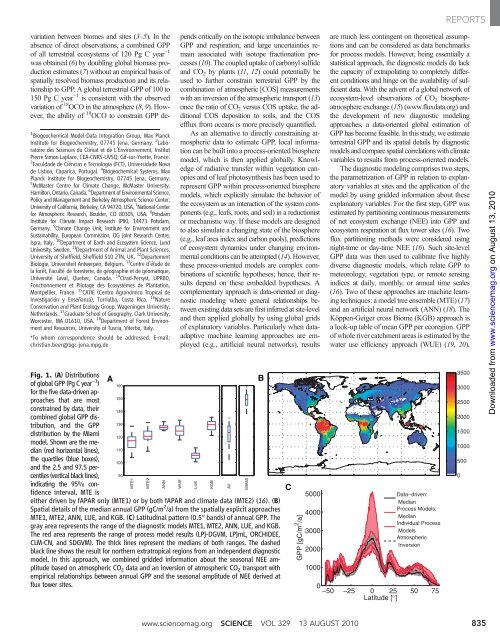
Fig. 1. (A) Distributions<br />
of global GPP (Pg C year −1 )<br />
for the five data-driven approaches<br />
that are most<br />
constrained by data, their<br />
combined global GPP distribution,<br />
and the GPP<br />
distribution by the Miami<br />
model. Shown are the median<br />
(red horizontal lines),<br />
the quartiles (blue boxes),<br />
and the 2.5 and 97.5 percentiles<br />
(vertical black lines),<br />
indicating the 95% con-<br />
fidence interval. MTE is<br />
A<br />
160<br />
150<br />
140<br />
130<br />
120<br />
110<br />
100<br />
90<br />
MTE1<br />
MTE2<br />
pends critically on the isotopic imbalance between<br />
GPP and respiration, and large uncertainties remain<br />
associated with isotope fractionation processes<br />
(10). The coupled uptake of carbonyl sulfide<br />
and CO2 by plants (11, 12) could potentially be<br />
used to further constrain terrestrial GPP by the<br />
combination of atmospheric [COS] measurements<br />
with an inversion of the atmospheric transport (13)<br />
once the ratio of CO2 versus COS uptake, the additional<br />
COS deposition to soils, and the COS<br />
efflux from oceans is more precisely quantified.<br />
As an alternative to directly constraining atmospheric<br />
data to estimate GPP, local information<br />
can be built into a process-oriented biosphere<br />
model, which is then applied globally. Knowledge<br />
of radiative transfer within vegetation canopies<br />
and of leaf photosynthesis has been used to<br />
represent GPP within process-oriented biosphere<br />
models, which explicitly simulate the behavior of<br />
the ecosystem as an interaction of the system components<br />
(e.g., leafs, roots, and soil) in a reductionist<br />
or mechanistic way. If these models are designed<br />
to also simulate a changing state of the biosphere<br />
(e.g., leaf area index and carbon pools), predictions<br />
of ecosystem dynamics under changing environmental<br />
conditions can be attempted (14). However,<br />
these process-oriented models are complex combinations<br />
of scientific hypotheses; hence, their results<br />
depend on these embedded hypotheses. A<br />
complementary approach is data-oriented or diagnostic<br />
modeling where general relationships between<br />
existing data sets are first inferred at site-level<br />
and then applied globally by using global grids<br />
of explanatory variables. Particularly when dataadaptive<br />
machine learning approaches are employed<br />
(e.g., artificial neural networks), results<br />
either driven by fAPAR only (MTE1) or by both fAPAR and climate data (MTE2) (16). (B)<br />
Spatial details of the median annual GPP (gC/m 2 /a) from the spatially explicit approaches<br />
MTE1, MTE2, ANN, LUE, and KGB. (C) Latitudinal pattern (0.5° bands) of annual GPP. The<br />
gray area represents the range of the diagnostic models MTE1, MTE2, ANN, LUE, and KGB.<br />
The red area represents the range of process model results (LPJ-DGVM, LPJmL, ORCHIDEE,<br />
CLM-CN, and SDGVM). The thick lines represent the medians of both ranges. The dashed<br />
blacklineshowstheresultfornorthernextratropical regions from an independent diagnostic<br />
model. In this approach, we combined gridded information about the seasonal NEE amplitude<br />
based on atmospheric CO2 data and an inversion of atmospheric CO2 transport with<br />
empirical relationships between annual GPP and the seasonal amplitude of NEE derived at<br />
flux tower sites.<br />
ANN<br />
WUE<br />
LUE<br />
KGB<br />
All<br />
MIAMI<br />
B<br />
C<br />
GPP [gC/m 2 /a]<br />
5000<br />
4000<br />
3000<br />
2000<br />
1000<br />
are much less contingent on theoretical assumptions<br />
and can be considered as data benchmarks<br />
for process models. However, being essentially a<br />
statistical approach, the diagnostic models do lack<br />
the capacity of extrapolating to completely different<br />
conditions and hinge on the availability of sufficient<br />
data. With the advent of a global network of<br />
ecosystem-level observations of CO 2 biosphereatmosphere<br />
exchange (15) (www.fluxdata.org) and<br />
the development of new diagnostic modeling<br />
approaches, a data-oriented global estimation of<br />
GPP has become feasible. In this study, we estimate<br />
terrestrial GPP and its spatial details by diagnostic<br />
models and compare spatial correlations with climate<br />
variables to results from process-oriented models.<br />
The diagnostic modeling comprises two steps,<br />
the parametrization of GPP in relation to explanatory<br />
variables at sites and the application of the<br />
model by using gridded information about these<br />
explanatory variables. For the first step, GPP was<br />
estimated by partitioning continuous measurements<br />
of net ecosystem exchange (NEE) into GPP and<br />
ecosystem respiration at flux tower sites (16). Two<br />
flux partitioning methods were considered using<br />
night-time or day-time NEE (16). Such site-level<br />
GPP data was then used to calibrate five highly<br />
diverse diagnostic models, which relate GPP to<br />
meteorology, vegetation type, or remote sensing<br />
indices at daily, monthly, or annual time scales<br />
(16). Two of these approaches are machine learning<br />
techniques: a model tree ensemble (MTE) (17)<br />
and an artificial neural network (ANN) (18). The<br />
Köppen-Geiger cross Biome (KGB) approach is<br />
a look-up table of mean GPP per ecoregion. GPP<br />
of whole river catchment areas is estimated by the<br />
water use efficiency approach (WUE) (19, 20),<br />
Data−driven:<br />
Median<br />
Process Models:<br />
Median<br />
Individual Process<br />
Models<br />
Atmospheric<br />
Inversion<br />
0<br />
−50 −25 0 25 50 75<br />
Latitude [°]<br />
REPORTS<br />
www.sciencemag.org SCIENCE VOL 329 13 AUGUST 2010 835<br />
3500<br />
3000<br />
2500<br />
2000<br />
1500<br />
1000<br />
500<br />
0<br />
on August 13, 2010<br />
www.sciencemag.org<br />
Downloaded from