Journal_1_2014_final_WEB
Journal_1_2014_final_WEB
Journal_1_2014_final_WEB

You also want an ePaper? Increase the reach of your titles
YUMPU automatically turns print PDFs into web optimized ePapers that Google loves.
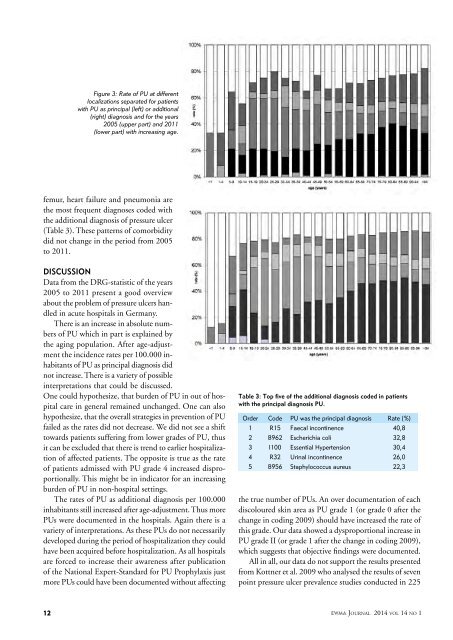
Figure 3: Rate of PU at different<br />
localizations separated for patients<br />
with PU as principal (left) or additional<br />
(right) diagnosis and for the years<br />
2005 (upper part) and 2011<br />
(lower part) with increasing age.<br />
femur, heart failure and pneumonia are<br />
the most frequent diagnoses coded with<br />
the additional diagnosis of pressure ulcer<br />
(Table 3). These patterns of comorbidity<br />
did not change in the period from 2005<br />
to 2011.<br />
Discussion<br />
Data from the DRG-statistic of the years<br />
2005 to 2011 present a good overview<br />
about the problem of pressure ulcers handled<br />
in acute hospitals in Germany.<br />
There is an increase in absolute numbers<br />
of PU which in part is explained by<br />
the aging population. After age-adjustment<br />
the incidence rates per 100.000 inhabitants<br />
of PU as principal diagnosis did<br />
not increase. There is a variety of possible<br />
interpretations that could be discussed.<br />
One could hypothesize, that burden of PU in out of hospital<br />
care in general remained unchanged. One can also<br />
hypothesize, that the overall strategies in prevention of PU<br />
failed as the rates did not decrease. We did not see a shift<br />
towards patients suffering from lower grades of PU, thus<br />
it can be excluded that there is trend to earlier hospitalization<br />
of affected patients. The opposite is true as the rate<br />
of patients admissed with PU grade 4 increased disproportionally.<br />
This might be in indicator for an increasing<br />
burden of PU in non-hospital settings.<br />
The rates of PU as additional diagnosis per 100.000<br />
inhabitants still increased after age-adjustment. Thus more<br />
PUs were documented in the hospitals. Again there is a<br />
variety of interpretations. As these PUs do not necessarily<br />
developed during the period of hospitalization they could<br />
have been acquired before hospitalization. As all hospitals<br />
are forced to increase their awareness after publication<br />
of the National Expert-Standard for PU Prophylaxis just<br />
more PUs could have been documented without affecting<br />
Table 3: Top five of the additional diagnosis coded in patients<br />
with the principal diagnosis PU.<br />
Order Code PU was the principal diagnosis Rate (%)<br />
1 R15 Faecal incontinence 40,8<br />
2 B962 Escherichia coli 32,8<br />
3 I100 Essential Hypertension 30,4<br />
4 R32 Urinal incontinence 26,0<br />
5 B956 Staphylococcus aureus 22,3<br />
the true number of PUs. An over documentation of each<br />
discoloured skin area as PU grade 1 (or grade 0 after the<br />
change in coding 2009) should have increased the rate of<br />
this grade. Our data showed a dysproportional increase in<br />
PU grade II (or grade 1 after the change in coding 2009),<br />
which suggests that objective findings were documented.<br />
All in all, our data do not support the results presented<br />
from Kottner et al. 2009 who analysed the results of seven<br />
point pressure ulcer prevalence studies conducted in 225<br />
12<br />
EWMA <strong>Journal</strong> <strong>2014</strong> vol 14 no 1