Download PDF - Field Exchange - Emergency Nutrition Network
Download PDF - Field Exchange - Emergency Nutrition Network
Download PDF - Field Exchange - Emergency Nutrition Network

Create successful ePaper yourself
Turn your PDF publications into a flip-book with our unique Google optimized e-Paper software.
Research<br />
recovery of market system actors in the<br />
affected areas. Therefore it was likely<br />
that prices would take time to decrease<br />
to pre-crisis levels as traders tried to<br />
compensate for their losses.<br />
• The decrease in bean demand due to lack<br />
of cash or food aid reduced trader incentive<br />
to rehabilitate and recover their<br />
activities. This was especially worrying<br />
in Gonaives, where the rehabilitation<br />
process would take longer due to enormous<br />
amounts of mud clogging the<br />
streets and a large number of poorly<br />
coordinated responses between agencies.<br />
• Poor households (including producers)<br />
rely heavily on cash to purchase more<br />
than half of the food consumed. Higher<br />
prices mean that many are forced to<br />
consume less and risk nutritional deterioration.<br />
Although food aid filled the gap<br />
for some households, targeting was difficult<br />
and many were not included.<br />
Recommendations included:<br />
• Increase the purchasing power of target<br />
beneficiaries by injecting cash into the<br />
local economy via cash transfer<br />
programmes.<br />
• Provide support to some traders that may<br />
need access to credit in order to re-stock<br />
(particularly in Gonaives) or to rebuild<br />
storage facilities (wholesalers in Gonaives).<br />
• Provide bean seeds and agricultural<br />
inputs to farmers to ensure planting of<br />
the subsequent crop.<br />
• Stopping food aid by the time the next<br />
harvest begins.<br />
• Food for Work and Cash for Work activity<br />
timing should consider seasonal livelihood<br />
activities/opportunities to ensure<br />
labour availability.<br />
• Stagger implementation periods based<br />
recovery capacities. In La Vallee and<br />
Bainet, targeted distributions may only<br />
be necessary until the next harvest if<br />
farmers are assisted to recover through<br />
targeted agricultural inputs.<br />
• As households frequent markets 3 – 5<br />
times/week, buying in small quantities<br />
(due to lack of cash, storage facilities and<br />
refrigeration), organisations should<br />
consider these aspects and security risks<br />
for those receiving large amounts of<br />
assistance.<br />
• During harvest months, agencies should<br />
complement the local availability of food<br />
by implementing interventions that<br />
harness local production.<br />
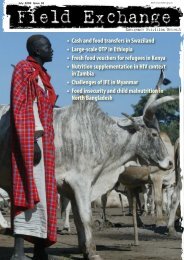
UNMIS/Tim McKulca, Sudan, 2008<br />
Challenging the accuracy of<br />
‘hungry’ figures<br />
Summary of published research 1<br />
A figure of 850 million hungry people on the<br />
planet was cited at the G8 summit in Tokyo in<br />
July 2008. However, the accuracy of such public<br />
statements is rarely scrutinised. A recent article<br />
in the Lancet challenges the technical basis of<br />
such claims.<br />
The above figure and indicator most<br />
frequently cited for the magnitude and severity<br />
of hunger is the Food and Agriculture<br />
Organisation’s (FAO) proportion of the population<br />
undernourished. The indicator is also used<br />
to monitor the progress towards Millennium<br />
Development Goal 1 (MDG1). The figure has<br />
been questioned in terms of inadequacy of<br />
adjustments for calorie requirements.<br />
However, the Lancet article levels more serious<br />
criticisms at the estimate. The fact that the data<br />
are derived from food availability data is the<br />
main problem. This is a macro-economic indicator<br />
based on national food balance sheet<br />
analysis and therefore tells us nothing about<br />
the hungry, e.g. who they are, where they are<br />
and how they look.<br />
Another frequently cited indicator is the<br />
prevalence of underweight children under 5<br />
years of age, which is also used for monitoring<br />
the progress towards MDG1. The author<br />
acknowledges that this is more meaningful in<br />
that it is derived from actual measurements of<br />
individuals. However, there are still three types<br />
of limitation. First, malnutrition is not caused<br />
exclusively by household food security but also<br />
by other factors, e.g. disease, inappropriate<br />
feeding practices. Therefore, there may be false<br />
<strong>Emergency</strong> food distribution in Agok, Sudan.<br />
positives, i.e. those underweight but not<br />
hungry or food insecure. Second, since there is<br />
an obvious lag between becoming hungry and<br />
then becoming underweight, the indicator lacks<br />
time-sensitivity. Third, the indicator overlooks<br />
a parental behaviour common across countries:<br />
parents tend to ensure food for their children by<br />
reducing their own portions. The prevalence of<br />
underweight children cannot be extrapolated to<br />
an estimation of hunger in older age groups<br />
because of this risk of underestimation.<br />
According to the author, the proportion of<br />
the population below the national poverty line<br />
for food can also be used as a proxy indicator<br />
for hungry people. This is generally defined as<br />
the expenditure needed to purchase the food<br />
basket that meets the country-specific minimum<br />
calorie requirements for an individual.<br />
However, the indicator is not readily available<br />
across countries, probably because of the lack of<br />
standardisation in defining the food basket.<br />
The author also points out weaknesses in<br />
definitions of food security and the lack of a<br />
threshold and concludes that hunger will<br />
continue to be relevant after 2015 (the target<br />
year of the MDGs) and that appropriate indicators<br />
for hunger need urgent reconsideration. As<br />
the author puts it “the moment this is being<br />
read, someone, somewhere in the world is<br />
becoming hungry and that person must be<br />
counted.”<br />
1<br />
Aiga. H (2008). How many people are really hungry?<br />
www.thelancet.com, vol 372, October 18th, 2008<br />
How to get involved or access more<br />
information<br />
For more information and access to EMMA<br />
outputs please sign on to D groups site:<br />
www.dgroups.org/groups/RMAT or email<br />
Mike Albu,<br />
email: mike.albu@practicalaction.org.uk<br />
4<br />
Key Findings and Recommendations EMMA Pilot Test 3<br />
– Haiti Sept 29 – October 14th. Anita Auerbach Practical<br />
Action Consulting<br />
5<br />
International Federation of the Red Cross and Red<br />
Crescent Societies<br />
6<br />
www.acdivoca.org<br />
7<br />
Tropical Storm Fay was the first to hit, on 15 and 16<br />
August, followed by Hurricane Gustav on 26 August.<br />
Tropical storms Hanna and Ike brought with them more<br />
high winds and rain on 1 and 6 September. The storms<br />
struck all 10 of Haiti's regions.<br />
6